| Param | Original file | Final file |
|---|---|---|
| Filename | modeM0/AS1A14_099T04_9000006540_55697cztM0_level2.fits | modeM0/AS1A14_099T04_9000006540_55697cztM0_level2_quad_clean.evt |
| Size (bytes) | 518,915,520 | 111,775,680 |
| Size | 494.9 MB | 106.6 MB |
| Events in quadrant A | 4,564,362 | 707,060 |
| Events in quadrant B | 3,546,563 | 787,482 |
| Events in quadrant C | 3,841,224 | 707,586 |
| Events in quadrant D | 6,641,722 | 632,462 |
| Mode M0 | |||
|---|---|---|---|
| Quadrant | BADHDUFLAG | Total packets | Discarded packets |
| A | 0 | 19283 | 0 |
| B | 0 | 16745 | 0 |
| C | 0 | 17643 | 0 |
| D | 0 | 25392 | 4 |
| Mode SS | |||
|---|---|---|---|
| Quadrant | BADHDUFLAG | Total packets | Discarded packets |
| A | 0 | 158 | 0 |
| B | 0 | 158 | 0 |
| C | 0 | 158 | 0 |
| D | 0 | 158 | 0 |
| Quadrant | Total seconds | Saturated seconds | Saturation percentage |
|---|---|---|---|
| A | 7911 | 325 | 4.108204% |
| B | 7912 | 82 | 1.036400% |
| C | 7912 | 91 | 1.150152% |
| D | 7911 | 581 | 7.344204% |
Noise dominated data is calculated using 1-second bins in cleaned event files. If a bin has >2000 counts, and if more than 50% of those come from <1% of pixels, then it is considered to be noise-dominated and hence unusable.
| Quadrant | # 1 sec bins | Bins with >0 counts | Bins with >2000 counts | High rate bins dominated by noise | Noise dominated (total time) | Noise dominated (detector-on time) | Marked lightcurve |
|---|---|---|---|---|---|---|---|
| A | 7911 | 7911 | 78 | 78 | 0.99% | 0.99% |  |
| B | 7912 | 7912 | 2 | 2 | 0.03% | 0.03% |  |
| C | 7912 | 7912 | 68 | 68 | 0.86% | 0.86% |  |
| D | 7911 | 7911 | 567 | 567 | 7.17% | 7.17% |  |
Top three noisy pixels from each quadrant. If the there are fewer than three noisy pixels in the level2.evt file, extra rows are filled as -1
| Pixel properties | Quadrant properties | ||||||
|---|---|---|---|---|---|---|---|
| Quadrant | DetID | PixID | Counts | Sigma | Mean | Median | Sigma |
| A | 15 | 32 | 999035 | 4924.45 | 829 | 808 | 202.7 |
| A | 8 | 249 | 106687 | 522.32 | 829 | 808 | 202.7 |
| A | 5 | 241 | 93095 | 455.27 | 829 | 808 | 202.7 |
| B | 0 | 199 | 71457 | 391.04 | 834 | 803 | 180.7 |
| B | 4 | 190 | 41787 | 226.83 | 834 | 803 | 180.7 |
| B | 2 | 249 | 40404 | 219.17 | 834 | 803 | 180.7 |
| C | 13 | 3 | 192633 | 854.64 | 815 | 805 | 224.5 |
| C | 6 | 223 | 153758 | 681.44 | 815 | 805 | 224.5 |
| C | 12 | 250 | 96507 | 426.37 | 815 | 805 | 224.5 |
| D | 11 | 129 | 3175382 | 13999.88 | 799 | 761 | 226.8 |
| D | 8 | 245 | 171882 | 754.63 | 799 | 761 | 226.8 |
| D | 7 | 129 | 124590 | 546.08 | 799 | 761 | 226.8 |
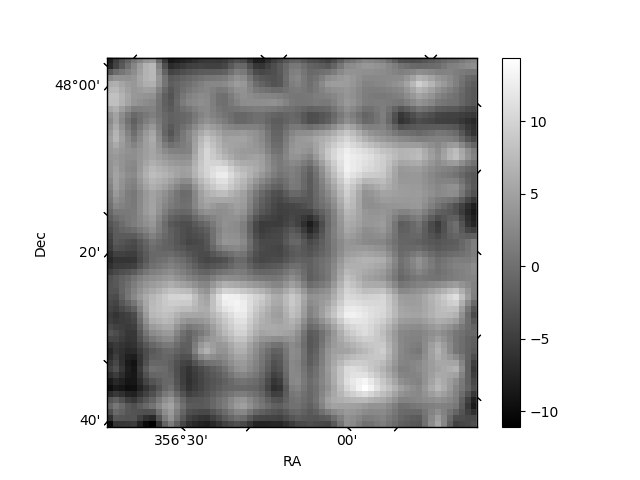
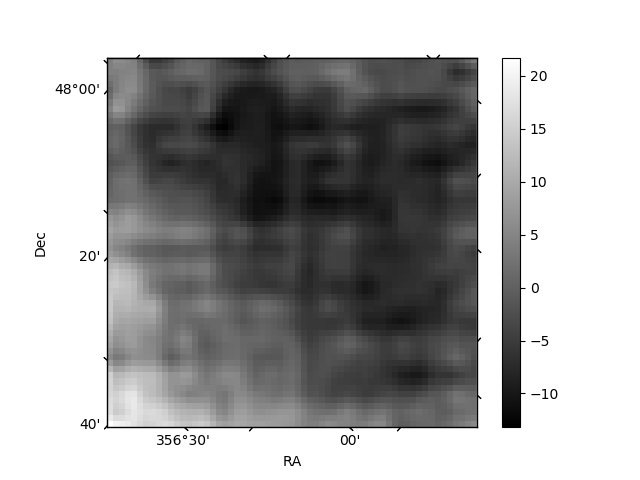
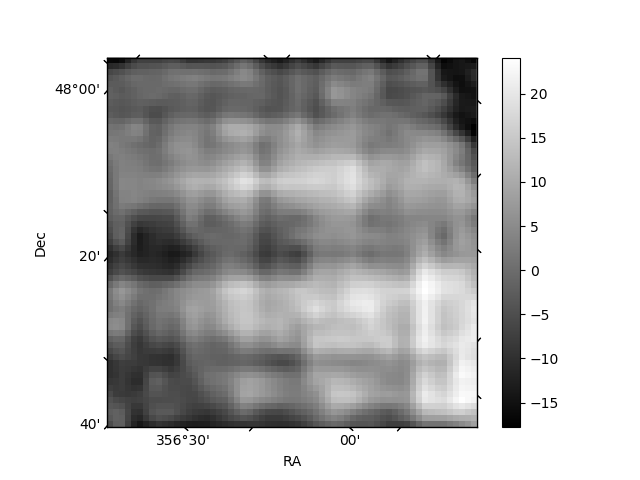
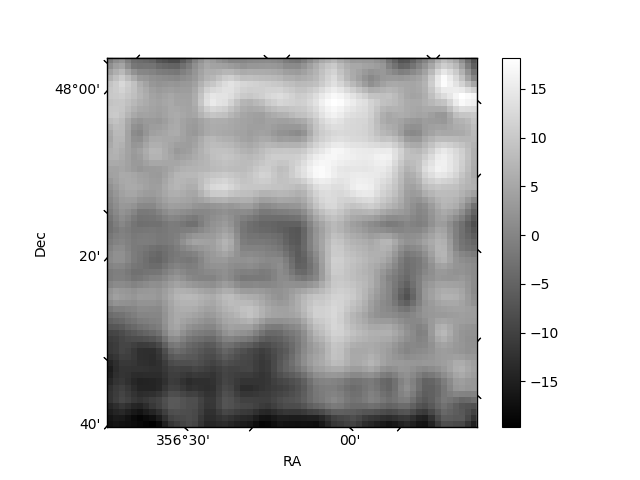
Histogram calculated using DETX and DETY for each event in the final _common_clean file
| Quadrant A | 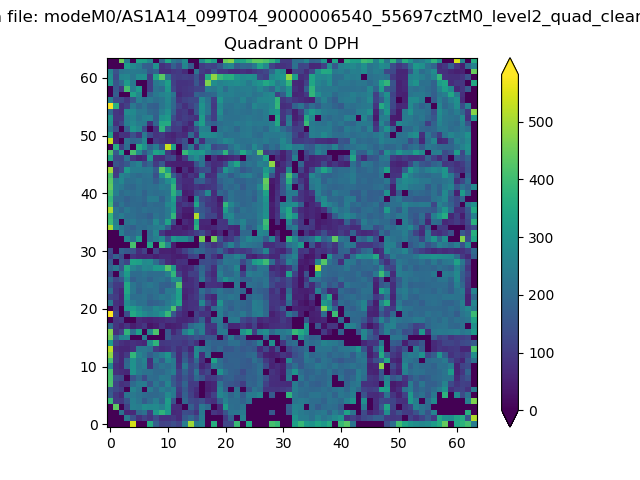 |
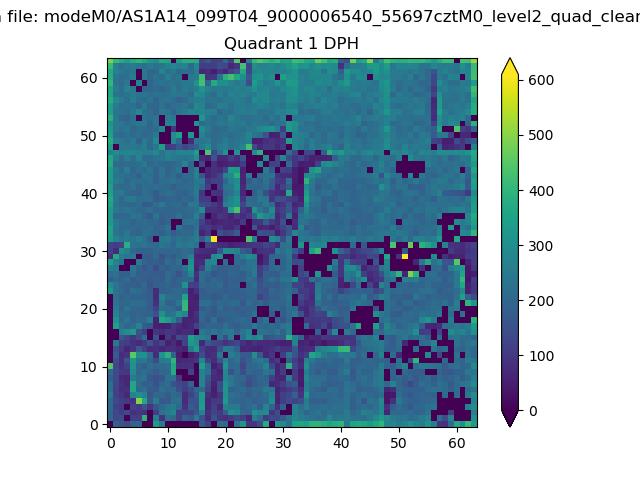 |
Quadrant B |
|---|---|---|---|
| Quadrant D | 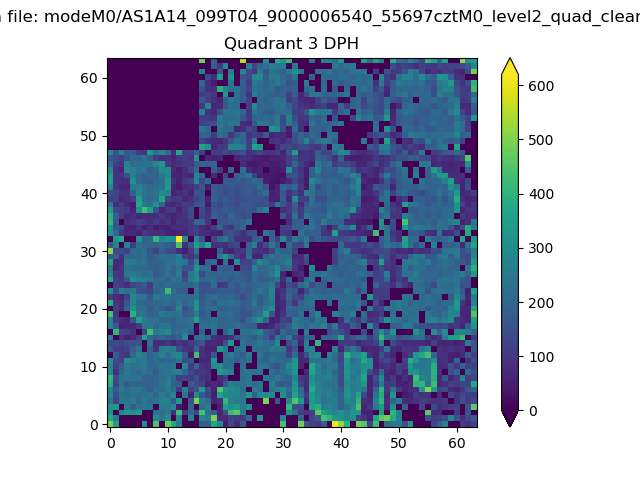 |
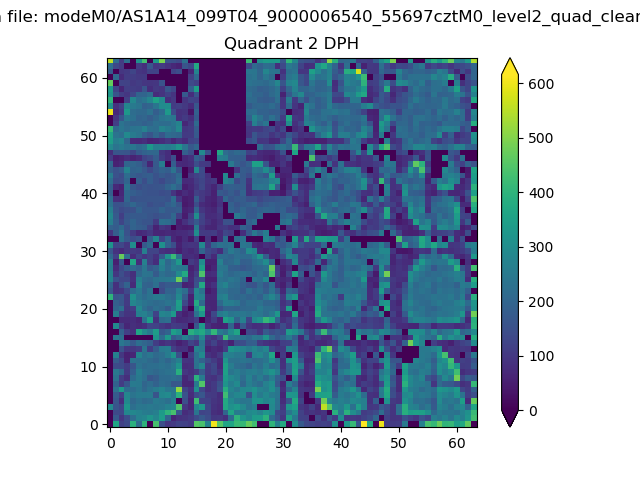 |
Quadrant C |
| Plot type | Count rate plots | Images |
|---|---|---|
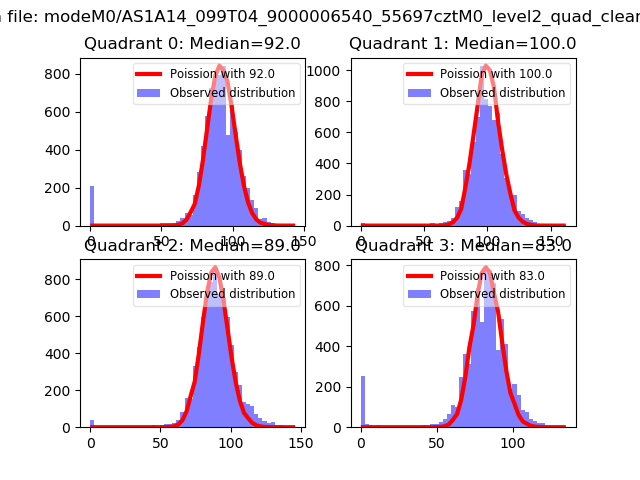
| Comparison with Poisson distribution Blue bars denote a histogram of data divided into 1 sec bins. Red curve is a Poisson curve with rate = median count rate of data. |
 |
 |
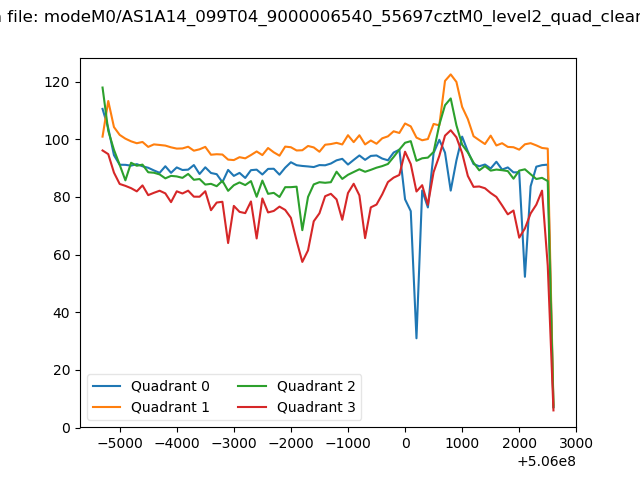
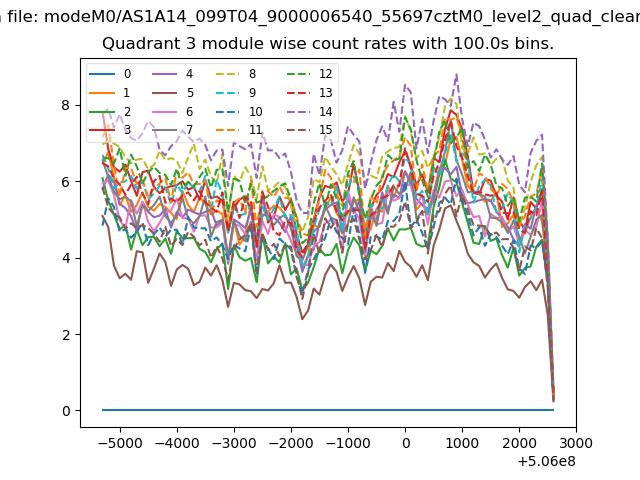
| Quadrant-wise count rates Data is divided into 100 sec bins |
 |
|
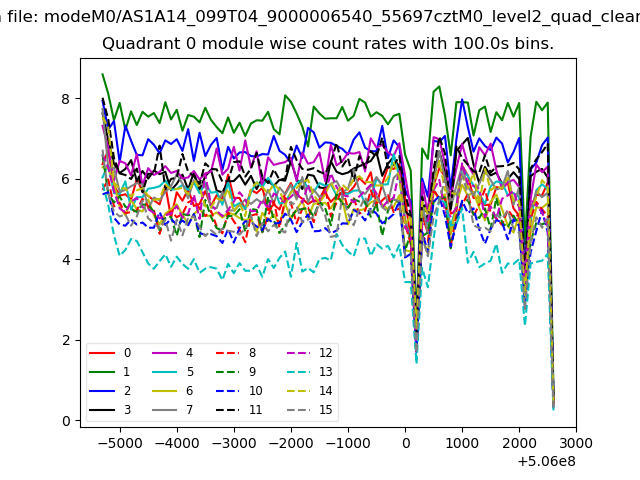
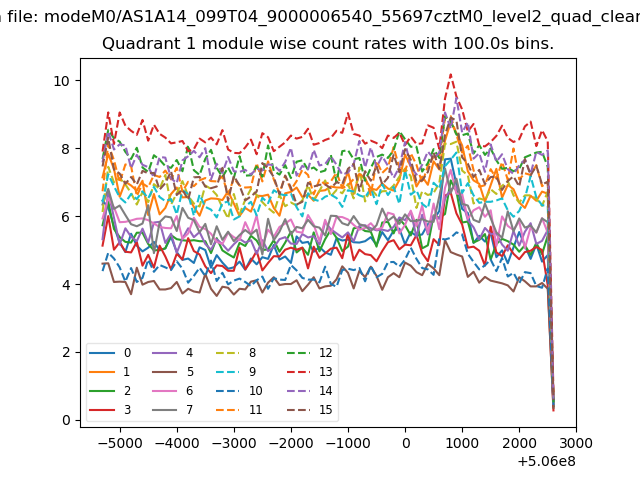
| Module-wise count rates for Quadrant A Data is divided into 100 sec bins |
 |
 |
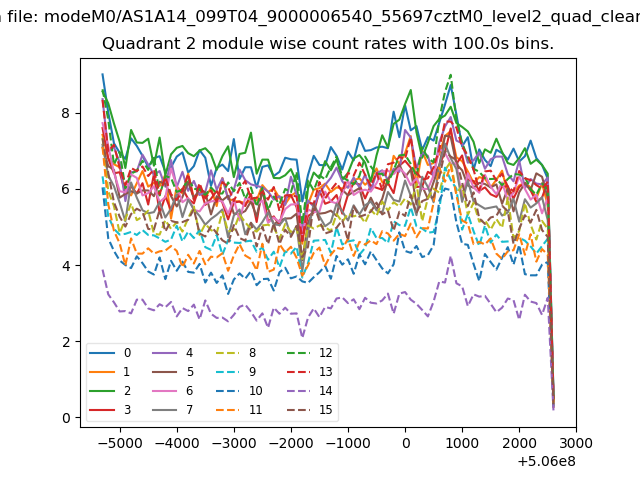
| Module-wise count rates for Quadrant B Data is divided into 100 sec bins |
 |
 |
| Module-wise count rates for Quadrant C Data is divided into 100 sec bins |
 |
 |
| Module-wise count rates for Quadrant D Data is divided into 100 sec bins |
 |
 |
| Parameter | Plot |
|---|---|
| CZT HV Monitor | 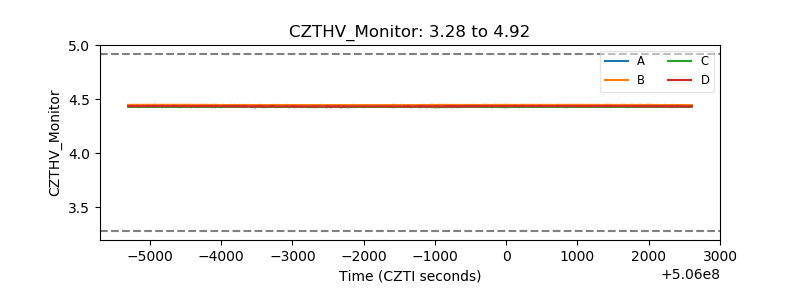 |
| D_VDD | 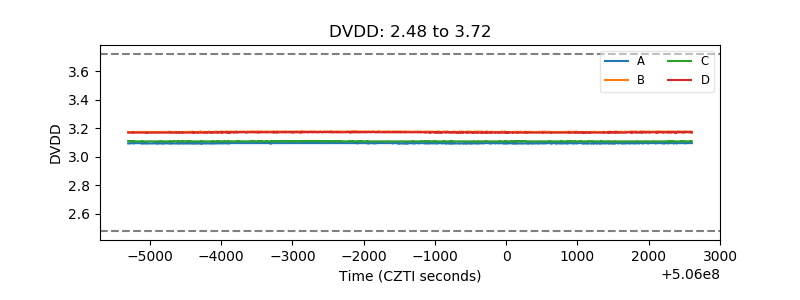 |
| Temperature 1 | 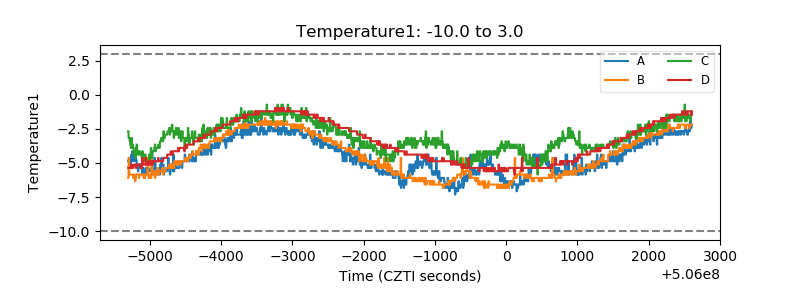 |
| Veto HV Monitor |  |
| Veto LLD | 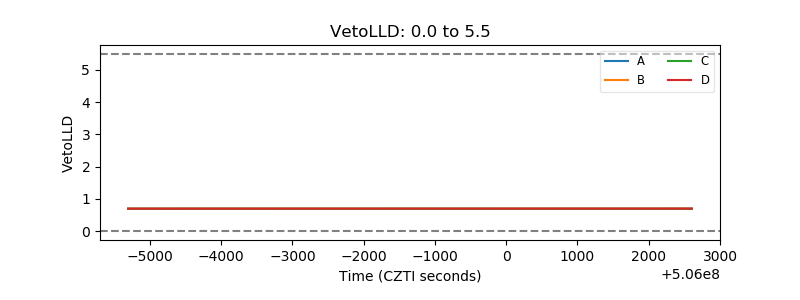 |
| Alpha Counter | 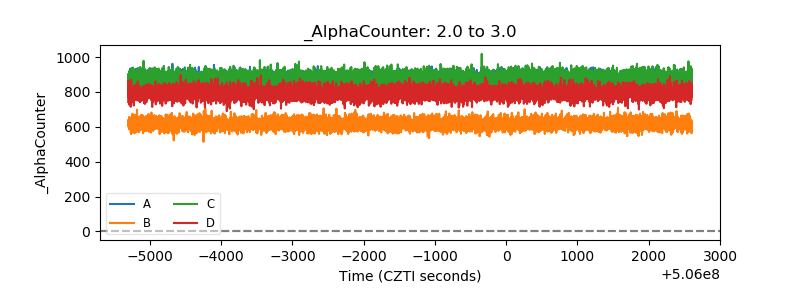 |
| _CPM_Rate | 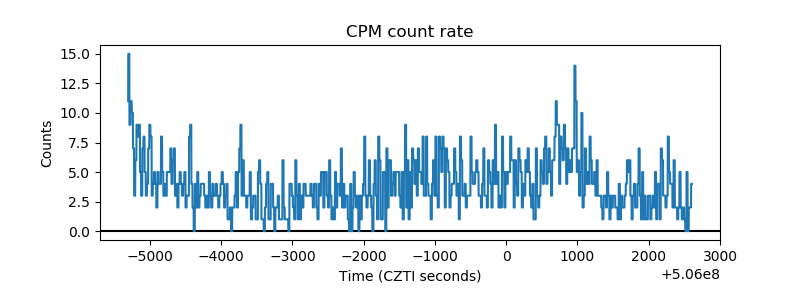 |
| CZT Counter | 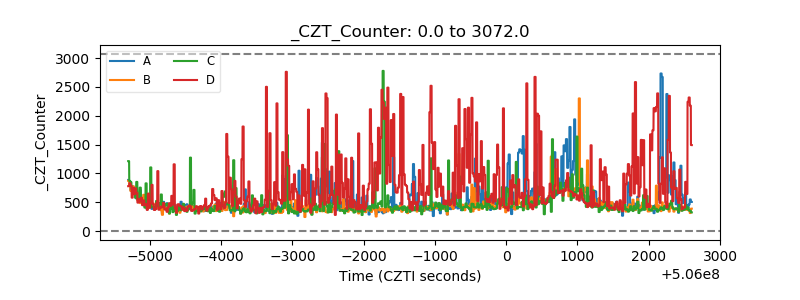 |
| +2.5 Volts monitor |  |
| +5 Volts monitor |  |
| _ROLL_ROT | 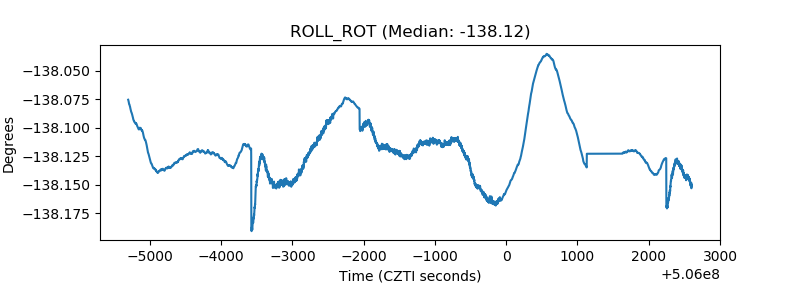 |
| _Roll_DEC | 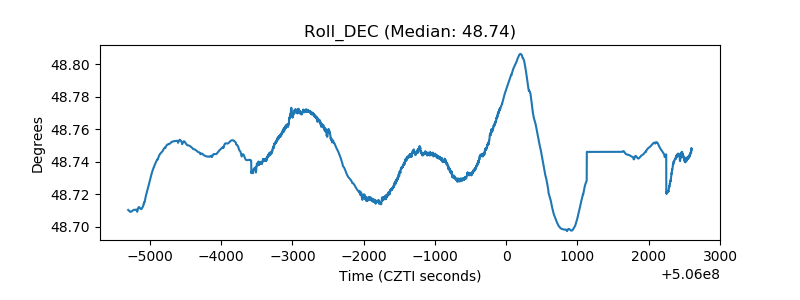 |
| _Roll_RA | 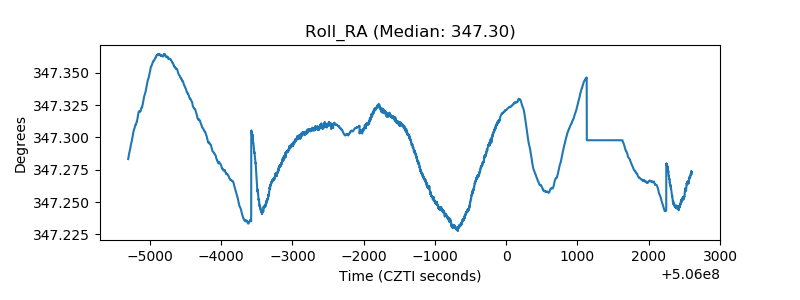 |
| Veto Counter | 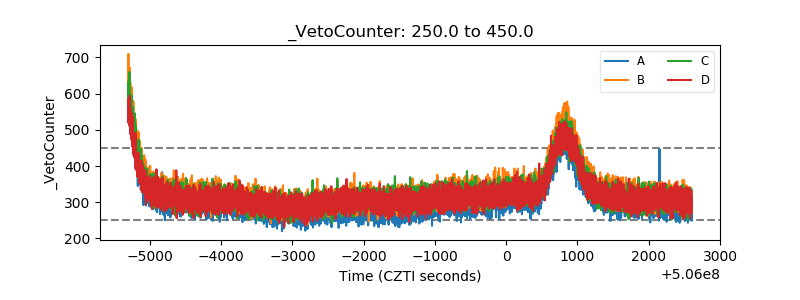 |