| Param | Original file | Final file |
|---|---|---|
| Filename | modeM0/AS1A14_099T04_9000006540_55698cztM0_level2.fits | modeM0/AS1A14_099T04_9000006540_55698cztM0_level2_quad_clean.evt |
| Size (bytes) | 488,975,040 | 101,079,360 |
| Size | 466.3 MB | 96.4 MB |
| Events in quadrant A | 4,943,275 | 636,006 |
| Events in quadrant B | 3,007,392 | 714,829 |
| Events in quadrant C | 3,416,985 | 637,028 |
| Events in quadrant D | 6,169,547 | 568,053 |
| Mode M0 | |||
|---|---|---|---|
| Quadrant | BADHDUFLAG | Total packets | Discarded packets |
| A | 0 | 19744 | 0 |
| B | 0 | 14728 | 0 |
| C | 0 | 15834 | 0 |
| D | 0 | 23407 | 0 |
| Mode SS | |||
|---|---|---|---|
| Quadrant | BADHDUFLAG | Total packets | Discarded packets |
| A | 0 | 146 | 0 |
| B | 0 | 146 | 0 |
| C | 0 | 146 | 0 |
| D | 0 | 146 | 0 |
| Quadrant | Total seconds | Saturated seconds | Saturation percentage |
|---|---|---|---|
| A | 7245 | 380 | 5.244997% |
| B | 7245 | 14 | 0.193237% |
| C | 7245 | 64 | 0.883368% |
| D | 7245 | 590 | 8.143547% |
Noise dominated data is calculated using 1-second bins in cleaned event files. If a bin has >2000 counts, and if more than 50% of those come from <1% of pixels, then it is considered to be noise-dominated and hence unusable.
| Quadrant | # 1 sec bins | Bins with >0 counts | Bins with >2000 counts | High rate bins dominated by noise | Noise dominated (total time) | Noise dominated (detector-on time) | Marked lightcurve |
|---|---|---|---|---|---|---|---|
| A | 7245 | 7245 | 340 | 340 | 4.69% | 4.69% | 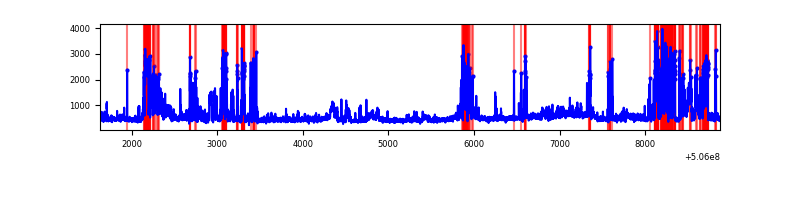 |
| B | 7245 | 7245 | 5 | 5 | 0.07% | 0.07% | 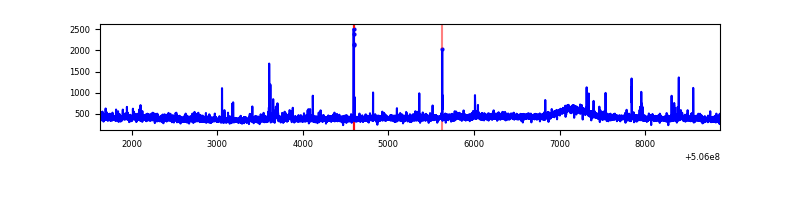 |
| C | 7245 | 7245 | 61 | 61 | 0.84% | 0.84% | 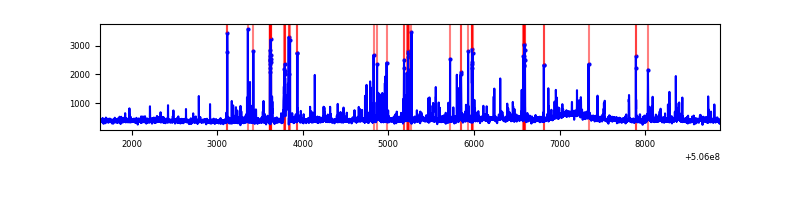 |
| D | 7244 | 7244 | 584 | 584 | 8.06% | 8.06% | 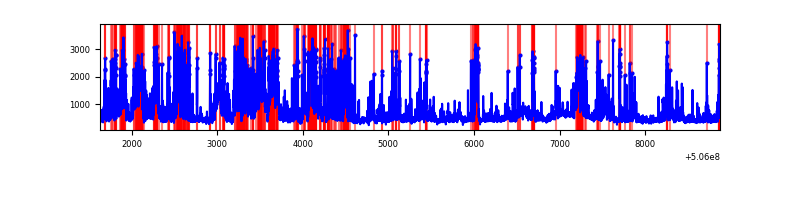 |
Top three noisy pixels from each quadrant. If the there are fewer than three noisy pixels in the level2.evt file, extra rows are filled as -1
| Pixel properties | Quadrant properties | ||||||
|---|---|---|---|---|---|---|---|
| Quadrant | DetID | PixID | Counts | Sigma | Mean | Median | Sigma |
| A | 15 | 32 | 905028 | 4984.52 | 731 | 712 | 181.4 |
| A | 7 | 64 | 633620 | 3488.54 | 731 | 712 | 181.4 |
| A | 8 | 206 | 306081 | 1683.17 | 731 | 712 | 181.4 |
| B | 12 | 111 | 19675 | 118.08 | 735 | 707 | 160.6 |
| B | 4 | 206 | 18791 | 112.57 | 735 | 707 | 160.6 |
| B | 11 | 111 | 18270 | 109.33 | 735 | 707 | 160.6 |
| C | 13 | 3 | 155771 | 784.66 | 721 | 714 | 197.6 |
| C | 10 | 19 | 111542 | 560.84 | 721 | 714 | 197.6 |
| C | 15 | 147 | 68169 | 341.35 | 721 | 714 | 197.6 |
| D | 11 | 129 | 3038801 | 15055.77 | 705 | 673 | 201.8 |
| D | 7 | 129 | 136199 | 671.61 | 705 | 673 | 201.8 |
| D | 8 | 245 | 93667 | 460.84 | 705 | 673 | 201.8 |
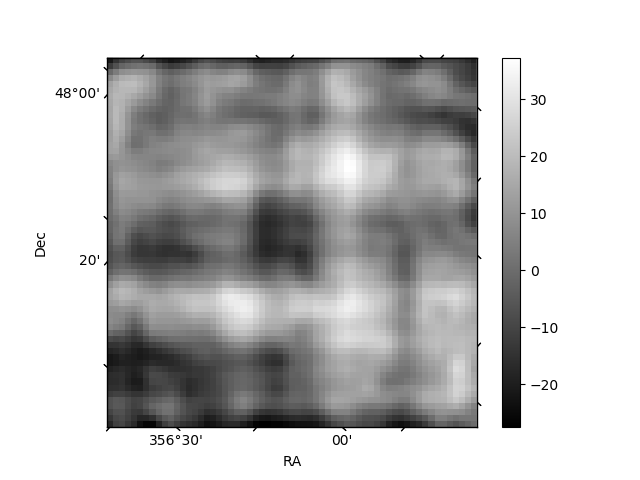
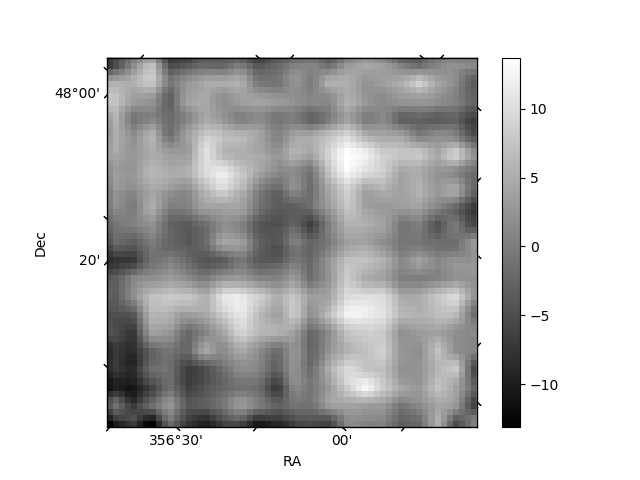
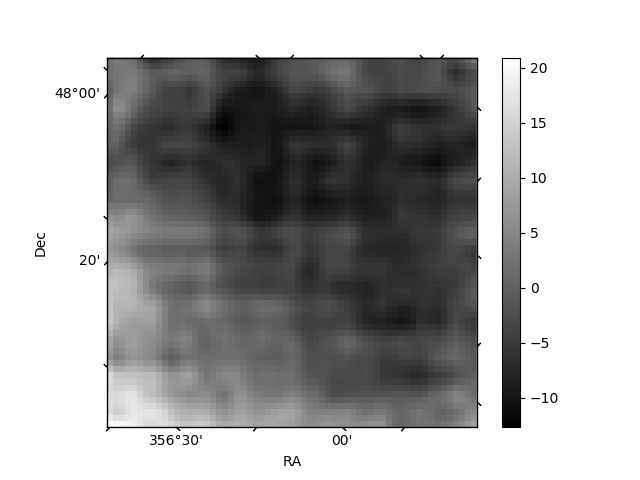
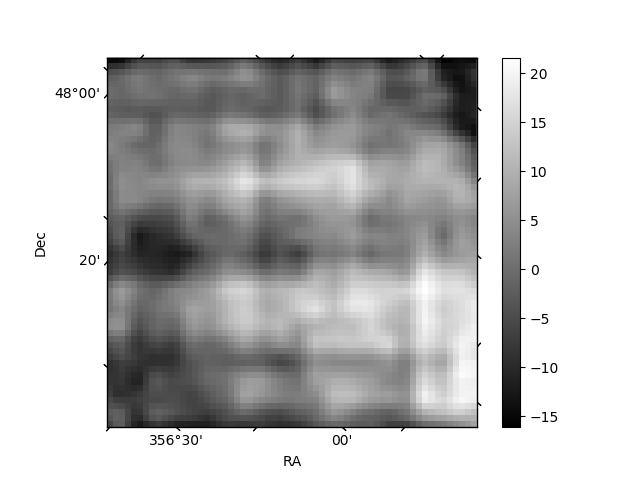
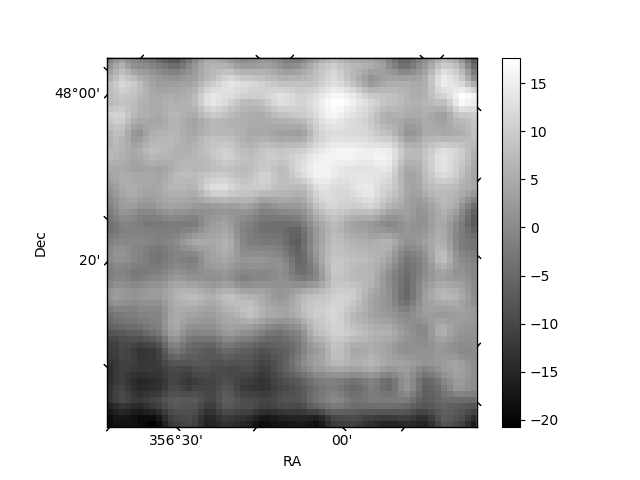
Histogram calculated using DETX and DETY for each event in the final _common_clean file
| Quadrant A | 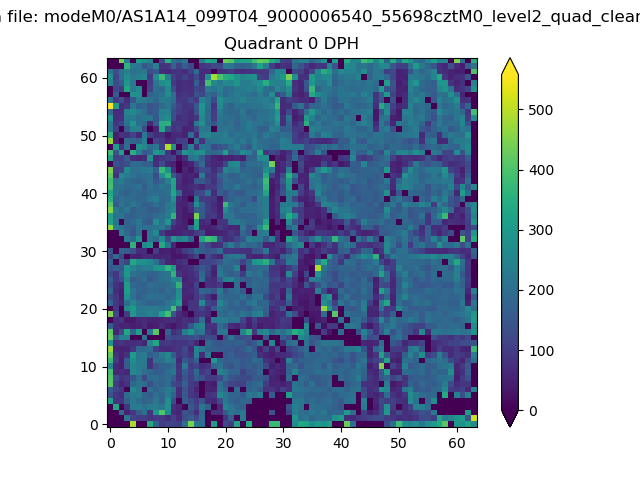 |
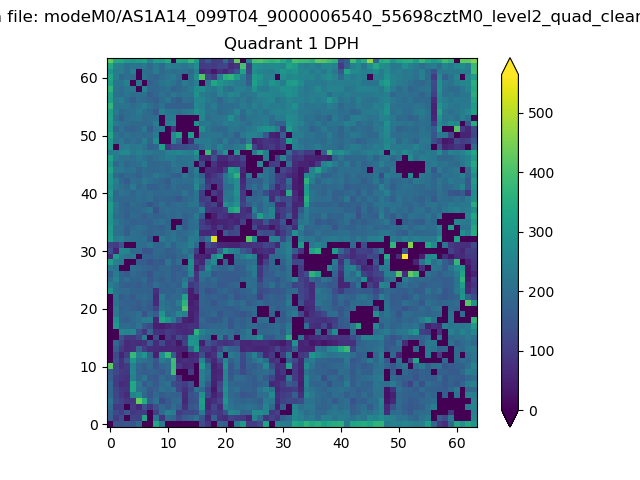 |
Quadrant B |
|---|---|---|---|
| Quadrant D | 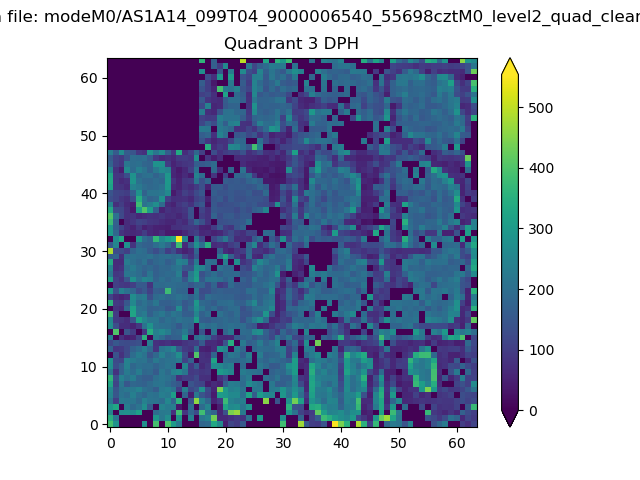 |
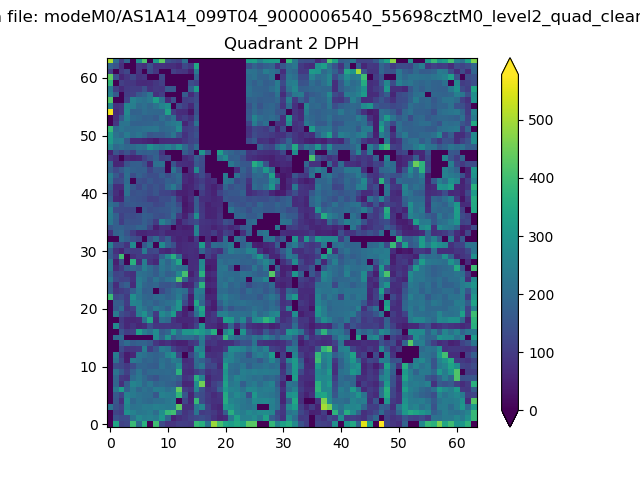 |
Quadrant C |
| Plot type | Count rate plots | Images |
|---|---|---|
| Comparison with Poisson distribution Blue bars denote a histogram of data divided into 1 sec bins. Red curve is a Poisson curve with rate = median count rate of data. |
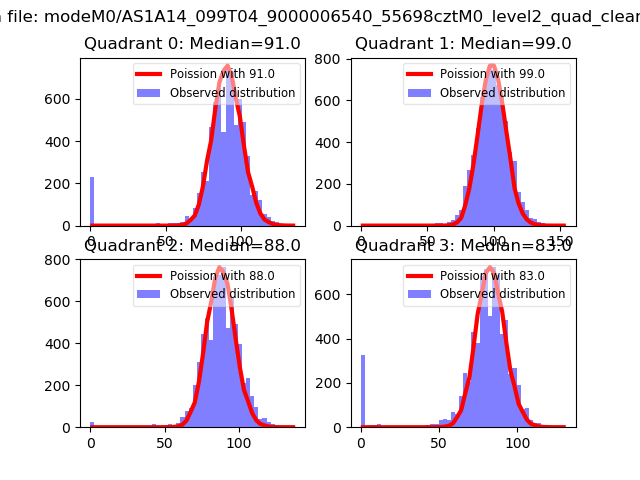 |
 |
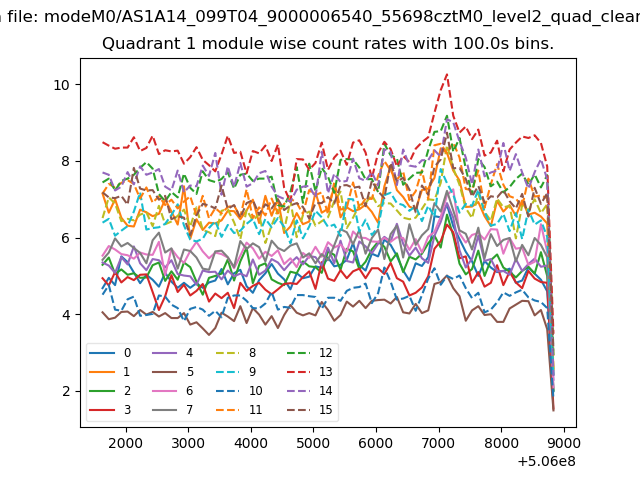
| Quadrant-wise count rates Data is divided into 100 sec bins |
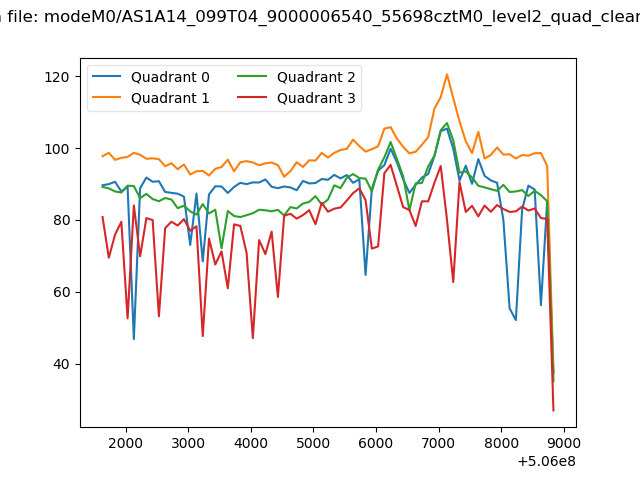 |
|
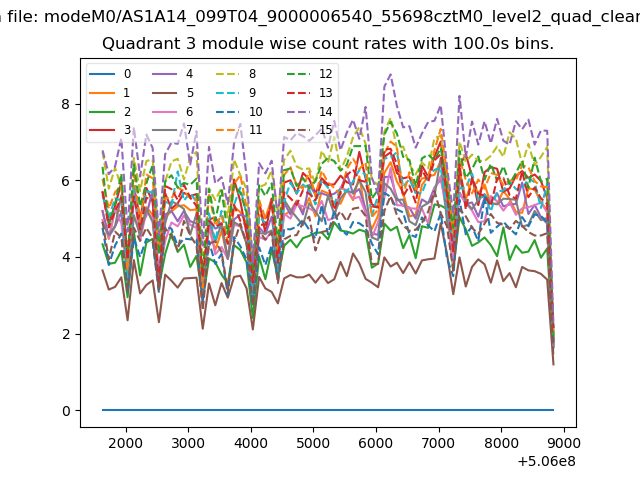
| Module-wise count rates for Quadrant A Data is divided into 100 sec bins |
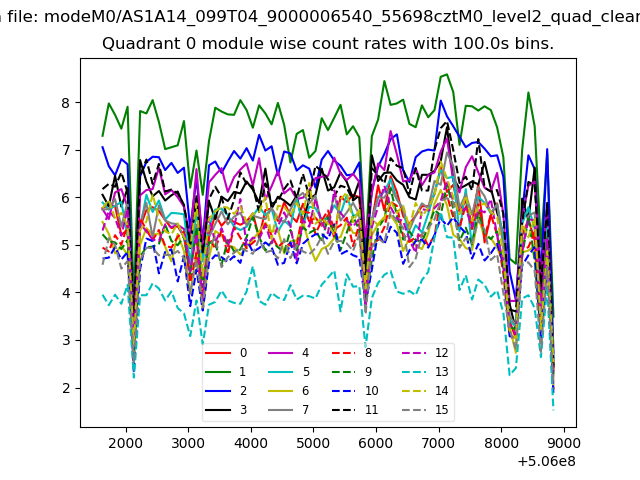 |
 |
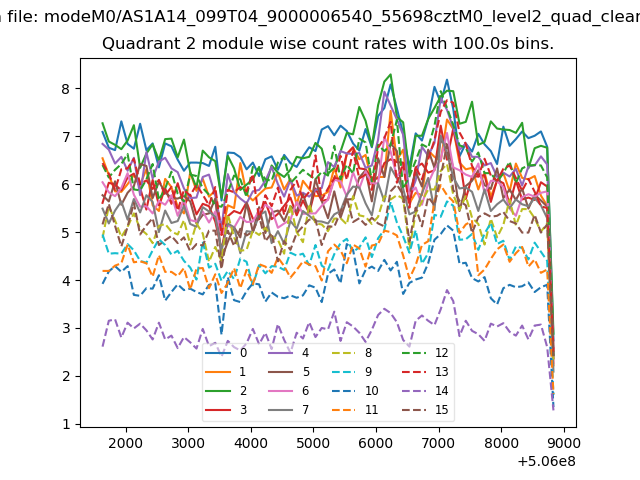
| Module-wise count rates for Quadrant B Data is divided into 100 sec bins |
 |
 |
| Module-wise count rates for Quadrant C Data is divided into 100 sec bins |
 |
 |
| Module-wise count rates for Quadrant D Data is divided into 100 sec bins |
 |
 |
| Parameter | Plot |
|---|---|
| CZT HV Monitor | 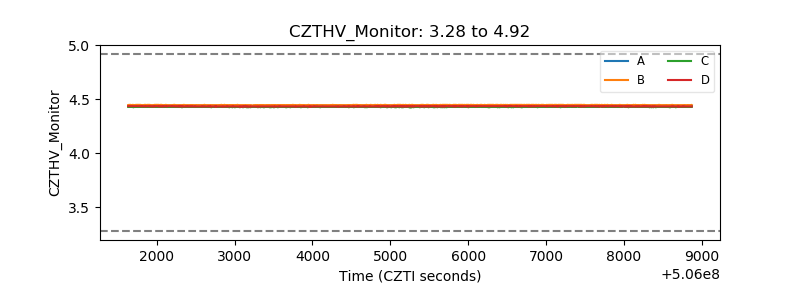 |
| D_VDD | 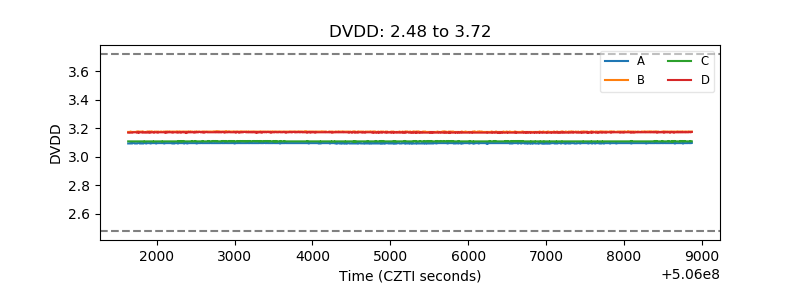 |
| Temperature 1 | 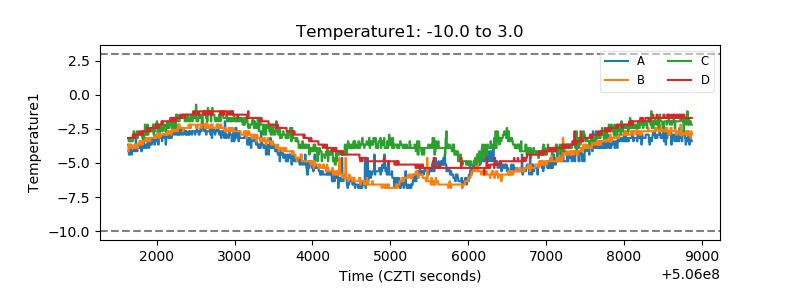 |
| Veto HV Monitor | 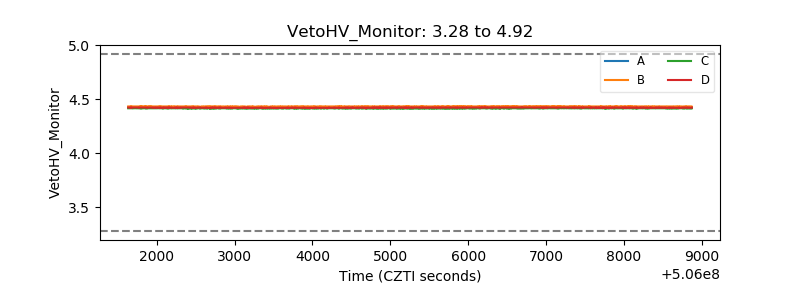 |
| Veto LLD | 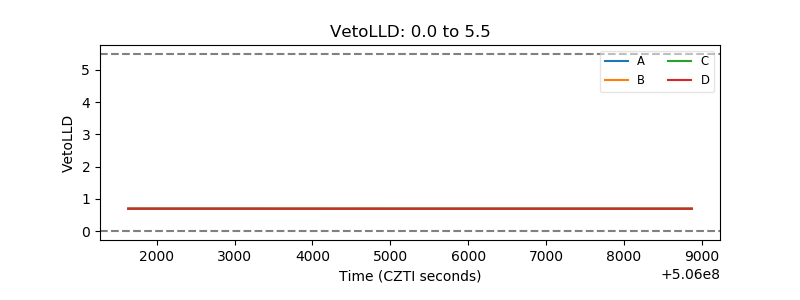 |
| Alpha Counter | 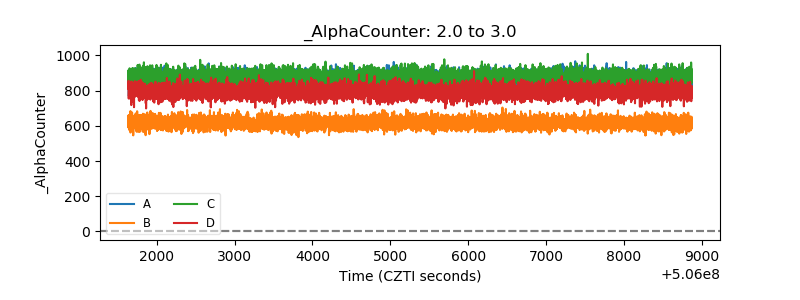 |
| _CPM_Rate | 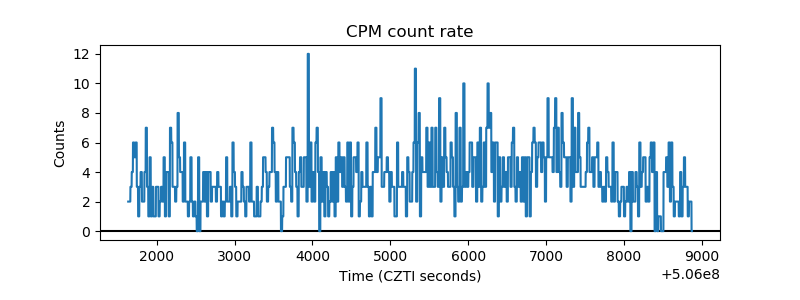 |
| CZT Counter | 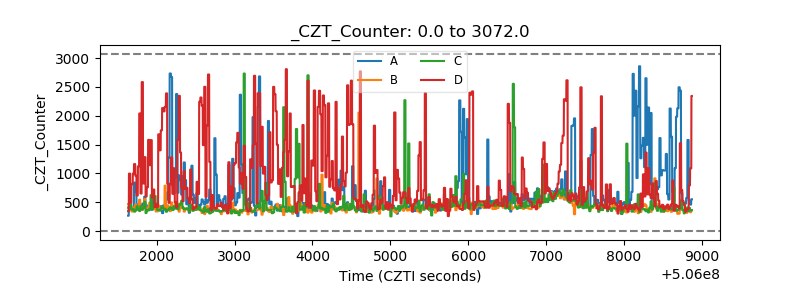 |
| +2.5 Volts monitor |  |
| +5 Volts monitor |  |
| _ROLL_ROT | 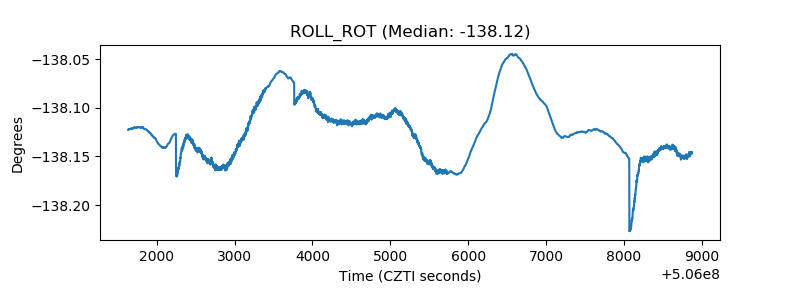 |
| _Roll_DEC | 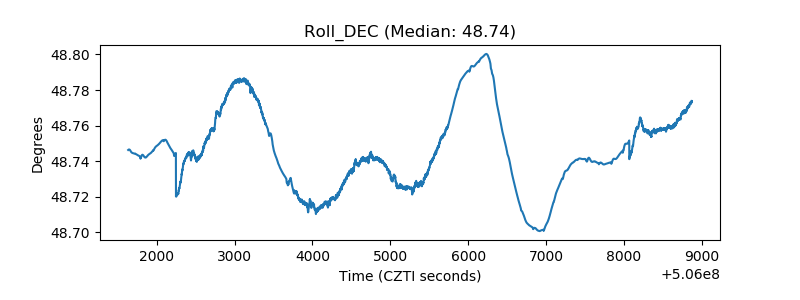 |
| _Roll_RA | 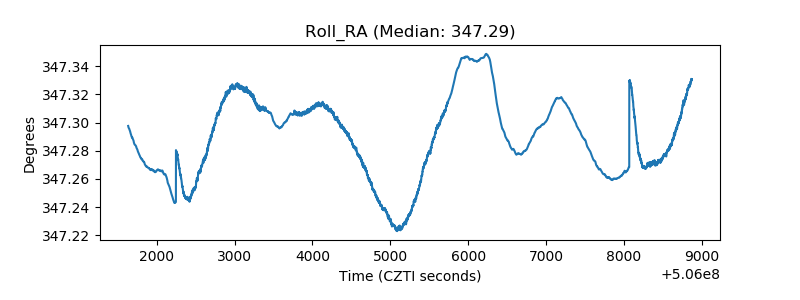 |
| Veto Counter | 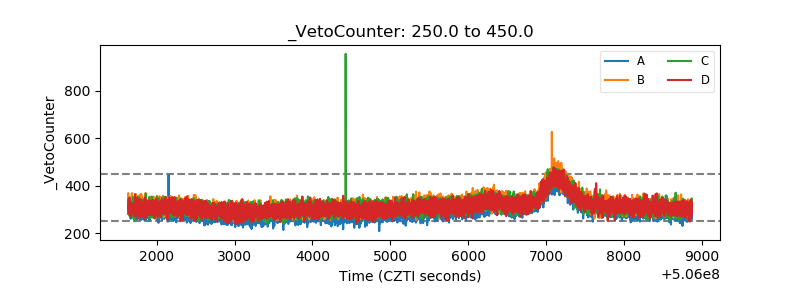 |