| Param | Original file | Final file |
|---|---|---|
| Filename | modeM0/AS1A14_099T04_9000006540_55699cztM0_level2.fits | modeM0/AS1A14_099T04_9000006540_55699cztM0_level2_quad_clean.evt |
| Size (bytes) | 560,482,560 | 102,885,120 |
| Size | 534.5 MB | 98.1 MB |
| Events in quadrant A | 7,651,033 | 600,080 |
| Events in quadrant B | 3,135,600 | 740,162 |
| Events in quadrant C | 4,127,997 | 650,535 |
| Events in quadrant D | 5,252,097 | 604,434 |
| Mode M0 | |||
|---|---|---|---|
| Quadrant | BADHDUFLAG | Total packets | Discarded packets |
| A | 0 | 27934 | 0 |
| B | 0 | 15452 | 0 |
| C | 0 | 17990 | 0 |
| D | 0 | 21000 | 4 |
| Mode SS | |||
|---|---|---|---|
| Quadrant | BADHDUFLAG | Total packets | Discarded packets |
| A | 0 | 148 | 0 |
| B | 0 | 148 | 0 |
| C | 0 | 148 | 0 |
| D | 0 | 148 | 0 |
| Quadrant | Total seconds | Saturated seconds | Saturation percentage |
|---|---|---|---|
| A | 7477 | 1117 | 14.939147% |
| B | 7477 | 35 | 0.468102% |
| C | 7478 | 222 | 2.968708% |
| D | 7477 | 366 | 4.895011% |
Noise dominated data is calculated using 1-second bins in cleaned event files. If a bin has >2000 counts, and if more than 50% of those come from <1% of pixels, then it is considered to be noise-dominated and hence unusable.
| Quadrant | # 1 sec bins | Bins with >0 counts | Bins with >2000 counts | High rate bins dominated by noise | Noise dominated (total time) | Noise dominated (detector-on time) | Marked lightcurve |
|---|---|---|---|---|---|---|---|
| A | 7477 | 7477 | 1048 | 1048 | 14.02% | 14.02% | 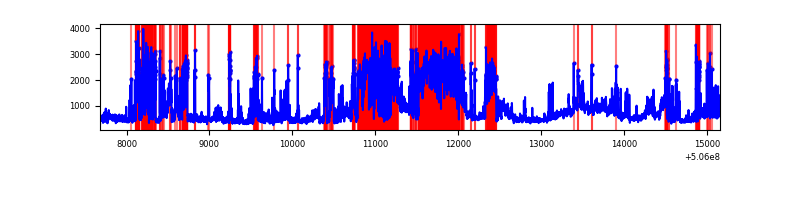 |
| B | 7477 | 7477 | 13 | 13 | 0.17% | 0.17% | 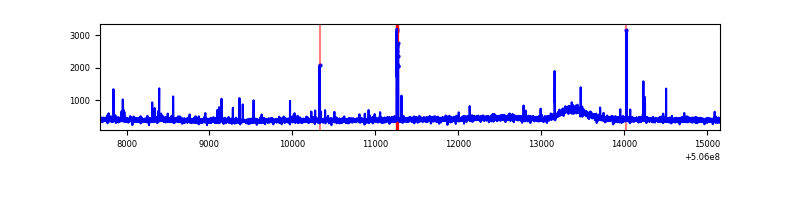 |
| C | 7478 | 7478 | 226 | 226 | 3.02% | 3.02% | 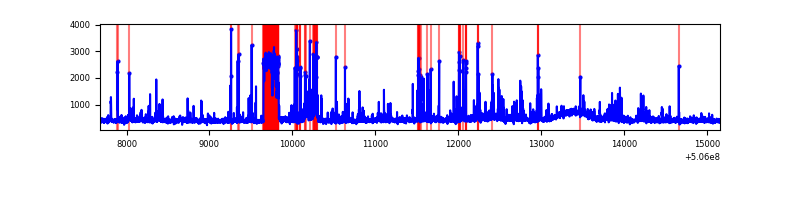 |
| D | 7477 | 7477 | 354 | 354 | 4.73% | 4.73% | 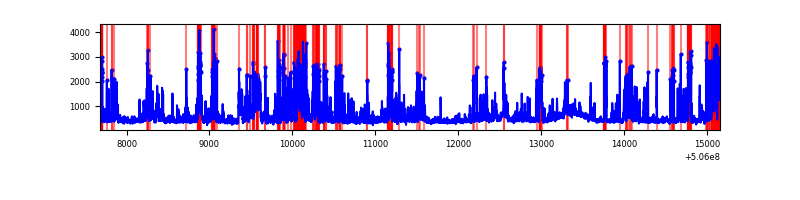 |
Top three noisy pixels from each quadrant. If the there are fewer than three noisy pixels in the level2.evt file, extra rows are filled as -1
| Pixel properties | Quadrant properties | ||||||
|---|---|---|---|---|---|---|---|
| Quadrant | DetID | PixID | Counts | Sigma | Mean | Median | Sigma |
| A | 15 | 32 | 3888855 | 21164.72 | 738 | 717 | 183.7 |
| A | 7 | 64 | 442306 | 2403.75 | 738 | 717 | 183.7 |
| A | 8 | 206 | 211320 | 1146.4 | 738 | 717 | 183.7 |
| B | 9 | 251 | 43168 | 254.98 | 767 | 740 | 166.4 |
| B | 10 | 247 | 20664 | 119.74 | 767 | 740 | 166.4 |
| B | 12 | 111 | 20660 | 119.71 | 767 | 740 | 166.4 |
| C | 10 | 19 | 475572 | 2310.1 | 750 | 743 | 205.5 |
| C | 13 | 3 | 185624 | 899.47 | 750 | 743 | 205.5 |
| C | 12 | 252 | 130324 | 630.43 | 750 | 743 | 205.5 |
| D | 11 | 129 | 1976628 | 9402.56 | 747 | 715 | 210.1 |
| D | 2 | 120 | 188955 | 895.76 | 747 | 715 | 210.1 |
| D | 7 | 129 | 82249 | 387.99 | 747 | 715 | 210.1 |
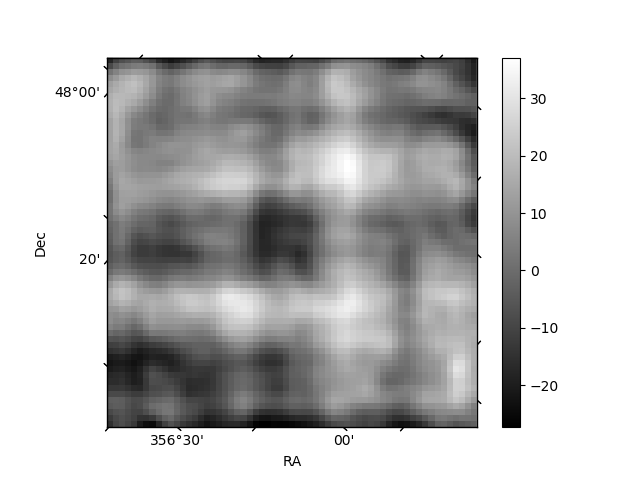
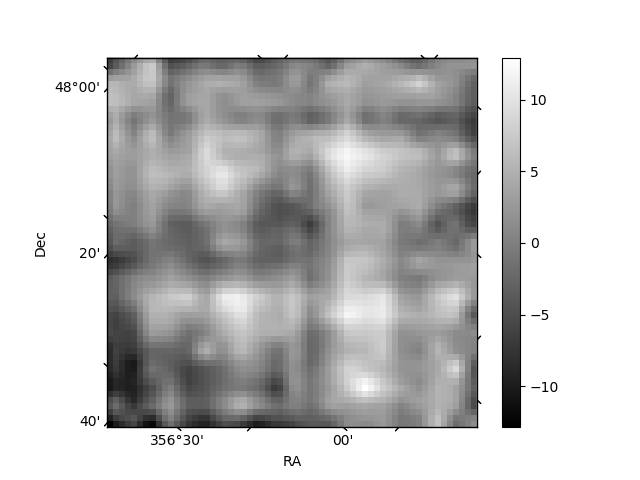
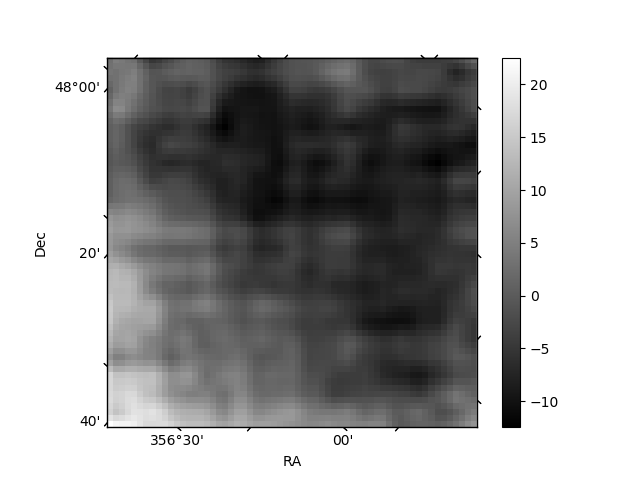
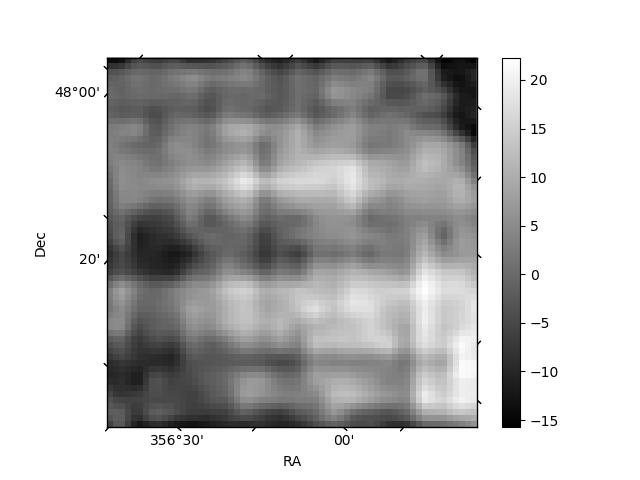
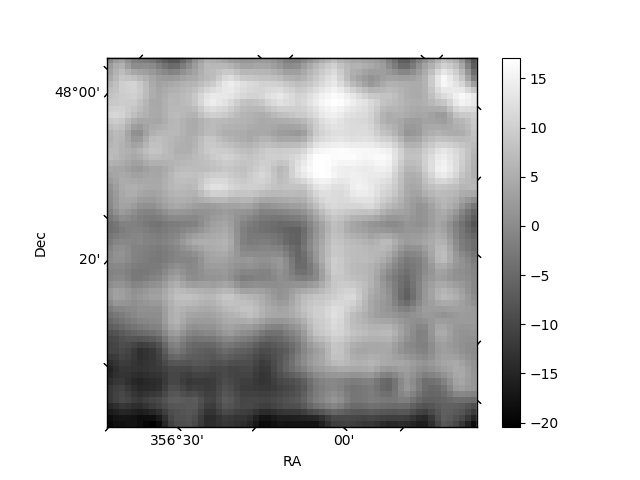
Histogram calculated using DETX and DETY for each event in the final _common_clean file
| Quadrant A | 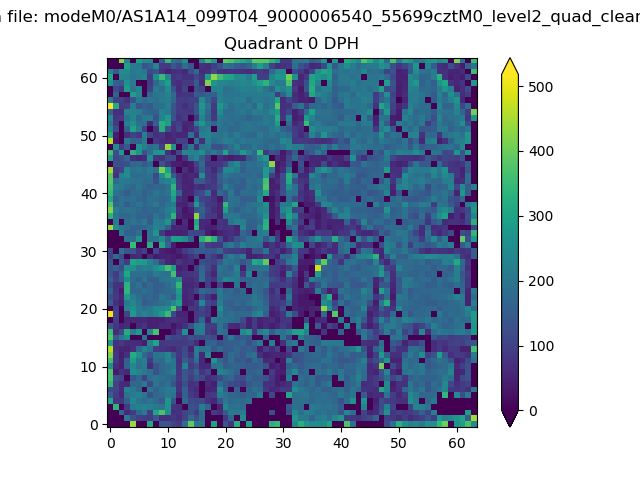 |
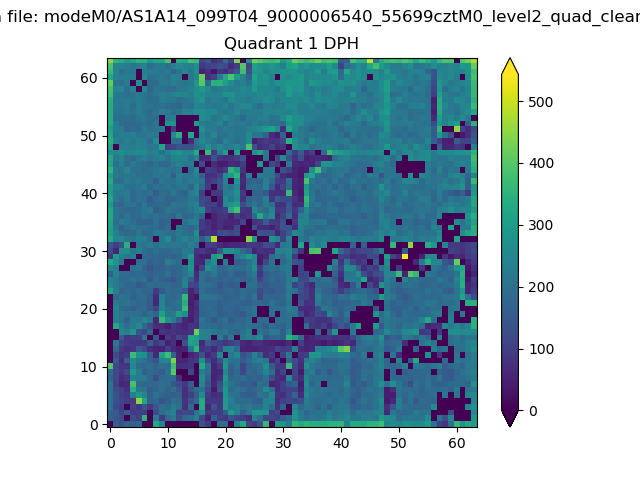 |
Quadrant B |
|---|---|---|---|
| Quadrant D | 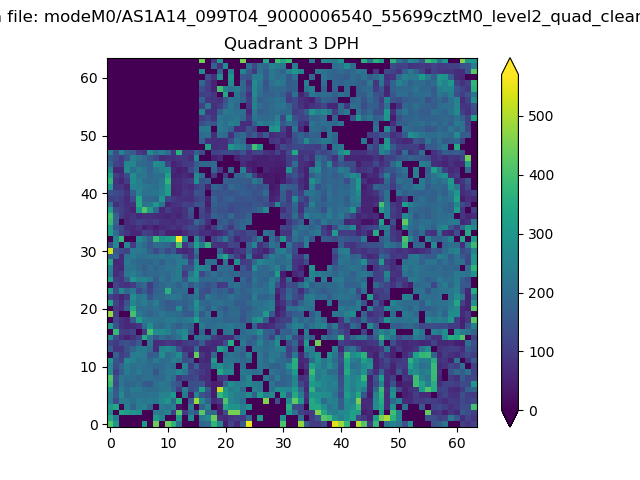 |
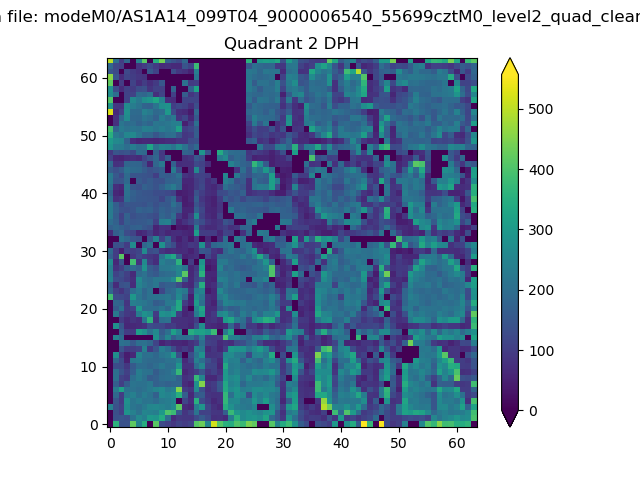 |
Quadrant C |
| Plot type | Count rate plots | Images |
|---|---|---|
| Comparison with Poisson distribution Blue bars denote a histogram of data divided into 1 sec bins. Red curve is a Poisson curve with rate = median count rate of data. |
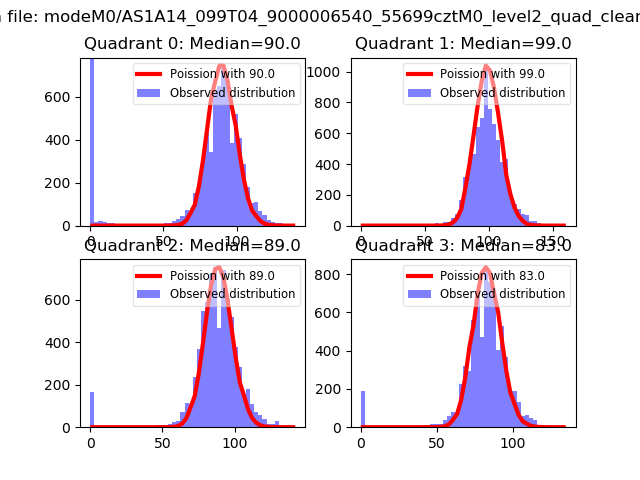 |
 |
| Quadrant-wise count rates Data is divided into 100 sec bins |
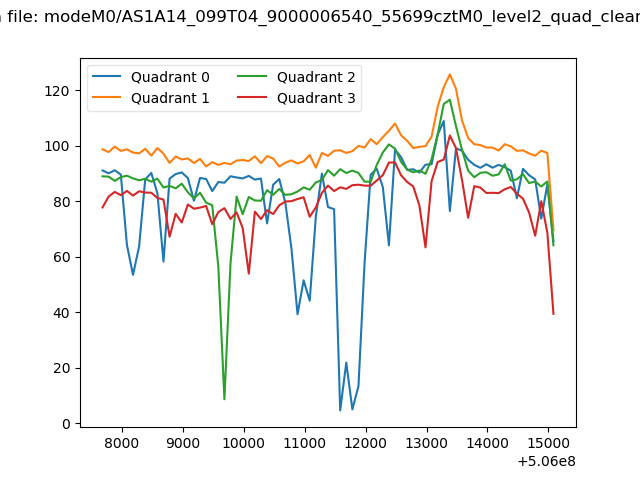 |
|
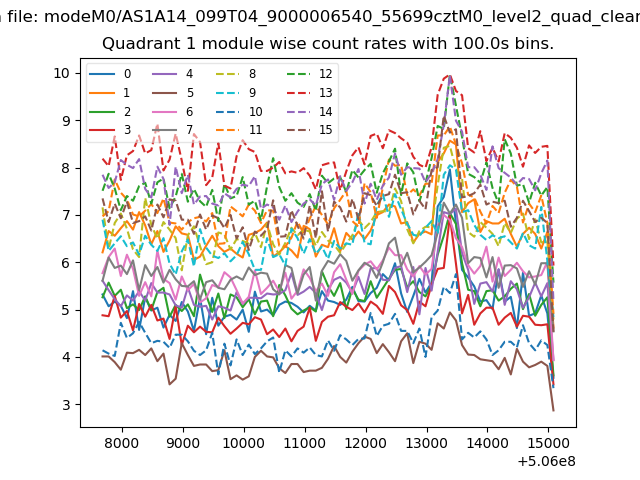
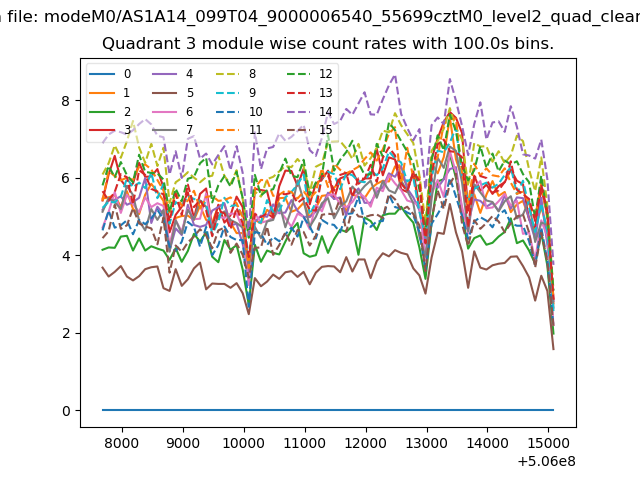
| Module-wise count rates for Quadrant A Data is divided into 100 sec bins |
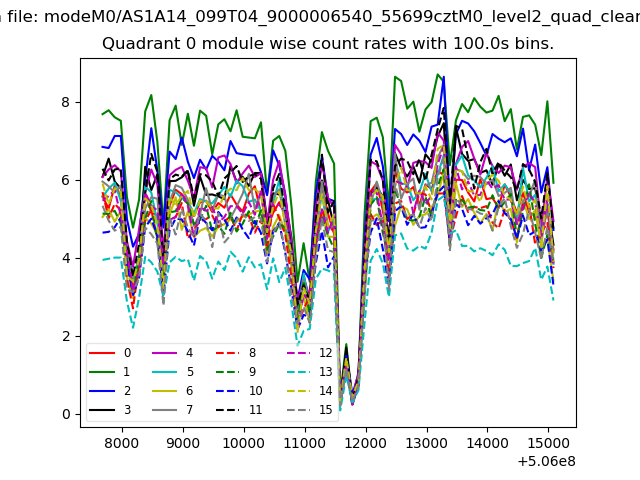 |
 |
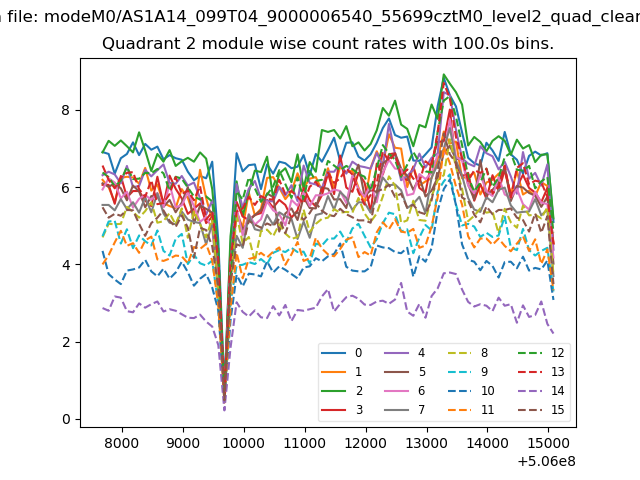
| Module-wise count rates for Quadrant B Data is divided into 100 sec bins |
 |
 |
| Module-wise count rates for Quadrant C Data is divided into 100 sec bins |
 |
 |
| Module-wise count rates for Quadrant D Data is divided into 100 sec bins |
 |
 |
| Parameter | Plot |
|---|---|
| CZT HV Monitor |  |
| D_VDD | 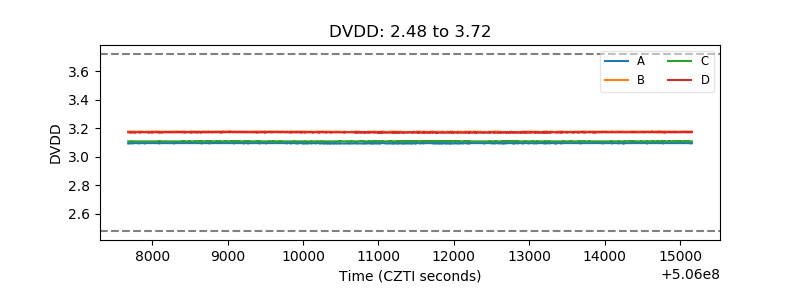 |
| Temperature 1 | 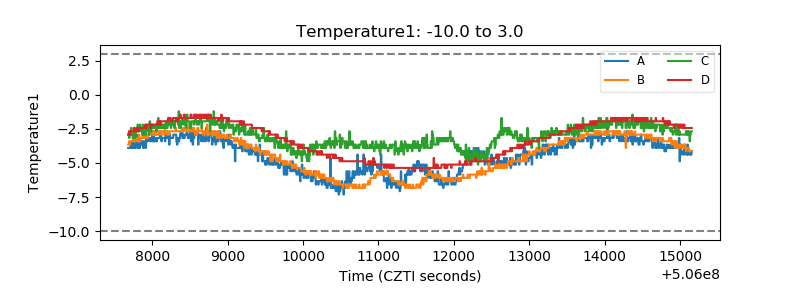 |
| Veto HV Monitor | 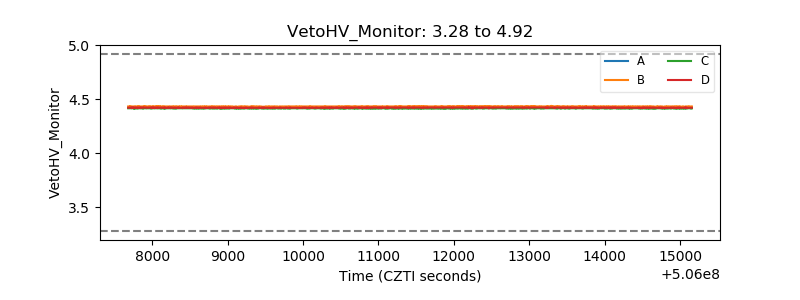 |
| Veto LLD | 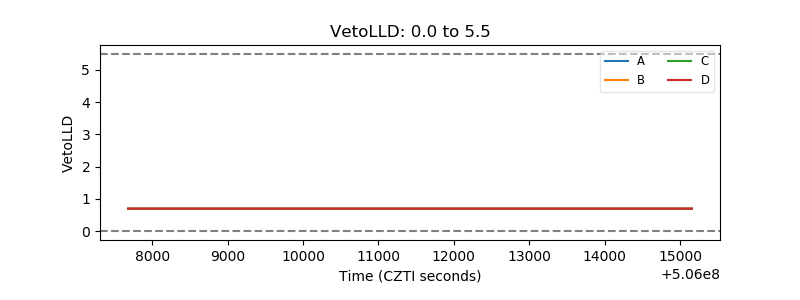 |
| Alpha Counter | 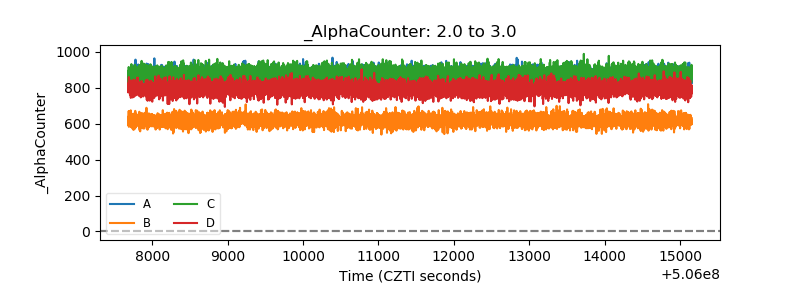 |
| _CPM_Rate | 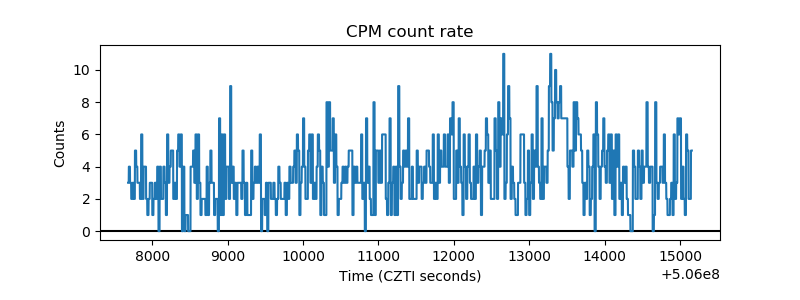 |
| CZT Counter | 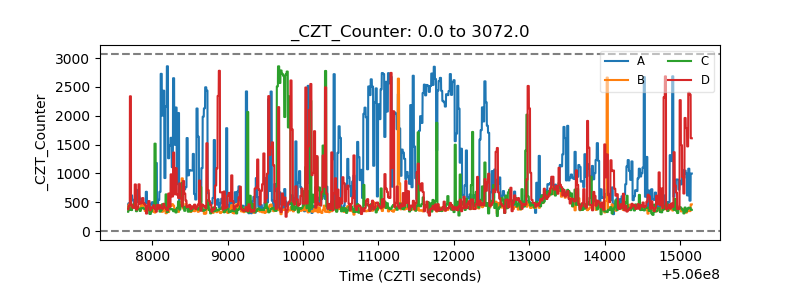 |
| +2.5 Volts monitor |  |
| +5 Volts monitor |  |
| _ROLL_ROT | 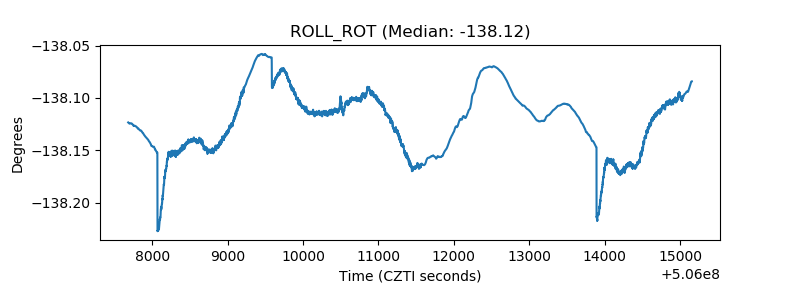 |
| _Roll_DEC | 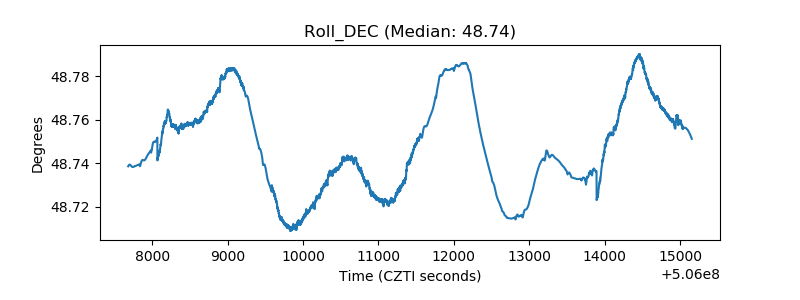 |
| _Roll_RA | 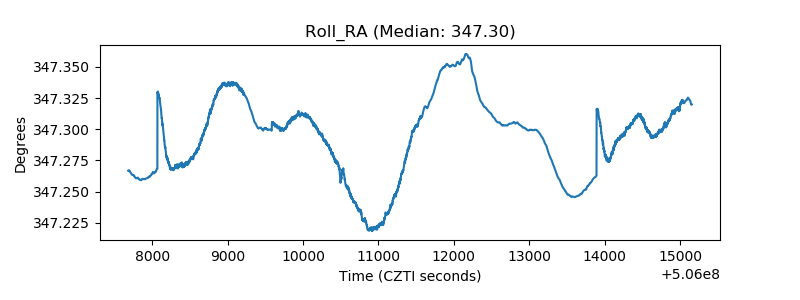 |
| Veto Counter | 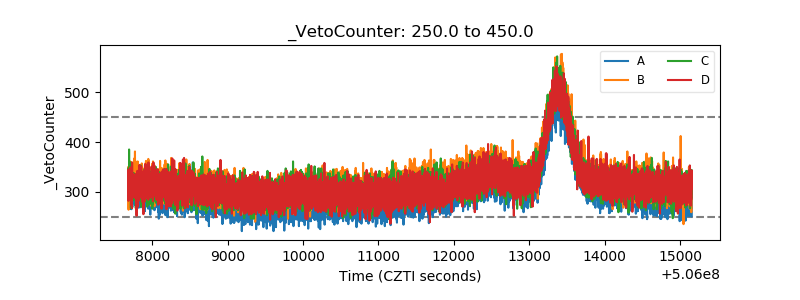 |