| Param | Original file | Final file |
|---|---|---|
| Filename | modeM0/AS1A14_099T04_9000006540_55702cztM0_level2.fits | modeM0/AS1A14_099T04_9000006540_55702cztM0_level2_quad_clean.evt |
| Size (bytes) | 1,328,500,800 | 252,267,840 |
| Size | 1.2 GB | 240.6 MB |
| Events in quadrant A | 19,961,235 | 1,431,776 |
| Events in quadrant B | 7,731,477 | 1,809,750 |
| Events in quadrant C | 8,613,615 | 1,623,032 |
| Events in quadrant D | 11,426,072 | 1,487,747 |
| Mode M0 | |||
|---|---|---|---|
| Quadrant | BADHDUFLAG | Total packets | Discarded packets |
| A | 0 | 72388 | 3 |
| B | 0 | 37920 | 3 |
| C | 0 | 40252 | 3 |
| D | 0 | 47651 | 3 |
| Mode M9 | |||
|---|---|---|---|
| Quadrant | BADHDUFLAG | Total packets | Discarded packets |
| A | 0 | 18 | 0 |
| B | 0 | 18 | 0 |
| C | 0 | 18 | 0 |
| D | 0 | 18 | 0 |
| Mode SS | |||
|---|---|---|---|
| Quadrant | BADHDUFLAG | Total packets | Discarded packets |
| A | 0 | 376 | 0 |
| B | 0 | 376 | 0 |
| C | 0 | 376 | 0 |
| D | 0 | 376 | 0 |
| Quadrant | Total seconds | Saturated seconds | Saturation percentage |
|---|---|---|---|
| A | 18662 | 3038 | 16.279070% |
| B | 18662 | 70 | 0.375094% |
| C | 18663 | 197 | 1.055564% |
| D | 18663 | 607 | 3.252425% |
Noise dominated data is calculated using 1-second bins in cleaned event files. If a bin has >2000 counts, and if more than 50% of those come from <1% of pixels, then it is considered to be noise-dominated and hence unusable.
| Quadrant | # 1 sec bins | Bins with >0 counts | Bins with >2000 counts | High rate bins dominated by noise | Noise dominated (total time) | Noise dominated (detector-on time) | Marked lightcurve |
|---|---|---|---|---|---|---|---|
| A | 20347 | 18663 | 2945 | 2945 | 14.47% | 15.78% | 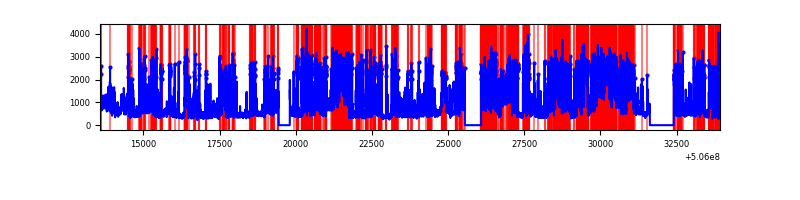 |
| B | 20347 | 18664 | 7 | 7 | 0.03% | 0.04% | 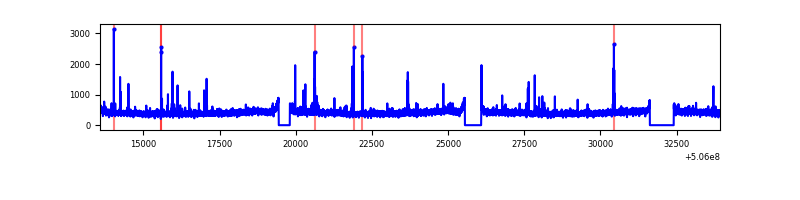 |
| C | 20348 | 18666 | 150 | 150 | 0.74% | 0.80% | 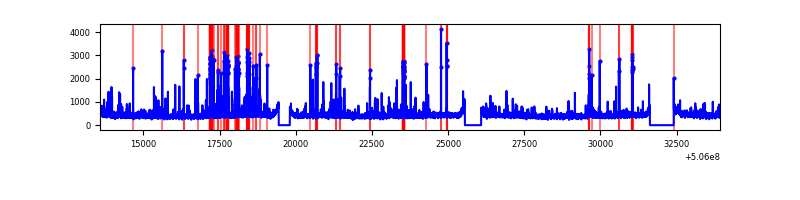 |
| D | 20348 | 18666 | 584 | 584 | 2.87% | 3.13% | 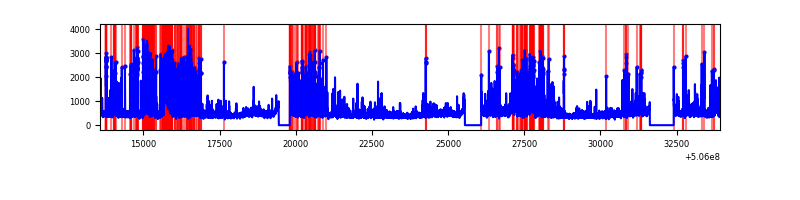 |
Top three noisy pixels from each quadrant. If the there are fewer than three noisy pixels in the level2.evt file, extra rows are filled as -1
| Pixel properties | Quadrant properties | ||||||
|---|---|---|---|---|---|---|---|
| Quadrant | DetID | PixID | Counts | Sigma | Mean | Median | Sigma |
| A | 15 | 32 | 9056156 | 20359.7 | 1802 | 1755 | 444.7 |
| A | 7 | 64 | 2834167 | 6368.95 | 1802 | 1755 | 444.7 |
| A | 0 | 8 | 623289 | 1397.58 | 1802 | 1755 | 444.7 |
| B | 12 | 111 | 50805 | 120.35 | 1903 | 1830 | 406.9 |
| B | 11 | 111 | 47359 | 111.88 | 1903 | 1830 | 406.9 |
| B | 14 | 111 | 46343 | 109.39 | 1903 | 1830 | 406.9 |
| C | 13 | 3 | 294568 | 564.22 | 1884 | 1866 | 518.8 |
| C | 12 | 250 | 151317 | 288.08 | 1884 | 1866 | 518.8 |
| C | 12 | 252 | 143255 | 272.54 | 1884 | 1866 | 518.8 |
| D | 11 | 129 | 3601197 | 6876.48 | 1858 | 1775 | 523.4 |
| D | 7 | 129 | 205267 | 388.76 | 1858 | 1775 | 523.4 |
| D | 5 | 173 | 166367 | 314.44 | 1858 | 1775 | 523.4 |
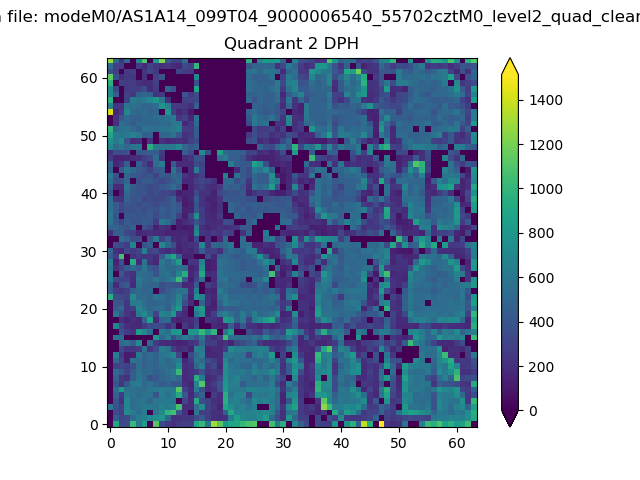
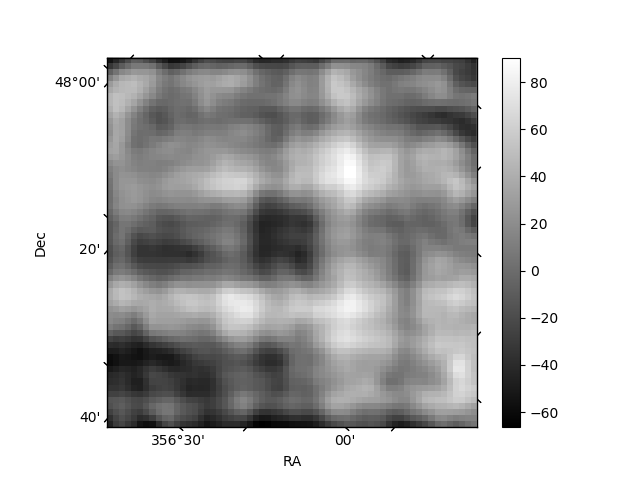
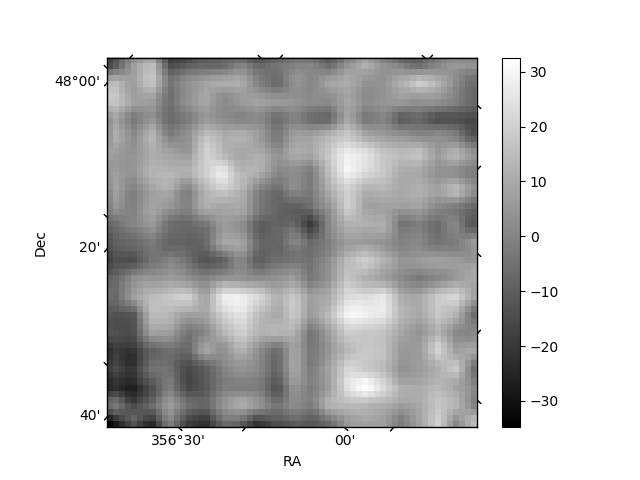
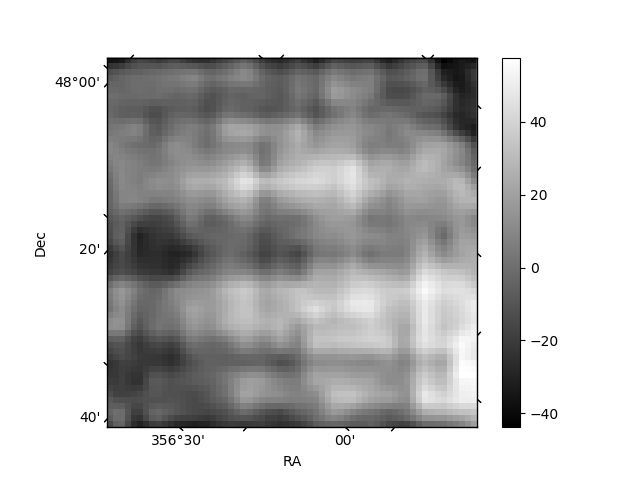
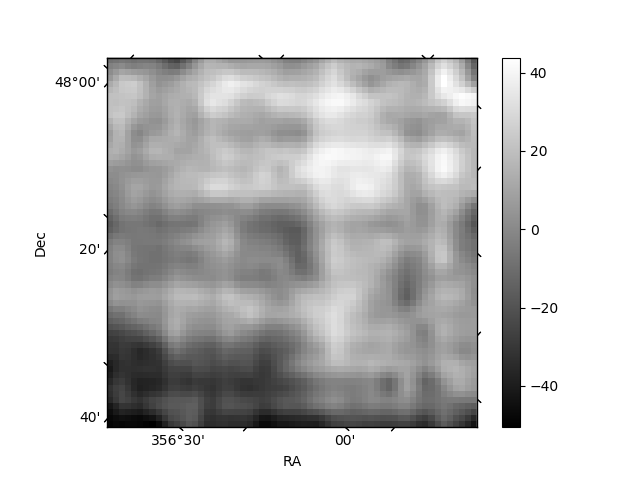
Histogram calculated using DETX and DETY for each event in the final _common_clean file
| Quadrant A | 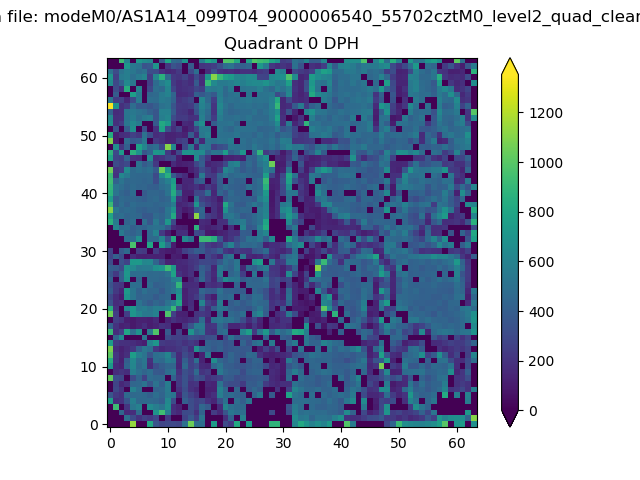 |
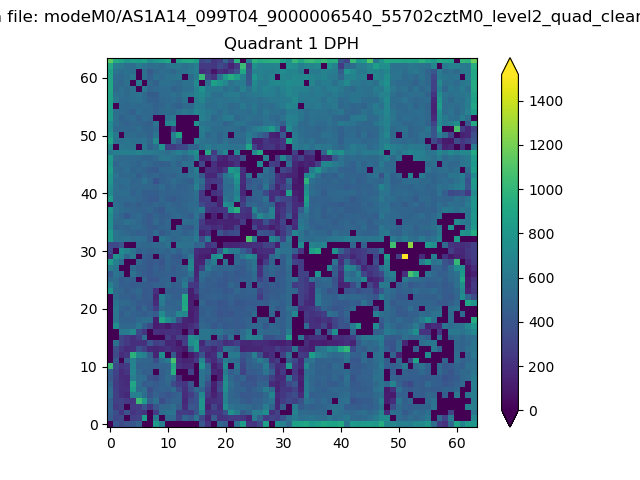 |
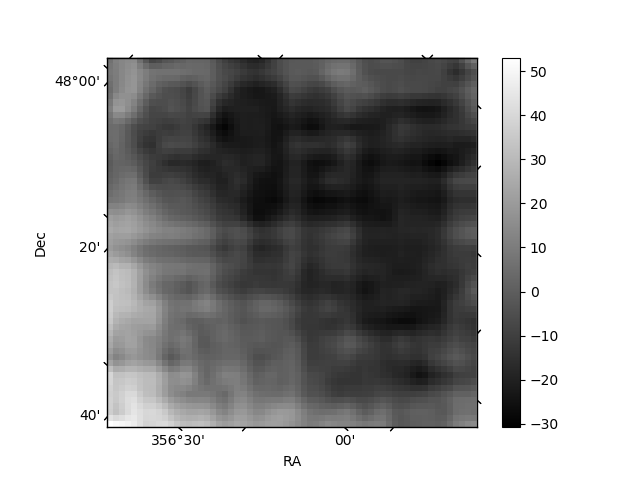
Quadrant B |
|---|---|---|---|
| Quadrant D | 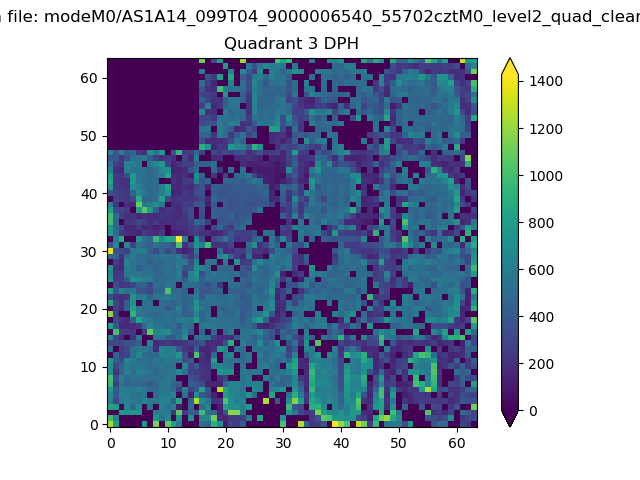 |
 |
Quadrant C |
| Plot type | Count rate plots | Images |
|---|---|---|
| Comparison with Poisson distribution Blue bars denote a histogram of data divided into 1 sec bins. Red curve is a Poisson curve with rate = median count rate of data. |
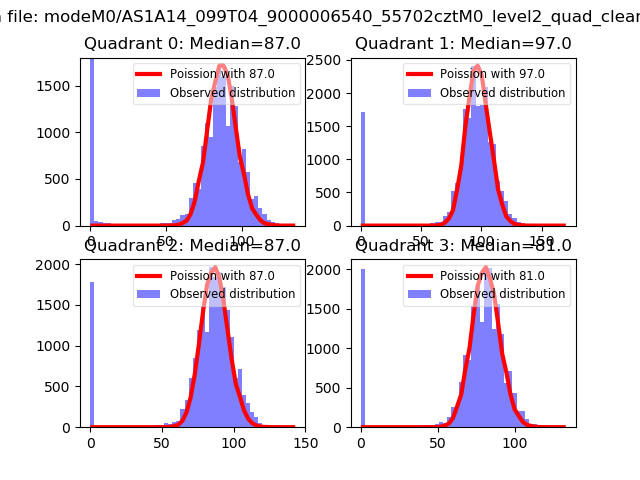 |
 |
| Quadrant-wise count rates Data is divided into 100 sec bins |
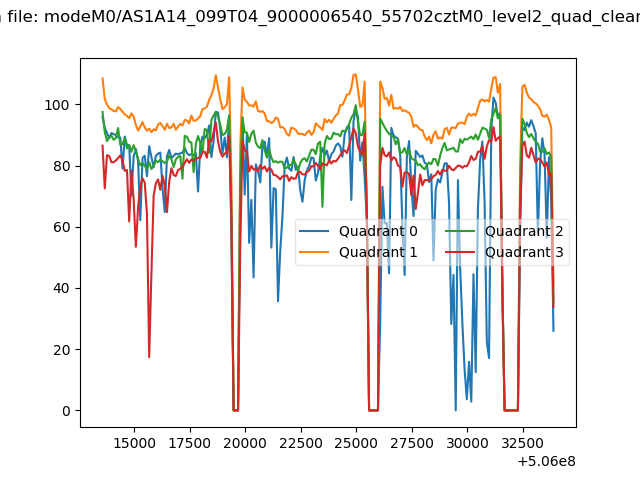 |
|
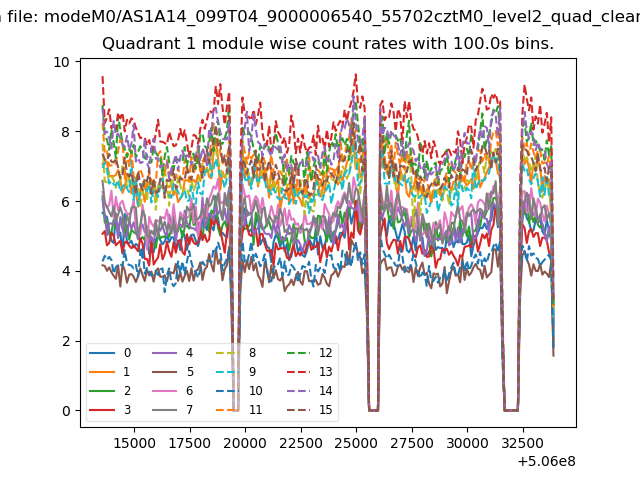
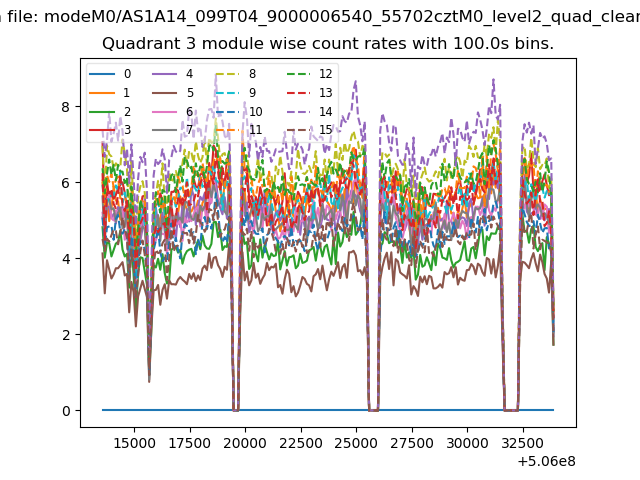
| Module-wise count rates for Quadrant A Data is divided into 100 sec bins |
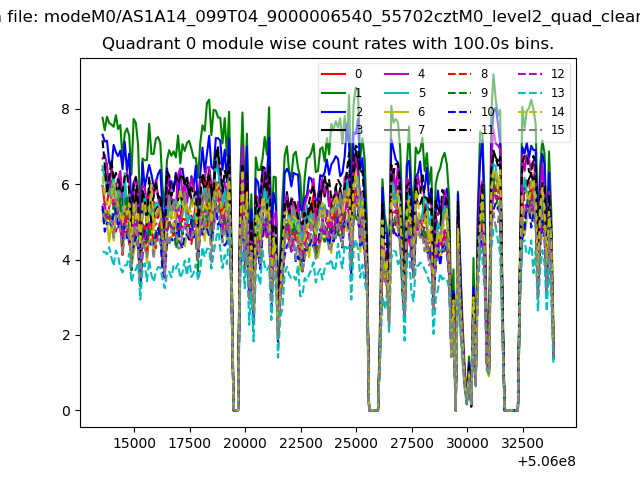 |
 |
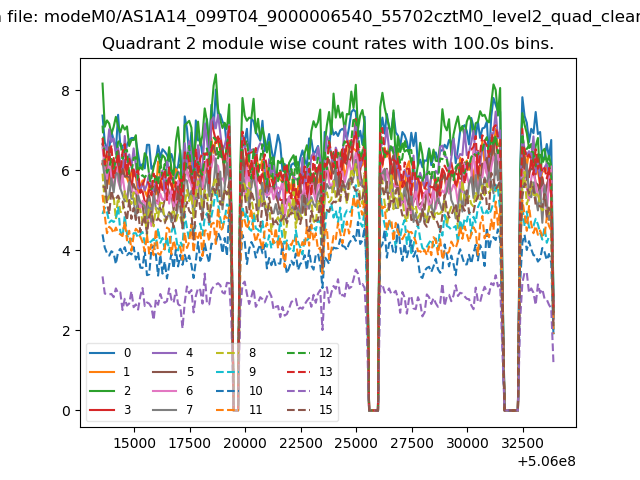
| Module-wise count rates for Quadrant B Data is divided into 100 sec bins |
 |
 |
| Module-wise count rates for Quadrant C Data is divided into 100 sec bins |
 |
 |
| Module-wise count rates for Quadrant D Data is divided into 100 sec bins |
 |
 |
| Parameter | Plot |
|---|---|
| CZT HV Monitor | 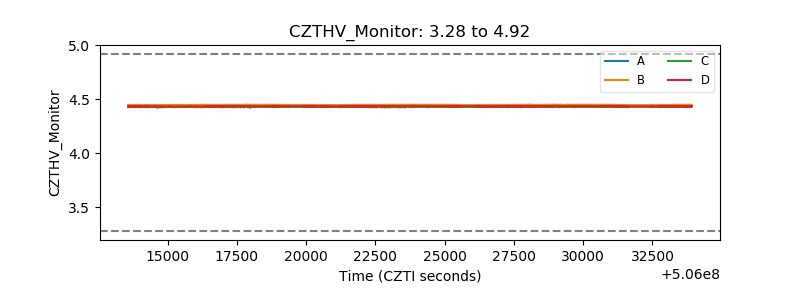 |
| D_VDD | 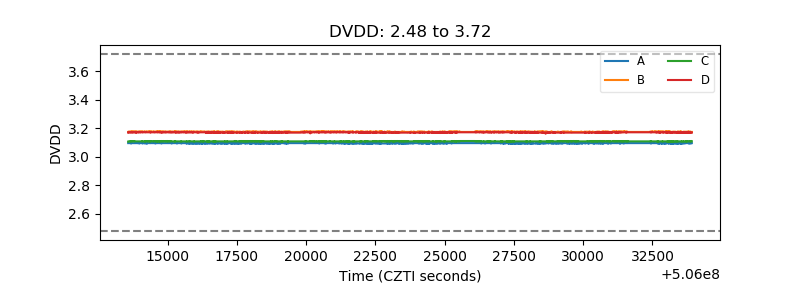 |
| Temperature 1 | 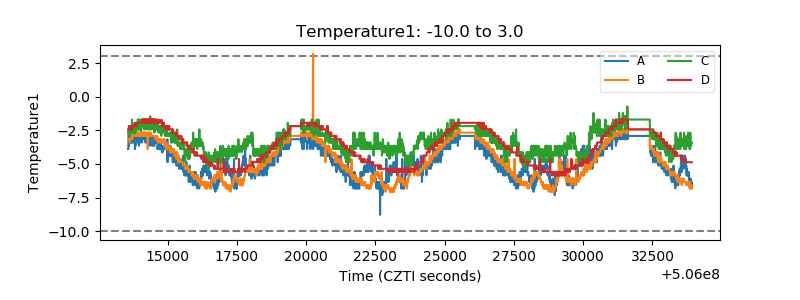 |
| Veto HV Monitor | 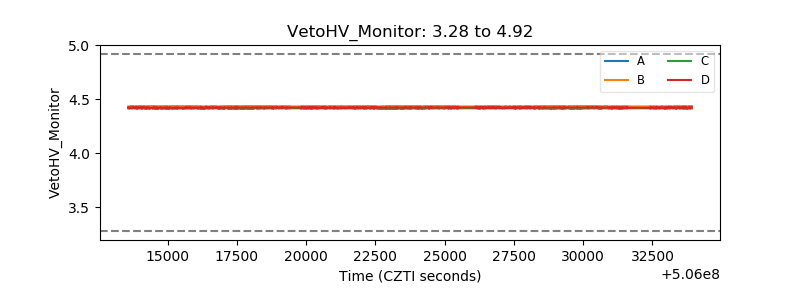 |
| Veto LLD | 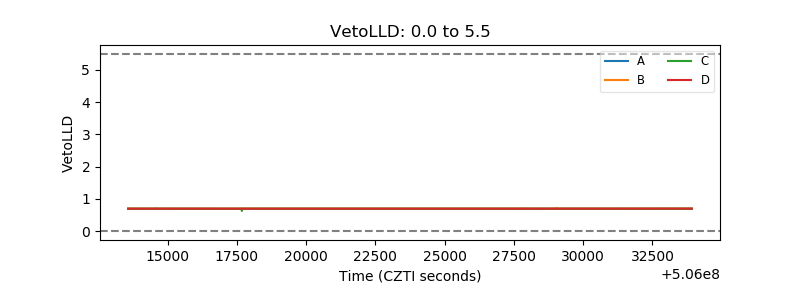 |
| Alpha Counter | 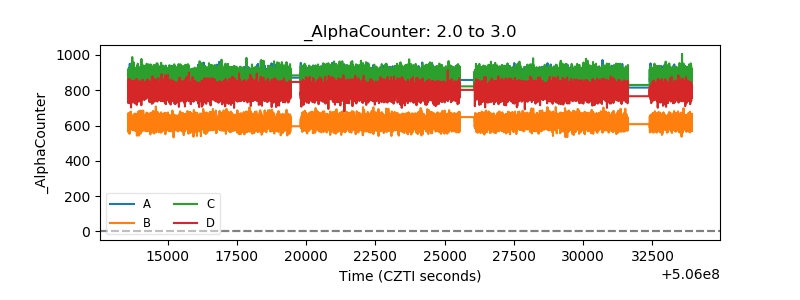 |
| _CPM_Rate | 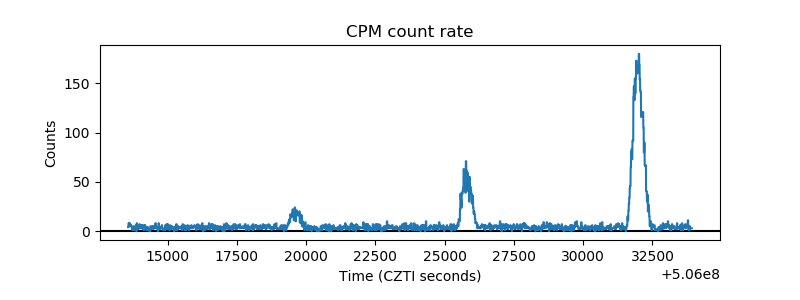 |
| CZT Counter | 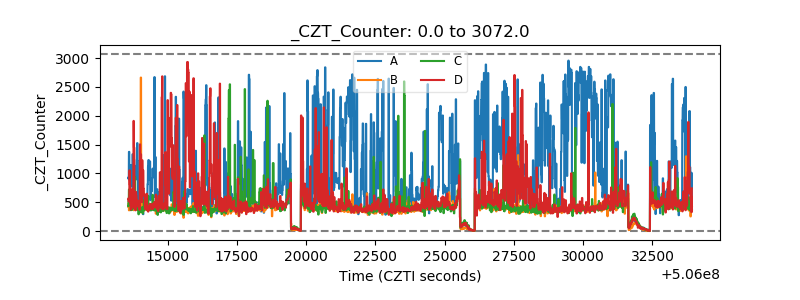 |
| +2.5 Volts monitor |  |
| +5 Volts monitor |  |
| _ROLL_ROT | 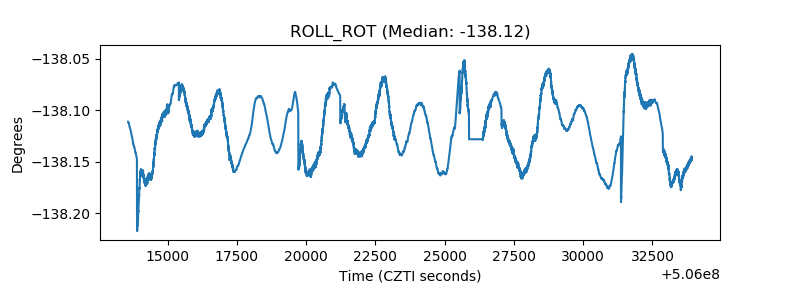 |
| _Roll_DEC | 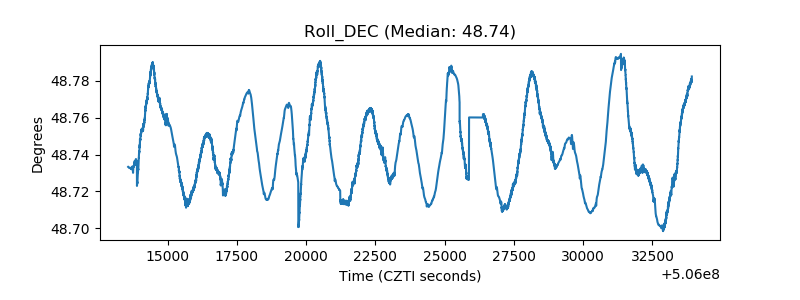 |
| _Roll_RA | 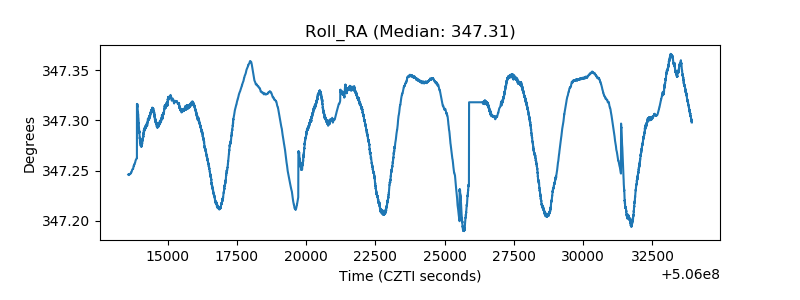 |
| Veto Counter | 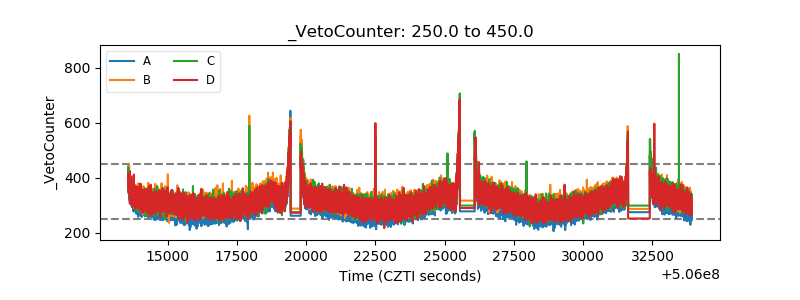 |