| Param | Original file | Final file |
|---|---|---|
| Filename | modeM0/AS1A14_099T04_9000006540_55706cztM0_level2.fits | modeM0/AS1A14_099T04_9000006540_55706cztM0_level2_quad_clean.evt |
| Size (bytes) | 482,849,280 | 93,611,520 |
| Size | 460.5 MB | 89.3 MB |
| Events in quadrant A | 7,318,359 | 523,035 |
| Events in quadrant B | 3,074,141 | 680,442 |
| Events in quadrant C | 3,172,671 | 612,996 |
| Events in quadrant D | 3,801,396 | 563,511 |
| Mode M0 | |||
|---|---|---|---|
| Quadrant | BADHDUFLAG | Total packets | Discarded packets |
| A | 0 | 26266 | 2 |
| B | 0 | 13912 | 2 |
| C | 0 | 14255 | 2 |
| D | 0 | 15937 | 3 |
| Mode M9 | |||
|---|---|---|---|
| Quadrant | BADHDUFLAG | Total packets | Discarded packets |
| A | 0 | 20 | 0 |
| B | 0 | 21 | 0 |
| C | 0 | 21 | 0 |
| D | 0 | 21 | 0 |
| Mode SS | |||
|---|---|---|---|
| Quadrant | BADHDUFLAG | Total packets | Discarded packets |
| A | 0 | 132 | 0 |
| B | 0 | 132 | 0 |
| C | 0 | 132 | 0 |
| D | 0 | 132 | 0 |
| Quadrant | Total seconds | Saturated seconds | Saturation percentage |
|---|---|---|---|
| A | 6520 | 1262 | 19.355828% |
| B | 6520 | 68 | 1.042945% |
| C | 6520 | 55 | 0.843558% |
| D | 6519 | 167 | 2.561743% |
Noise dominated data is calculated using 1-second bins in cleaned event files. If a bin has >2000 counts, and if more than 50% of those come from <1% of pixels, then it is considered to be noise-dominated and hence unusable.
| Quadrant | # 1 sec bins | Bins with >0 counts | Bins with >2000 counts | High rate bins dominated by noise | Noise dominated (total time) | Noise dominated (detector-on time) | Marked lightcurve |
|---|---|---|---|---|---|---|---|
| A | 7666 | 6520 | 1121 | 1121 | 14.62% | 17.19% | 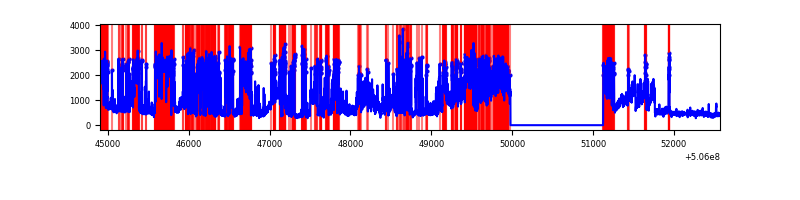 |
| B | 7666 | 6520 | 31 | 31 | 0.40% | 0.48% | 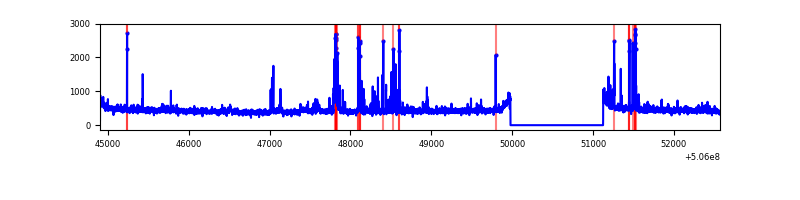 |
| C | 7666 | 6521 | 52 | 52 | 0.68% | 0.80% | 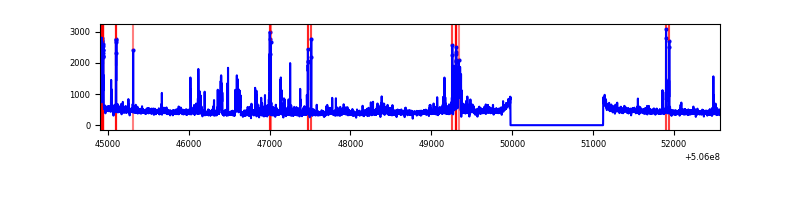 |
| D | 7665 | 6520 | 153 | 153 | 2.00% | 2.35% | 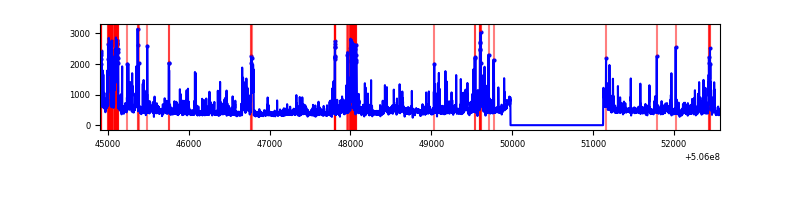 |
Top three noisy pixels from each quadrant. If the there are fewer than three noisy pixels in the level2.evt file, extra rows are filled as -1
| Pixel properties | Quadrant properties | ||||||
|---|---|---|---|---|---|---|---|
| Quadrant | DetID | PixID | Counts | Sigma | Mean | Median | Sigma |
| A | 15 | 32 | 3756938 | 23846.48 | 640 | 625 | 157.5 |
| A | 5 | 241 | 528384 | 3350.41 | 640 | 625 | 157.5 |
| A | 0 | 8 | 233775 | 1480.12 | 640 | 625 | 157.5 |
| B | 0 | 173 | 116686 | 776.4 | 693 | 668 | 149.4 |
| B | 0 | 182 | 81396 | 540.24 | 693 | 668 | 149.4 |
| B | 0 | 199 | 56888 | 376.23 | 693 | 668 | 149.4 |
| C | 6 | 223 | 121068 | 639.51 | 681 | 675 | 188.3 |
| C | 14 | 96 | 106755 | 563.48 | 681 | 675 | 188.3 |
| C | 1 | 16 | 78576 | 413.8 | 681 | 675 | 188.3 |
| D | 11 | 129 | 910417 | 4740.17 | 670 | 640 | 191.9 |
| D | 8 | 245 | 123988 | 642.67 | 670 | 640 | 191.9 |
| D | 7 | 129 | 68995 | 356.15 | 670 | 640 | 191.9 |
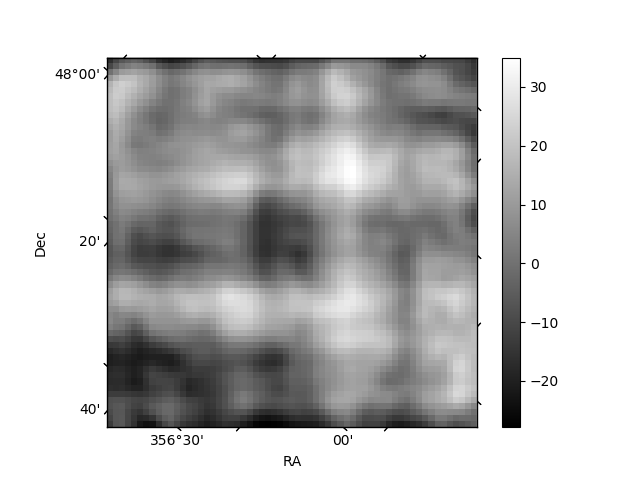
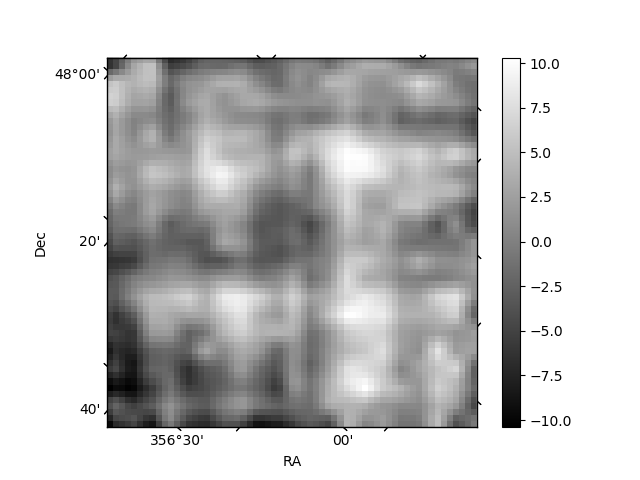
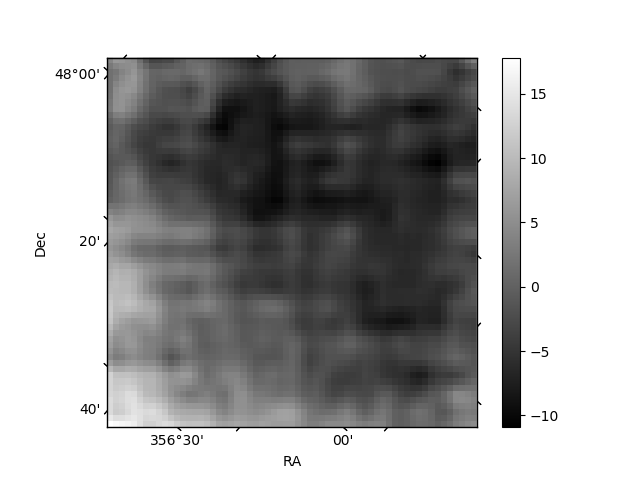
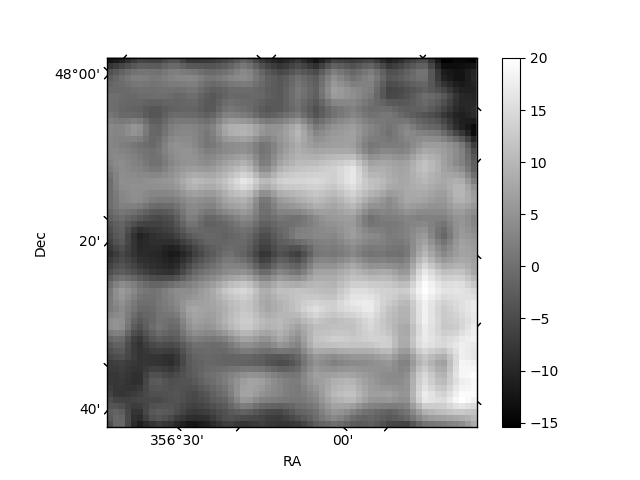
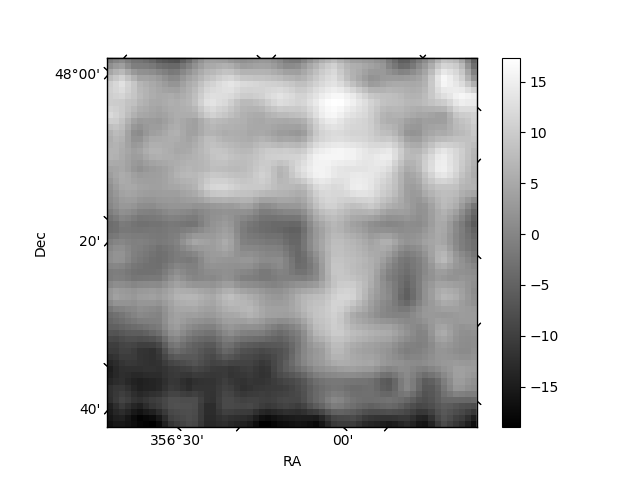
Histogram calculated using DETX and DETY for each event in the final _common_clean file
| Quadrant A | 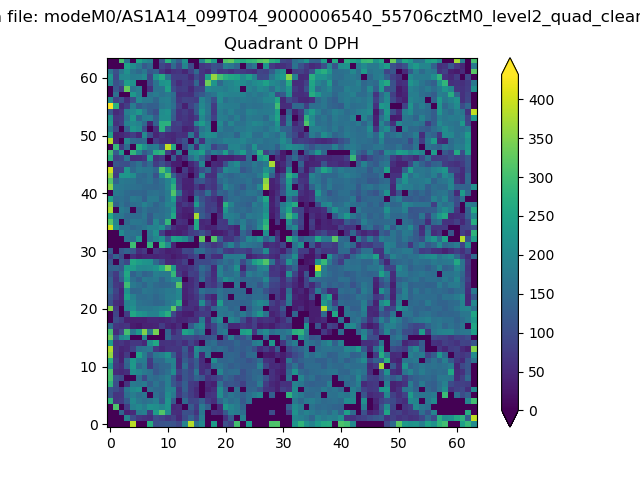 |
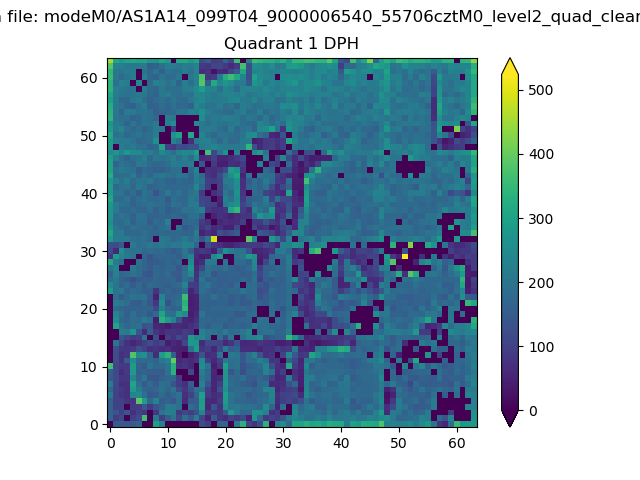 |
Quadrant B |
|---|---|---|---|
| Quadrant D | 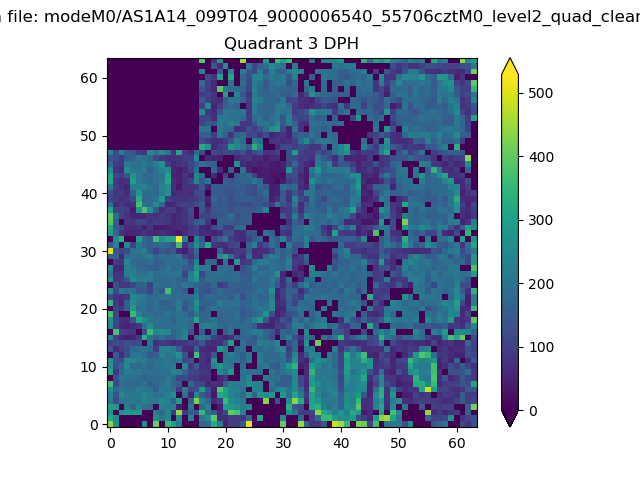 |
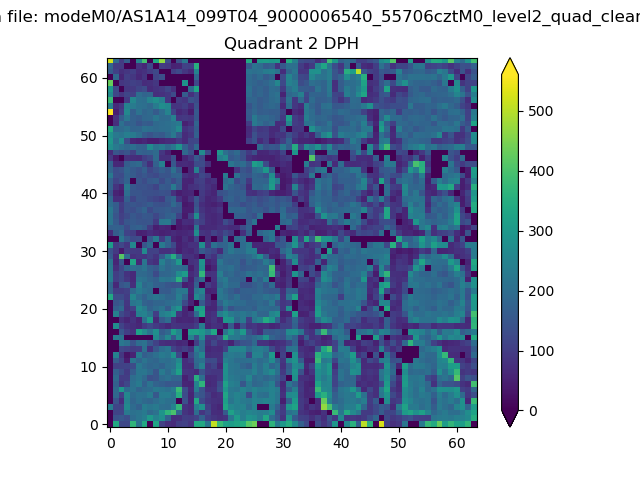 |
Quadrant C |
| Plot type | Count rate plots | Images |
|---|---|---|
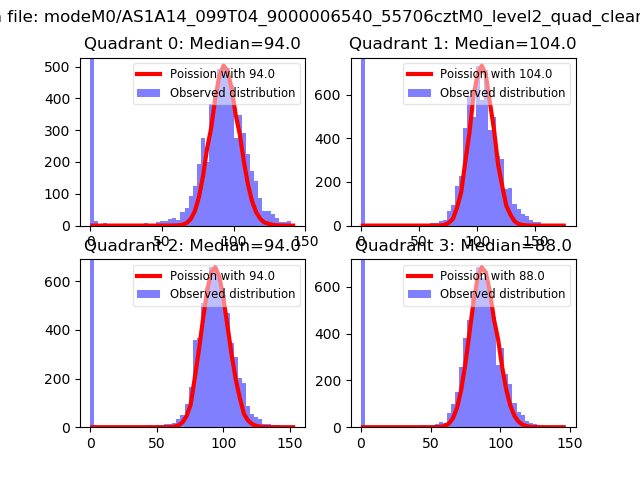
| Comparison with Poisson distribution Blue bars denote a histogram of data divided into 1 sec bins. Red curve is a Poisson curve with rate = median count rate of data. |
 |
 |
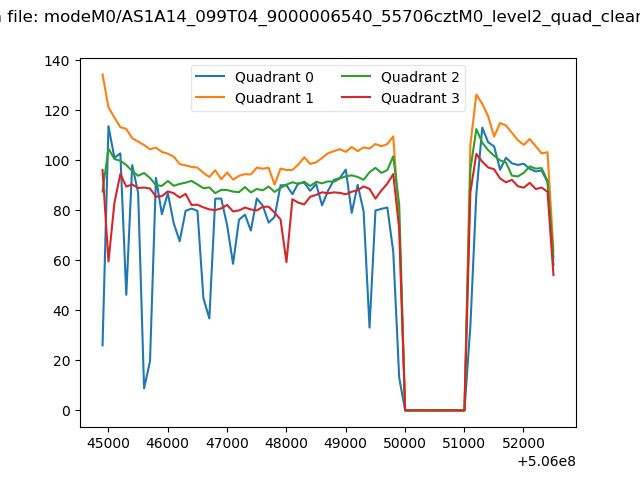
| Quadrant-wise count rates Data is divided into 100 sec bins |
 |
|
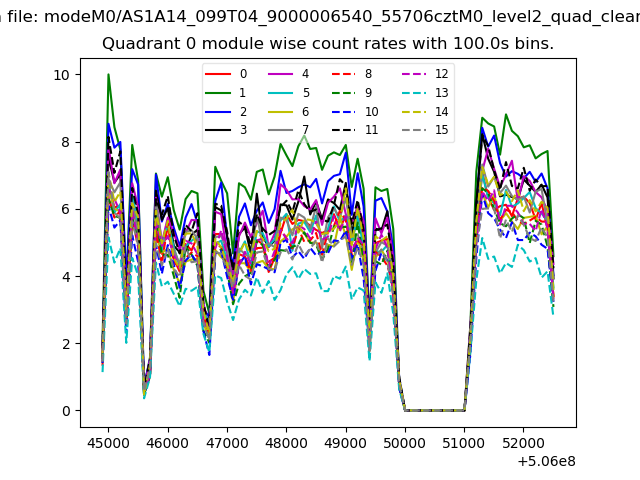
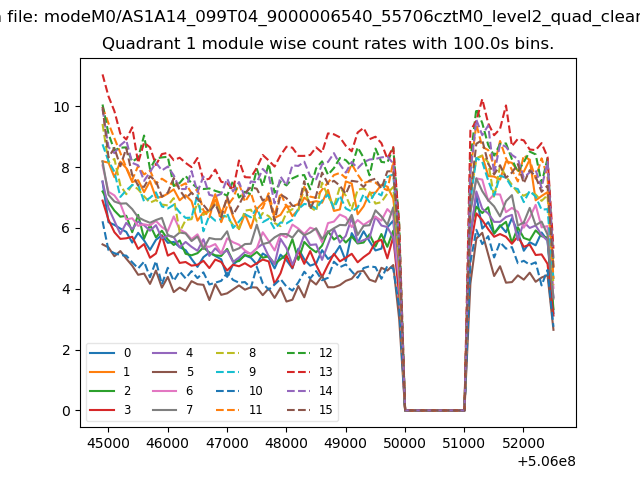
| Module-wise count rates for Quadrant A Data is divided into 100 sec bins |
 |
 |
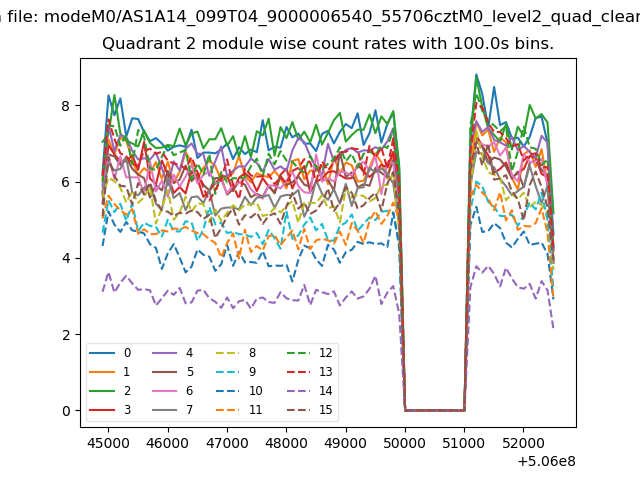
| Module-wise count rates for Quadrant B Data is divided into 100 sec bins |
 |
 |
| Module-wise count rates for Quadrant C Data is divided into 100 sec bins |
 |
 |
| Module-wise count rates for Quadrant D Data is divided into 100 sec bins |
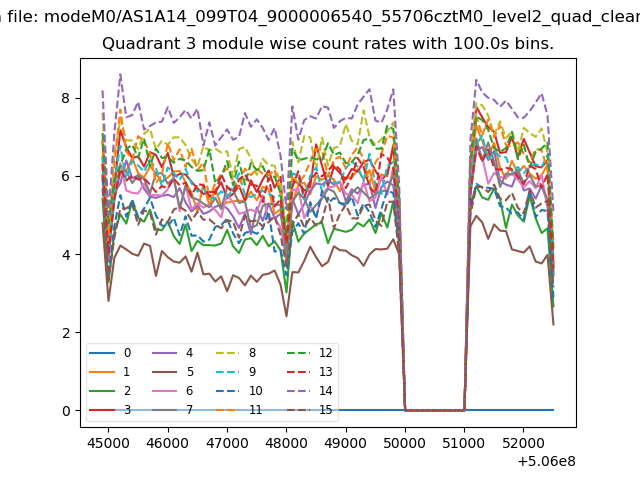 |
 |
| Parameter | Plot |
|---|---|
| CZT HV Monitor | 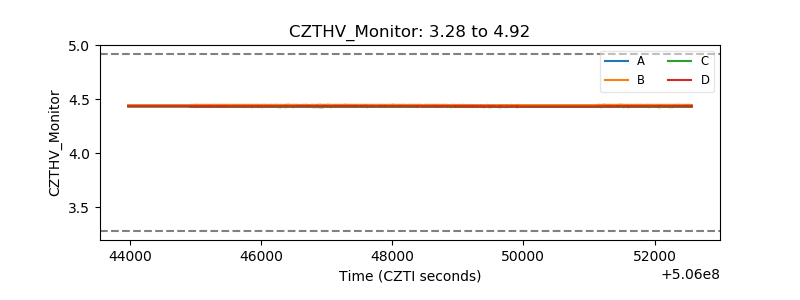 |
| D_VDD | 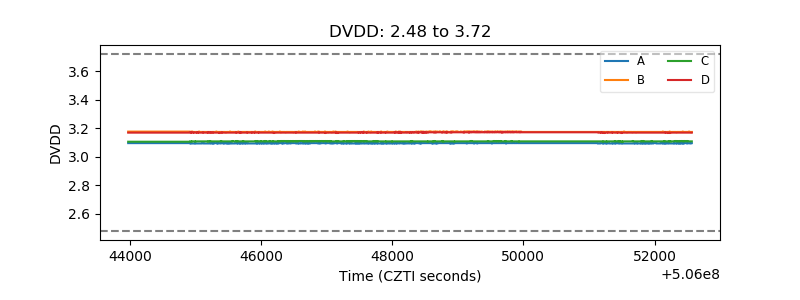 |
| Temperature 1 | 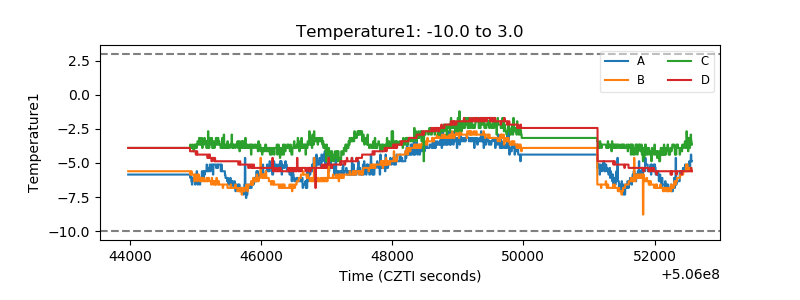 |
| Veto HV Monitor | 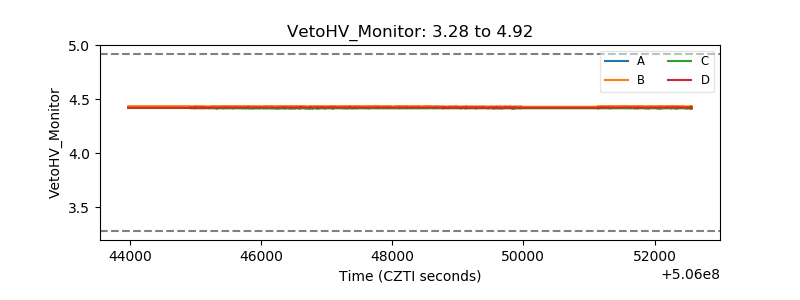 |
| Veto LLD | 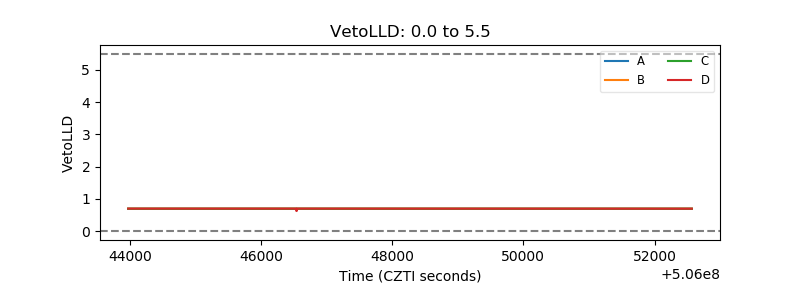 |
| Alpha Counter | 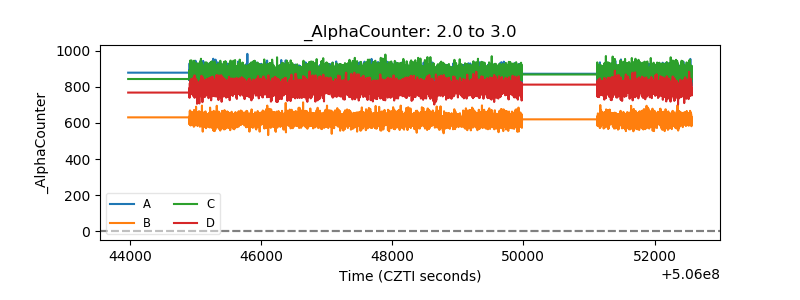 |
| _CPM_Rate | 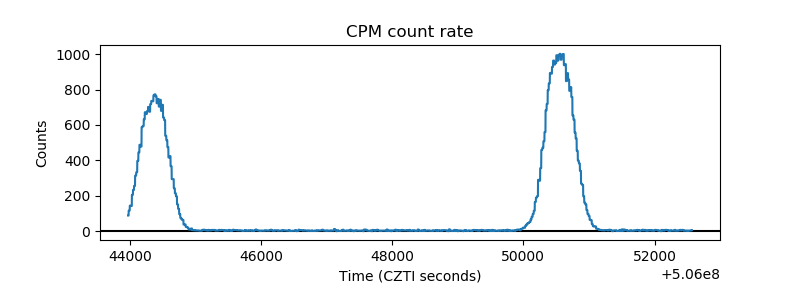 |
| CZT Counter | 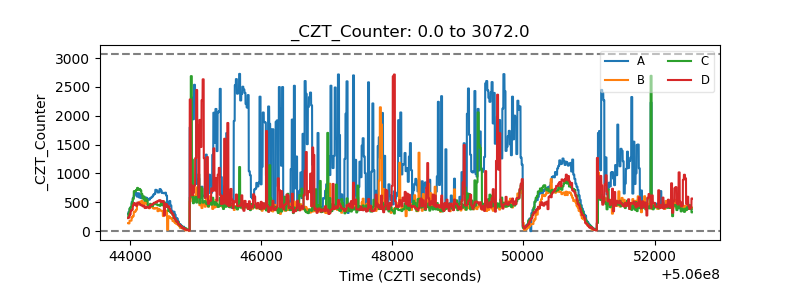 |
| +2.5 Volts monitor |  |
| +5 Volts monitor |  |
| _ROLL_ROT | 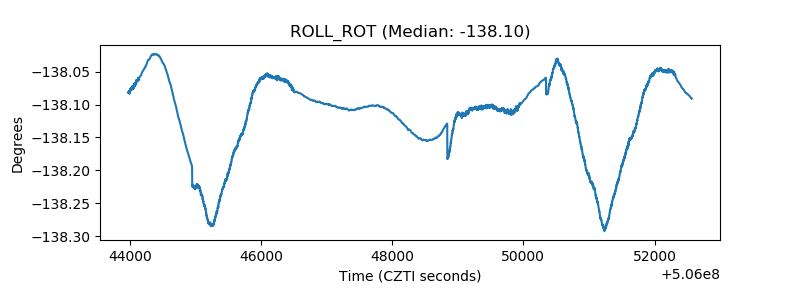 |
| _Roll_DEC | 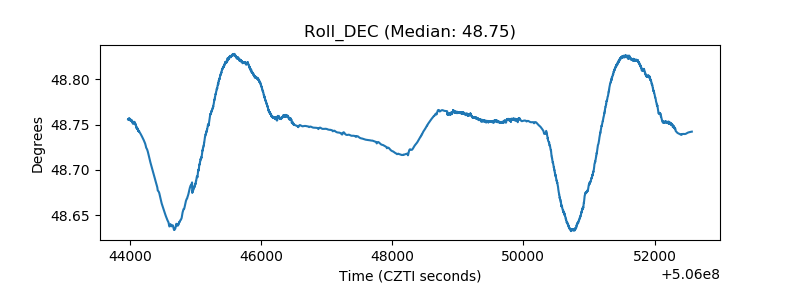 |
| _Roll_RA | 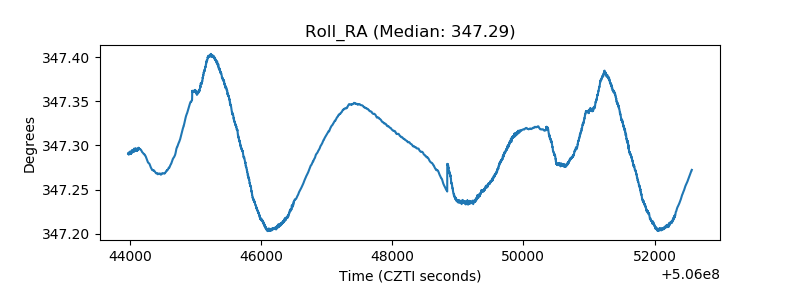 |
| Veto Counter | 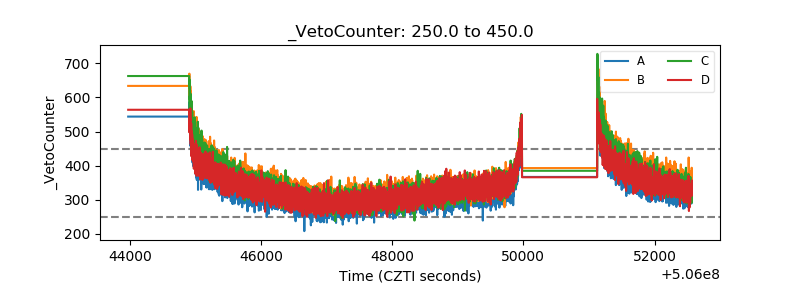 |