| Param | Original file | Final file |
|---|---|---|
| Filename | modeM0/AS1A14_099T04_9000006540_55708cztM0_level2.fits | modeM0/AS1A14_099T04_9000006540_55708cztM0_level2_quad_clean.evt |
| Size (bytes) | 455,002,560 | 94,947,840 |
| Size | 433.9 MB | 90.5 MB |
| Events in quadrant A | 6,414,355 | 557,678 |
| Events in quadrant B | 2,869,306 | 682,533 |
| Events in quadrant C | 3,204,996 | 618,845 |
| Events in quadrant D | 3,849,892 | 563,649 |
| Mode M0 | |||
|---|---|---|---|
| Quadrant | BADHDUFLAG | Total packets | Discarded packets |
| A | 0 | 23394 | 2 |
| B | 0 | 13512 | 2 |
| C | 0 | 14473 | 2 |
| D | 0 | 16182 | 2 |
| Mode M9 | |||
|---|---|---|---|
| Quadrant | BADHDUFLAG | Total packets | Discarded packets |
| A | 0 | 15 | 0 |
| B | 0 | 16 | 0 |
| C | 0 | 16 | 0 |
| D | 0 | 16 | 0 |
| Mode SS | |||
|---|---|---|---|
| Quadrant | BADHDUFLAG | Total packets | Discarded packets |
| A | 0 | 132 | 0 |
| B | 0 | 132 | 0 |
| C | 0 | 132 | 0 |
| D | 0 | 132 | 0 |
| Quadrant | Total seconds | Saturated seconds | Saturation percentage |
|---|---|---|---|
| A | 6486 | 918 | 14.153562% |
| B | 6485 | 104 | 1.603701% |
| C | 6485 | 71 | 1.094834% |
| D | 6485 | 191 | 2.945258% |
Noise dominated data is calculated using 1-second bins in cleaned event files. If a bin has >2000 counts, and if more than 50% of those come from <1% of pixels, then it is considered to be noise-dominated and hence unusable.
| Quadrant | # 1 sec bins | Bins with >0 counts | Bins with >2000 counts | High rate bins dominated by noise | Noise dominated (total time) | Noise dominated (detector-on time) | Marked lightcurve |
|---|---|---|---|---|---|---|---|
| A | 7630 | 6485 | 845 | 845 | 11.07% | 13.03% | 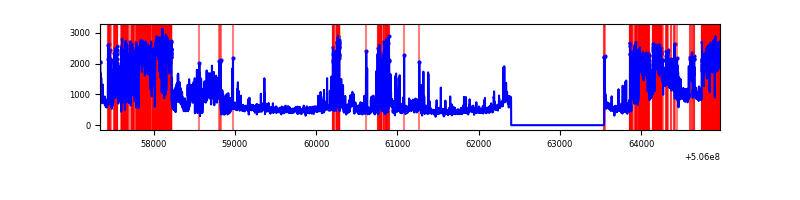 |
| B | 7630 | 6485 | 4 | 4 | 0.05% | 0.06% | 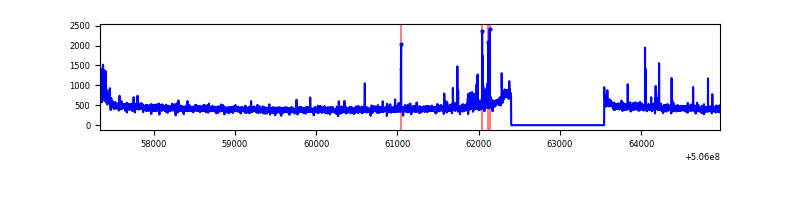 |
| C | 7630 | 6485 | 41 | 41 | 0.54% | 0.63% | 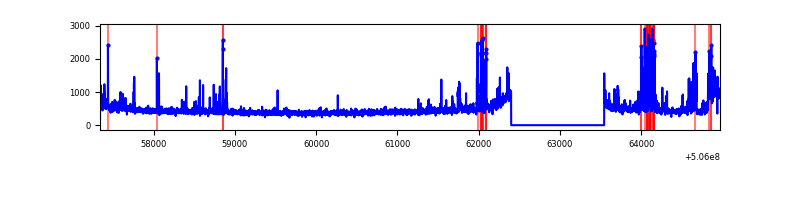 |
| D | 7630 | 6485 | 134 | 134 | 1.76% | 2.07% | 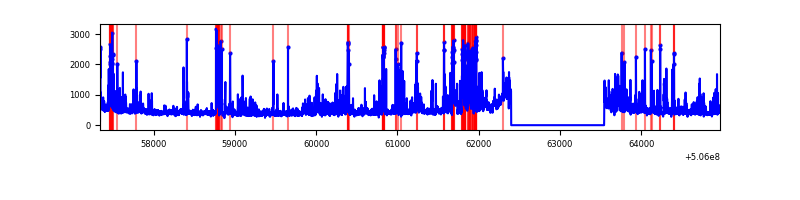 |
Top three noisy pixels from each quadrant. If the there are fewer than three noisy pixels in the level2.evt file, extra rows are filled as -1
| Pixel properties | Quadrant properties | ||||||
|---|---|---|---|---|---|---|---|
| Quadrant | DetID | PixID | Counts | Sigma | Mean | Median | Sigma |
| A | 15 | 32 | 3545715 | 21258.54 | 676 | 658 | 166.8 |
| A | 8 | 249 | 66652 | 395.74 | 676 | 658 | 166.8 |
| A | 0 | 8 | 53285 | 315.59 | 676 | 658 | 166.8 |
| B | 0 | 199 | 34784 | 226.5 | 699 | 675 | 150.6 |
| B | 10 | 247 | 24092 | 155.5 | 699 | 675 | 150.6 |
| B | 12 | 111 | 18349 | 117.37 | 699 | 675 | 150.6 |
| C | 9 | 38 | 162516 | 862.51 | 686 | 680 | 187.6 |
| C | 14 | 96 | 135395 | 717.97 | 686 | 680 | 187.6 |
| C | 12 | 249 | 102352 | 541.87 | 686 | 680 | 187.6 |
| D | 11 | 129 | 944965 | 5007.06 | 675 | 645 | 188.6 |
| D | 8 | 245 | 132497 | 699.12 | 675 | 645 | 188.6 |
| D | 7 | 129 | 64823 | 340.29 | 675 | 645 | 188.6 |
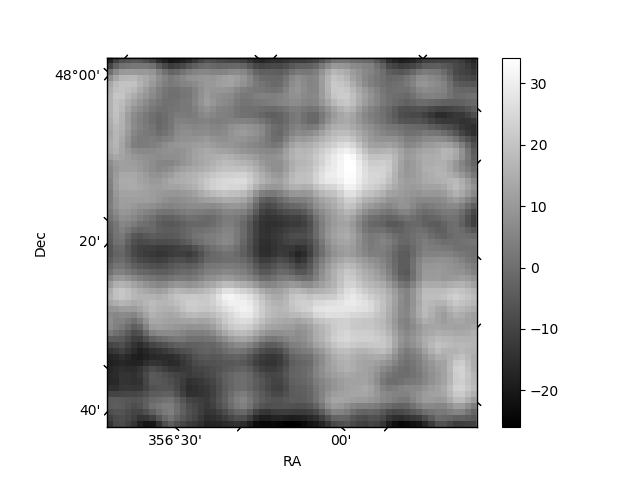
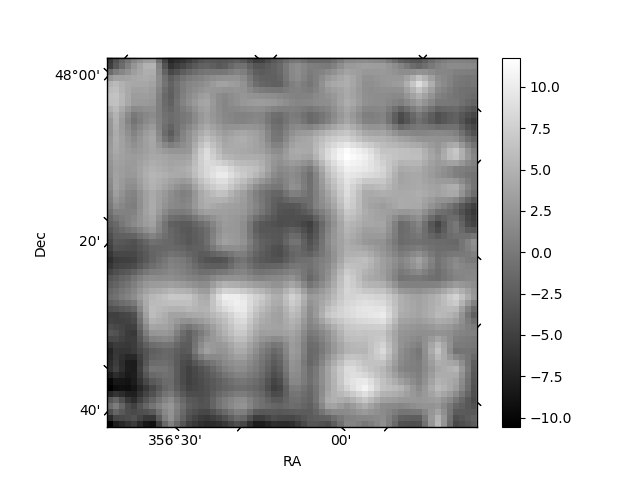
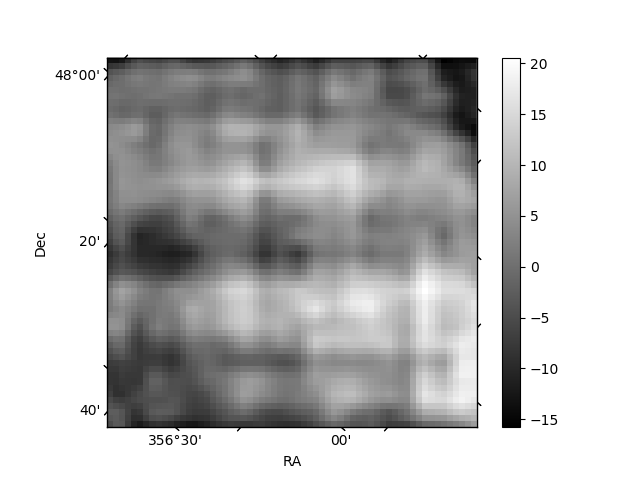
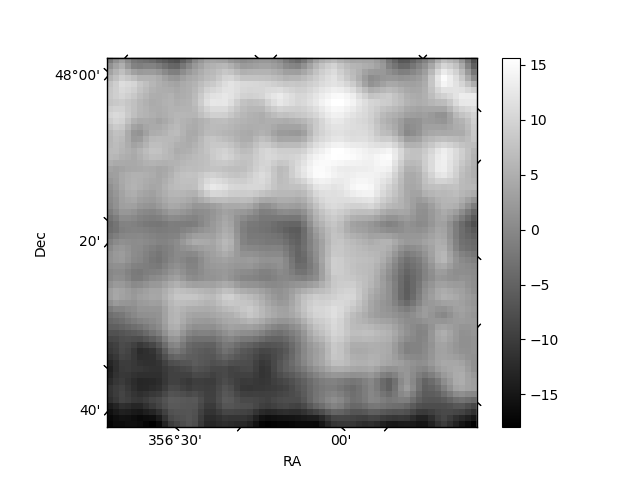
Histogram calculated using DETX and DETY for each event in the final _common_clean file
| Quadrant A | 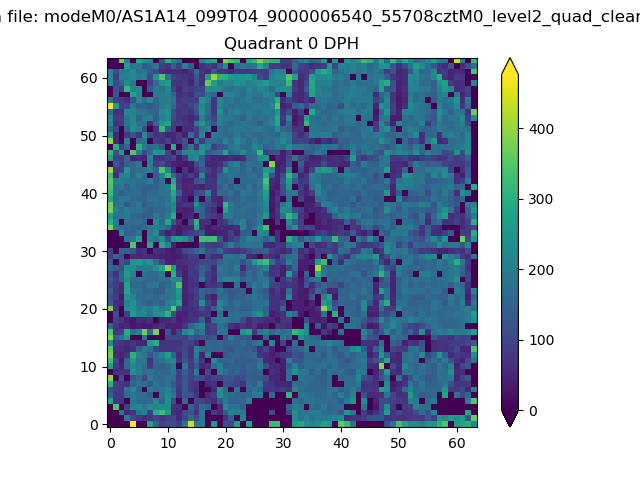 |
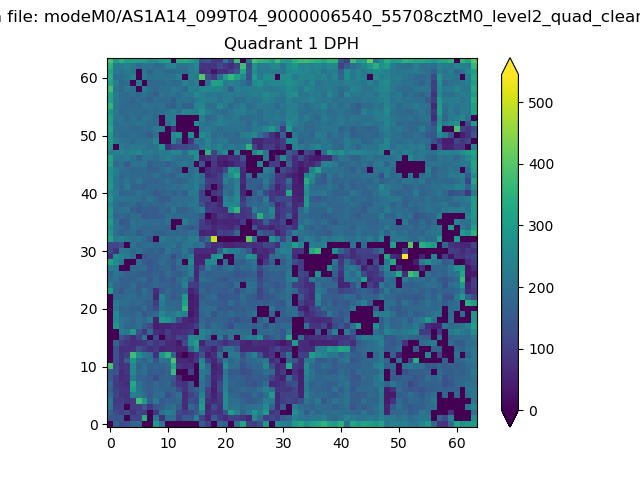 |
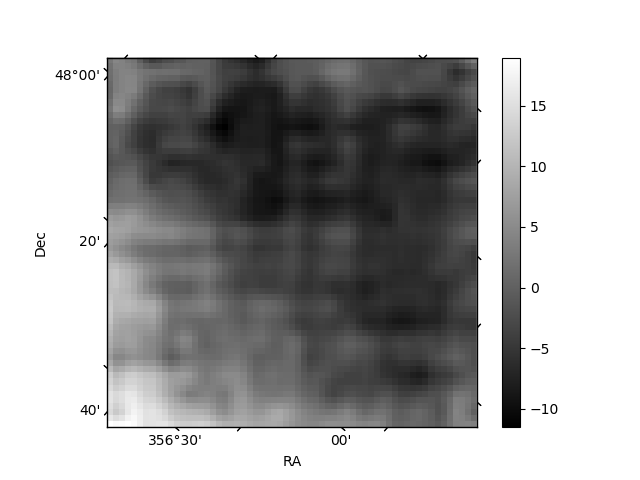
Quadrant B |
|---|---|---|---|
| Quadrant D | 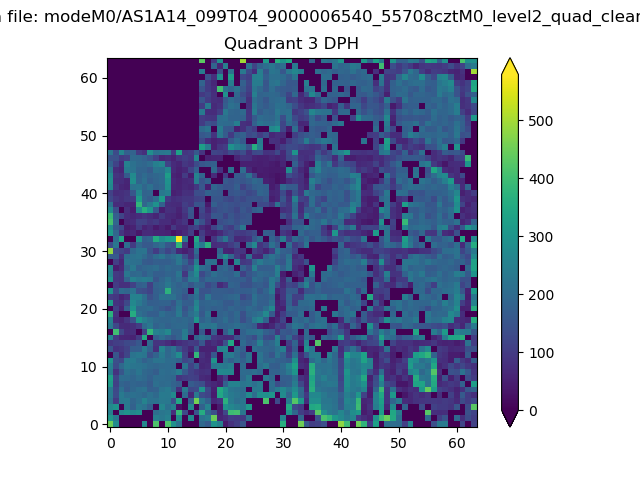 |
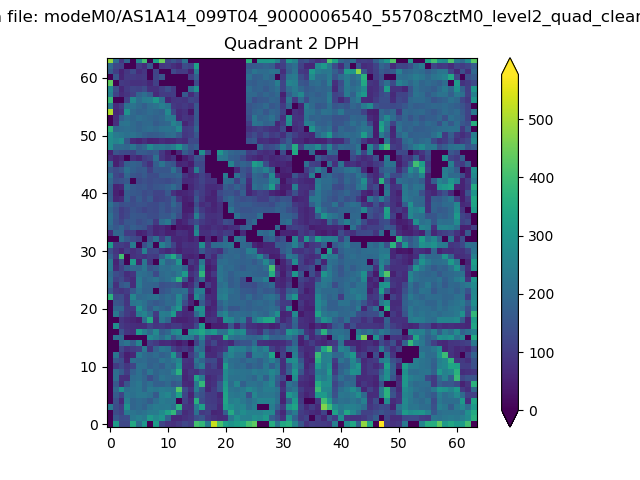 |
Quadrant C |
| Plot type | Count rate plots | Images |
|---|---|---|
| Comparison with Poisson distribution Blue bars denote a histogram of data divided into 1 sec bins. Red curve is a Poisson curve with rate = median count rate of data. |
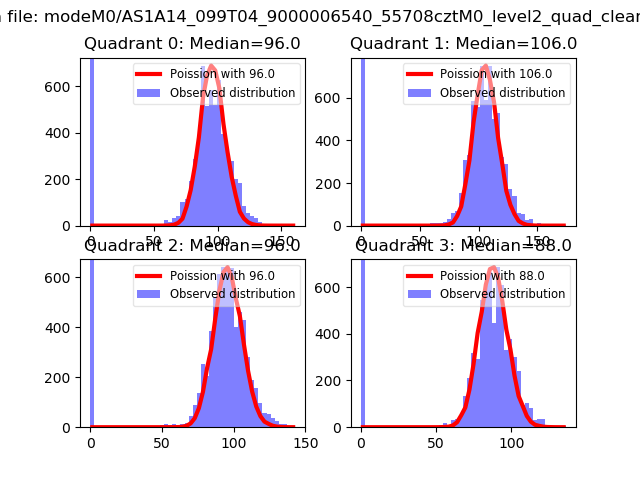 |
 |
| Quadrant-wise count rates Data is divided into 100 sec bins |
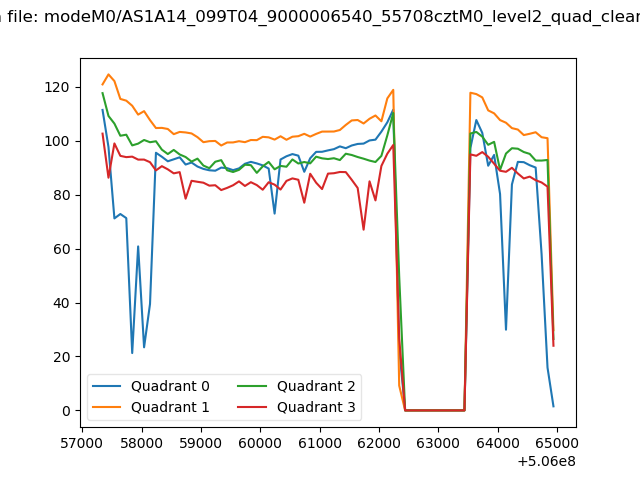 |
|
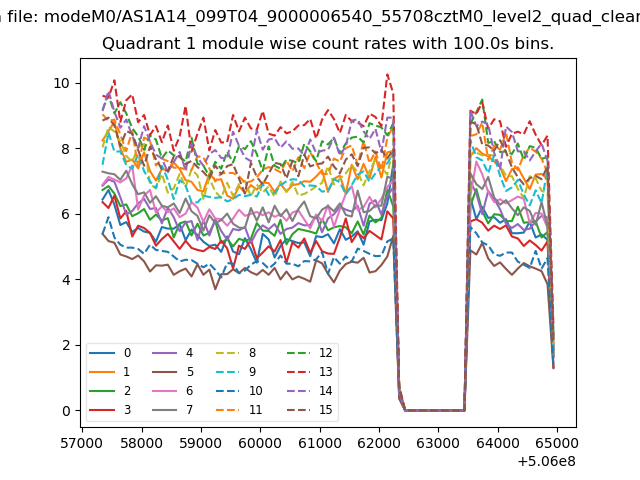
| Module-wise count rates for Quadrant A Data is divided into 100 sec bins |
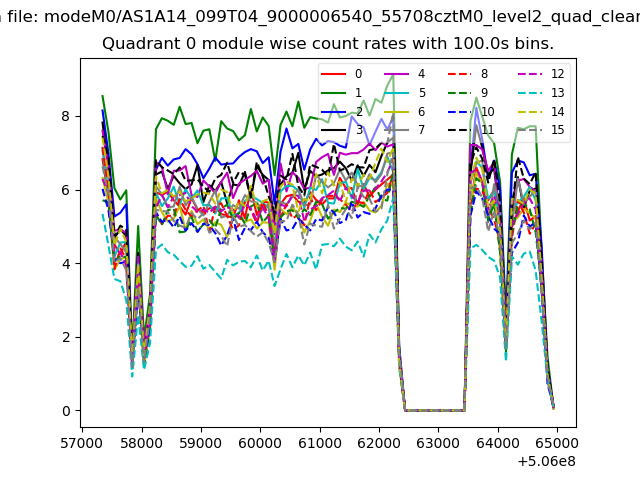 |
 |
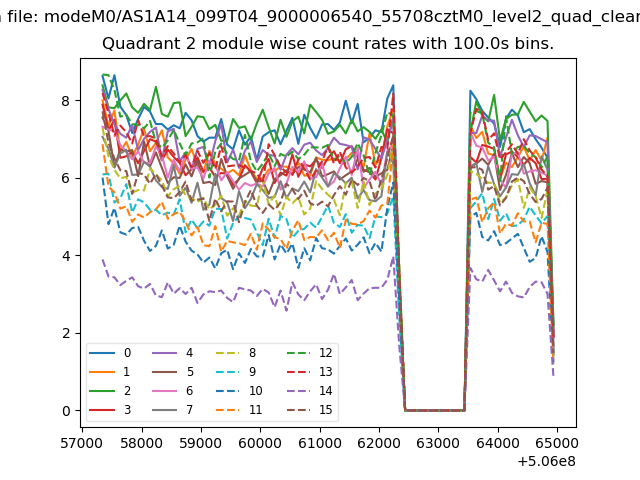
| Module-wise count rates for Quadrant B Data is divided into 100 sec bins |
 |
 |
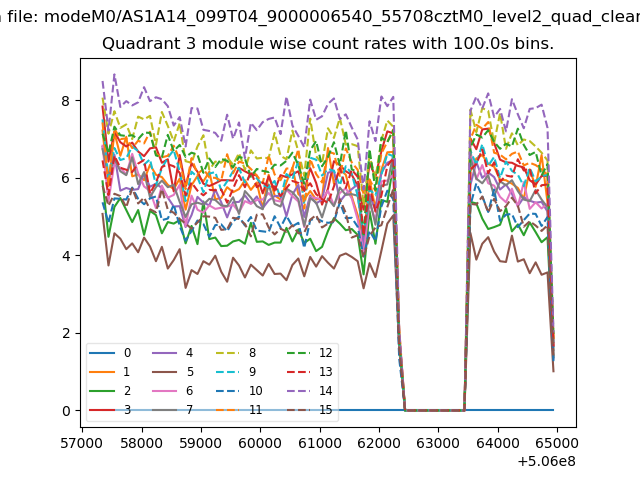
| Module-wise count rates for Quadrant C Data is divided into 100 sec bins |
 |
 |
| Module-wise count rates for Quadrant D Data is divided into 100 sec bins |
 |
 |
| Parameter | Plot |
|---|---|
| CZT HV Monitor | 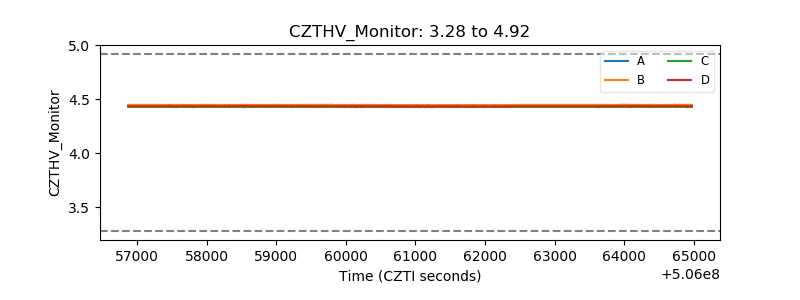 |
| D_VDD | 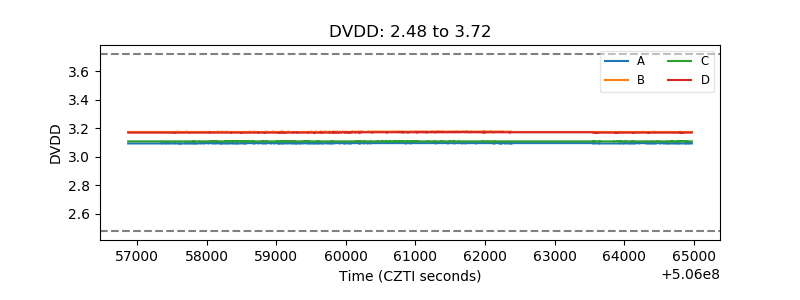 |
| Temperature 1 | 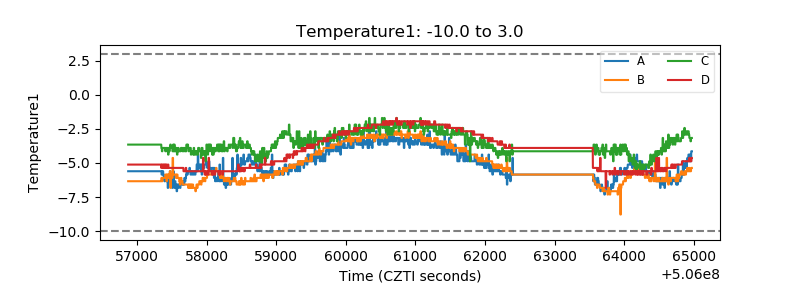 |
| Veto HV Monitor | 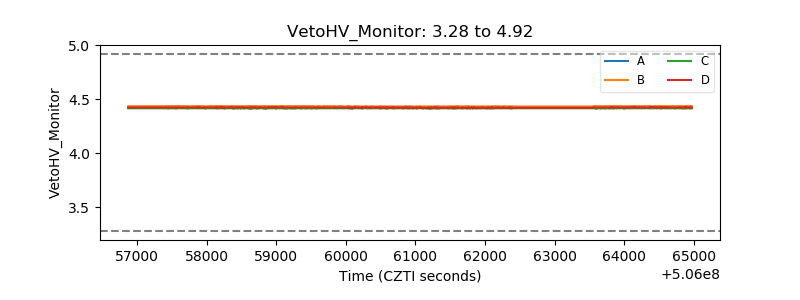 |
| Veto LLD | 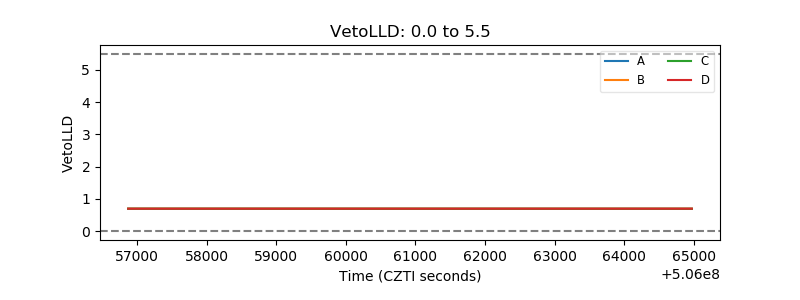 |
| Alpha Counter | 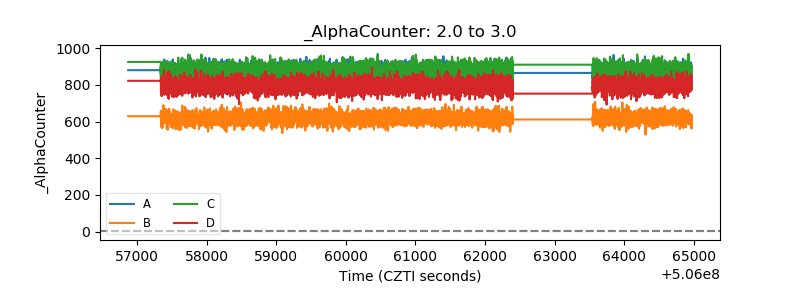 |
| _CPM_Rate | 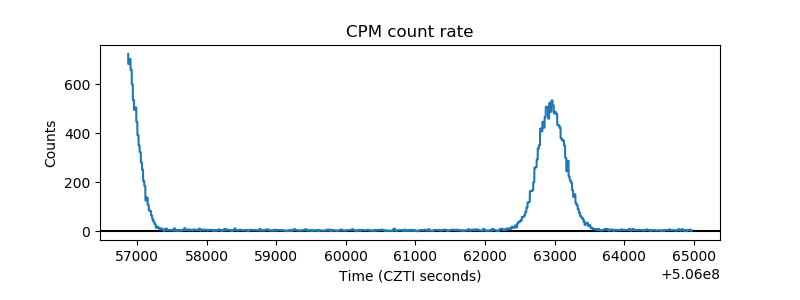 |
| CZT Counter | 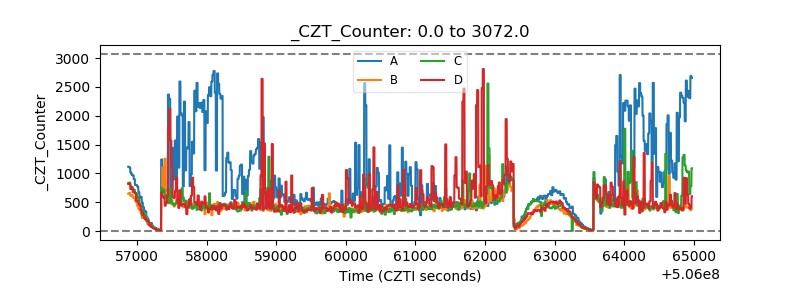 |
| +2.5 Volts monitor | 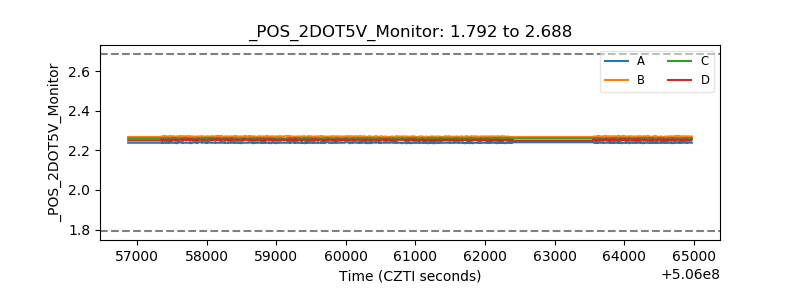 |
| +5 Volts monitor | 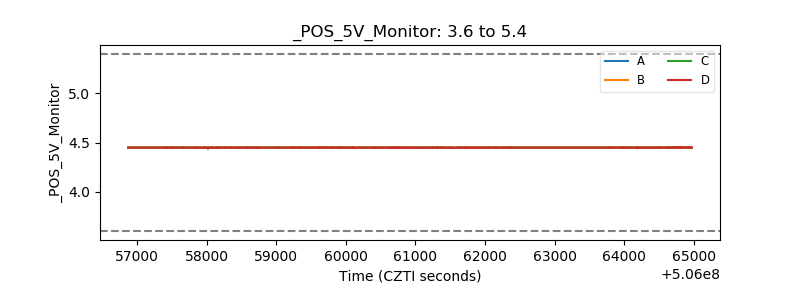 |
| _ROLL_ROT | 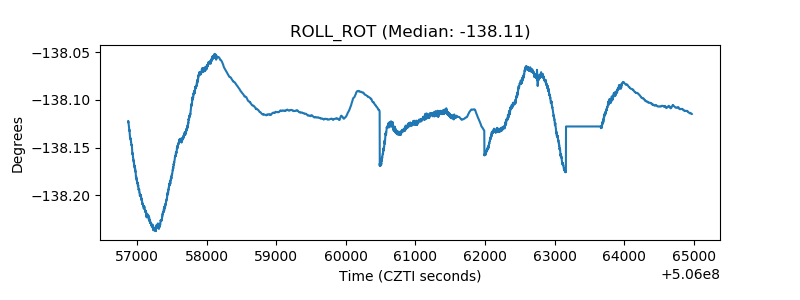 |
| _Roll_DEC | 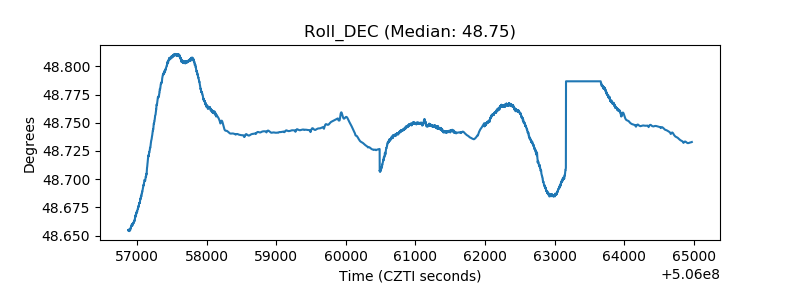 |
| _Roll_RA | 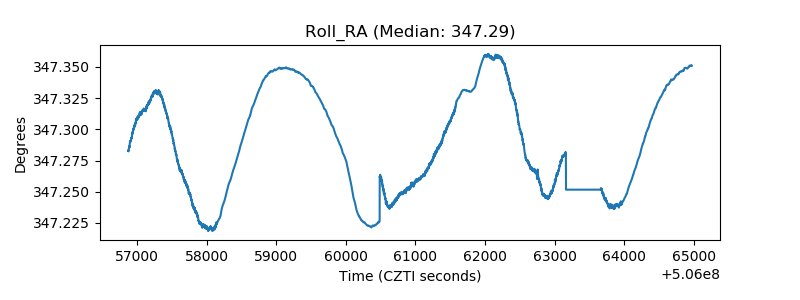 |
| Veto Counter | 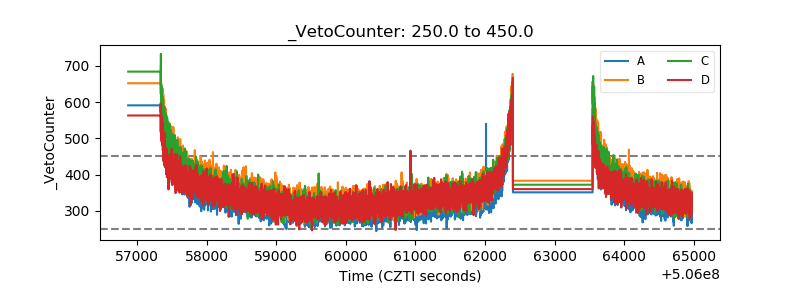 |