| Param | Original file | Final file |
|---|---|---|
| Filename | modeM0/AS1A14_099T04_9000006540_55709cztM0_level2.fits | modeM0/AS1A14_099T04_9000006540_55709cztM0_level2_quad_clean.evt |
| Size (bytes) | 553,985,280 | 90,060,480 |
| Size | 528.3 MB | 85.9 MB |
| Events in quadrant A | 9,497,659 | 452,137 |
| Events in quadrant B | 2,793,263 | 663,822 |
| Events in quadrant C | 3,413,957 | 603,380 |
| Events in quadrant D | 4,297,506 | 554,113 |
| Mode M0 | |||
|---|---|---|---|
| Quadrant | BADHDUFLAG | Total packets | Discarded packets |
| A | 0 | 32697 | 1 |
| B | 0 | 13383 | 1 |
| C | 0 | 14876 | 1 |
| D | 0 | 17533 | 1 |
| Mode M9 | |||
|---|---|---|---|
| Quadrant | BADHDUFLAG | Total packets | Discarded packets |
| A | 0 | 10 | 0 |
| B | 0 | 10 | 0 |
| C | 0 | 10 | 0 |
| D | 0 | 10 | 0 |
| Mode SS | |||
|---|---|---|---|
| Quadrant | BADHDUFLAG | Total packets | Discarded packets |
| A | 0 | 134 | 0 |
| B | 0 | 134 | 0 |
| C | 0 | 134 | 0 |
| D | 0 | 134 | 0 |
| Quadrant | Total seconds | Saturated seconds | Saturation percentage |
|---|---|---|---|
| A | 6495 | 2112 | 32.517321% |
| B | 6496 | 109 | 1.677956% |
| C | 6496 | 65 | 1.000616% |
| D | 6496 | 205 | 3.155788% |
Noise dominated data is calculated using 1-second bins in cleaned event files. If a bin has >2000 counts, and if more than 50% of those come from <1% of pixels, then it is considered to be noise-dominated and hence unusable.
| Quadrant | # 1 sec bins | Bins with >0 counts | Bins with >2000 counts | High rate bins dominated by noise | Noise dominated (total time) | Noise dominated (detector-on time) | Marked lightcurve |
|---|---|---|---|---|---|---|---|
| A | 7519 | 6494 | 1848 | 1848 | 24.58% | 28.46% | 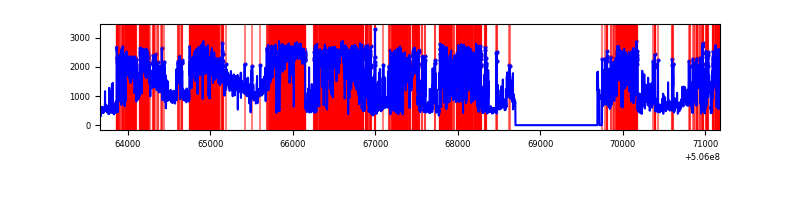 |
| B | 7521 | 6496 | 5 | 5 | 0.07% | 0.08% | 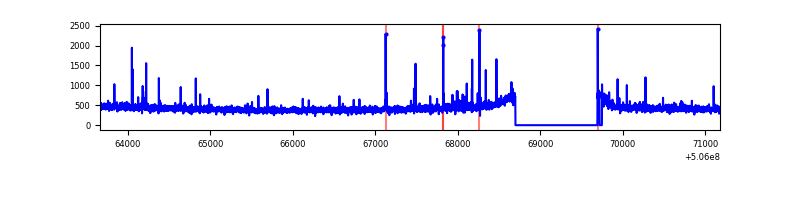 |
| C | 7521 | 6498 | 33 | 33 | 0.44% | 0.51% | 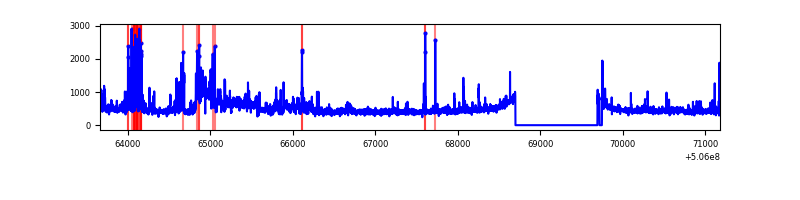 |
| D | 7521 | 6496 | 190 | 190 | 2.53% | 2.92% | 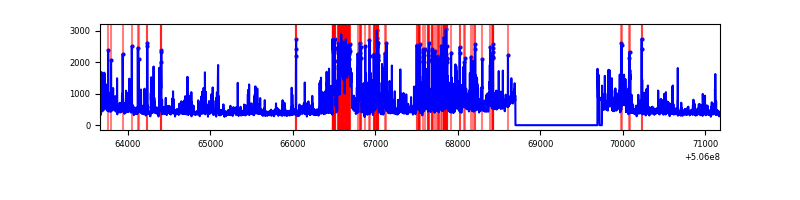 |
Top three noisy pixels from each quadrant. If the there are fewer than three noisy pixels in the level2.evt file, extra rows are filled as -1
| Pixel properties | Quadrant properties | ||||||
|---|---|---|---|---|---|---|---|
| Quadrant | DetID | PixID | Counts | Sigma | Mean | Median | Sigma |
| A | 15 | 32 | 6224100 | 40858.24 | 614 | 597 | 152.3 |
| A | 8 | 206 | 337530 | 2212.02 | 614 | 597 | 152.3 |
| A | 0 | 8 | 291675 | 1910.97 | 614 | 597 | 152.3 |
| B | 10 | 247 | 24143 | 158.27 | 686 | 658 | 148.4 |
| B | 12 | 111 | 18431 | 119.77 | 686 | 658 | 148.4 |
| B | 9 | 251 | 17045 | 110.43 | 686 | 658 | 148.4 |
| C | 9 | 38 | 482922 | 2623.71 | 674 | 668 | 183.8 |
| C | 12 | 249 | 106489 | 575.72 | 674 | 668 | 183.8 |
| C | 14 | 96 | 68095 | 366.84 | 674 | 668 | 183.8 |
| D | 11 | 129 | 1243935 | 6610.27 | 667 | 638 | 188.1 |
| D | 10 | 181 | 259574 | 1376.69 | 667 | 638 | 188.1 |
| D | 8 | 245 | 91033 | 480.61 | 667 | 638 | 188.1 |
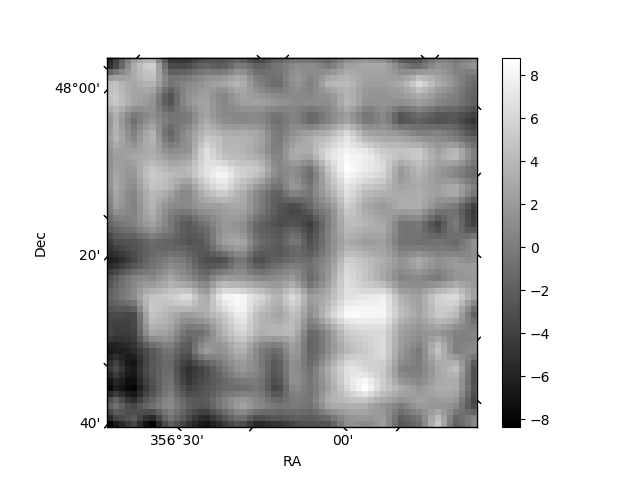
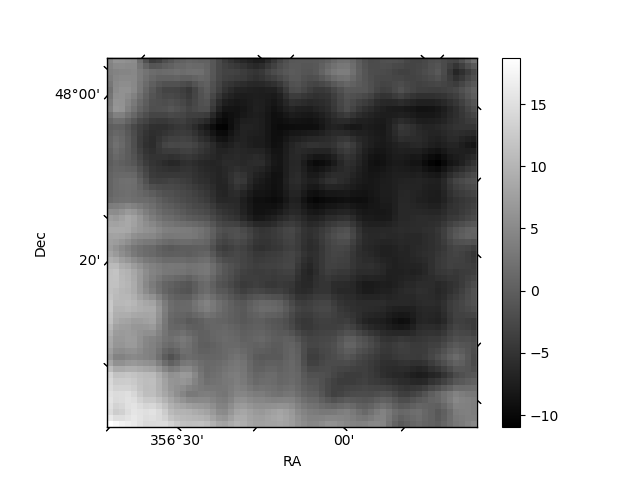
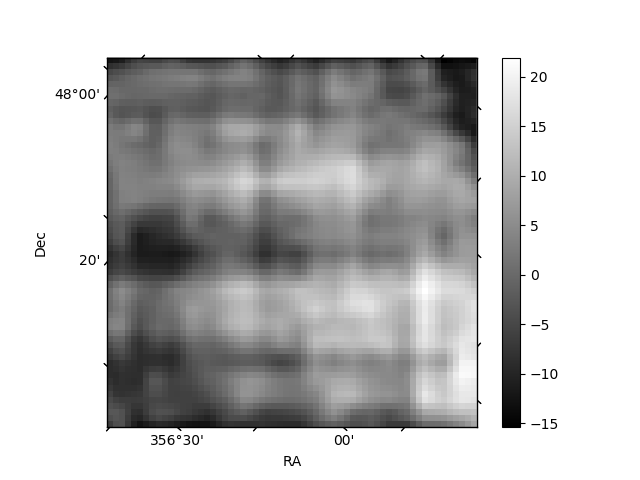
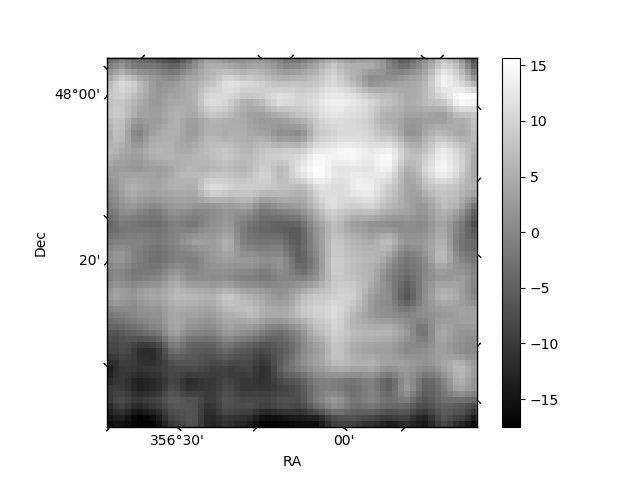
Histogram calculated using DETX and DETY for each event in the final _common_clean file
| Quadrant A | 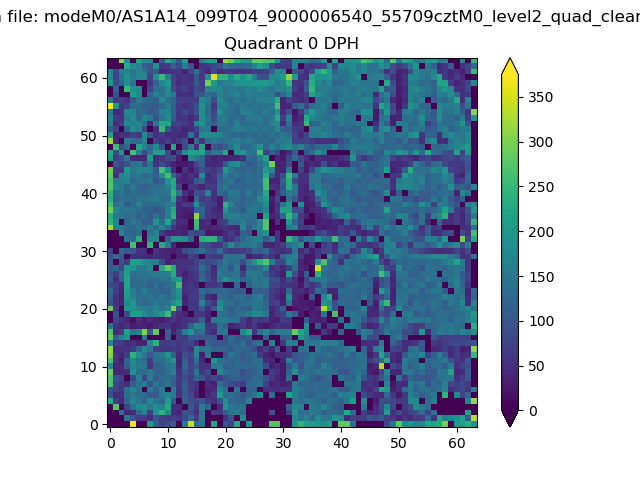 |
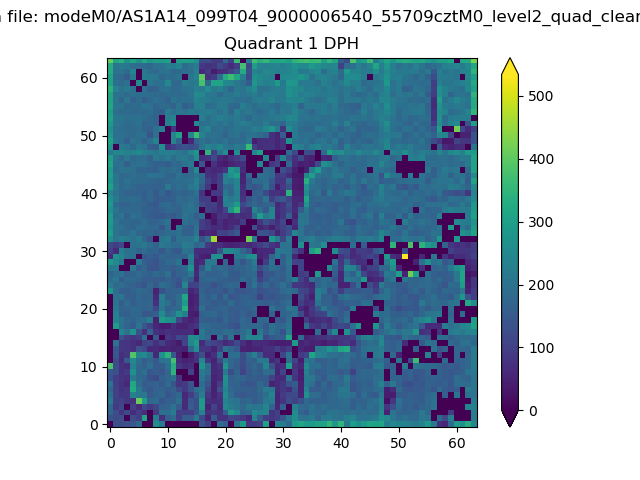 |
Quadrant B |
|---|---|---|---|
| Quadrant D | 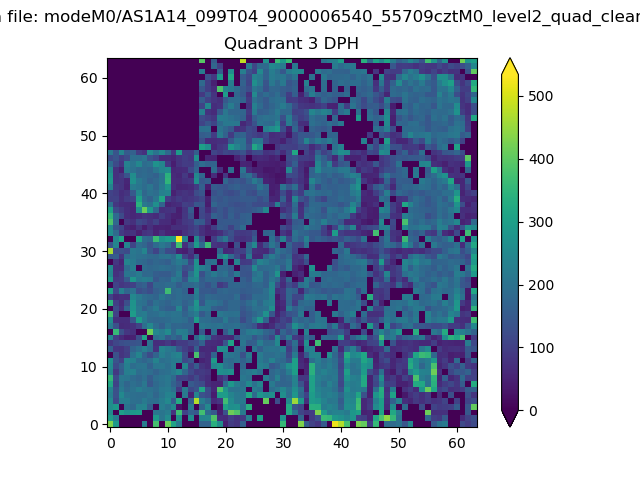 |
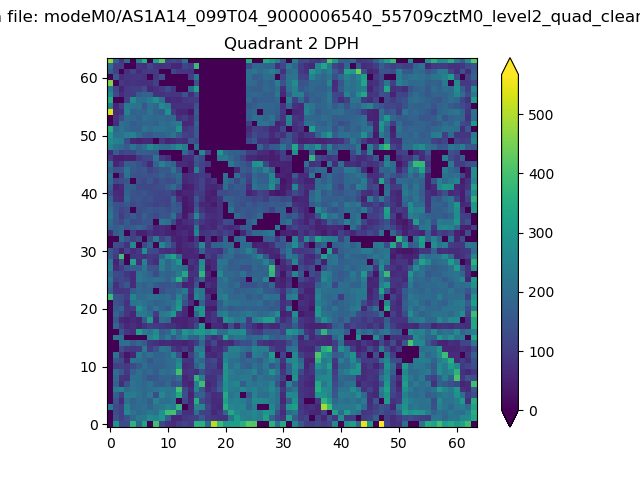 |
Quadrant C |
| Plot type | Count rate plots | Images |
|---|---|---|
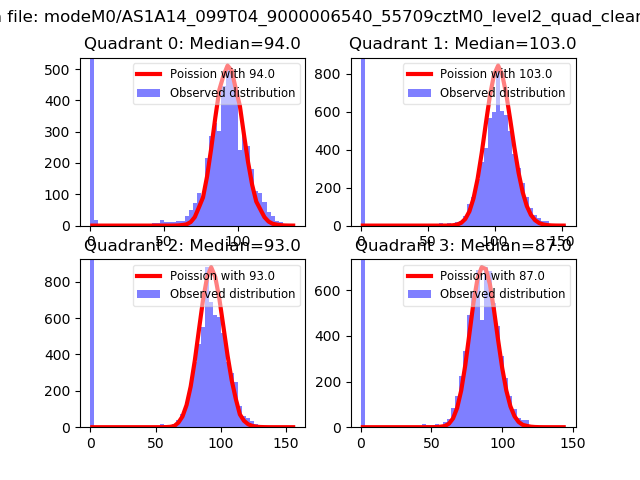
| Comparison with Poisson distribution Blue bars denote a histogram of data divided into 1 sec bins. Red curve is a Poisson curve with rate = median count rate of data. |
 |
 |
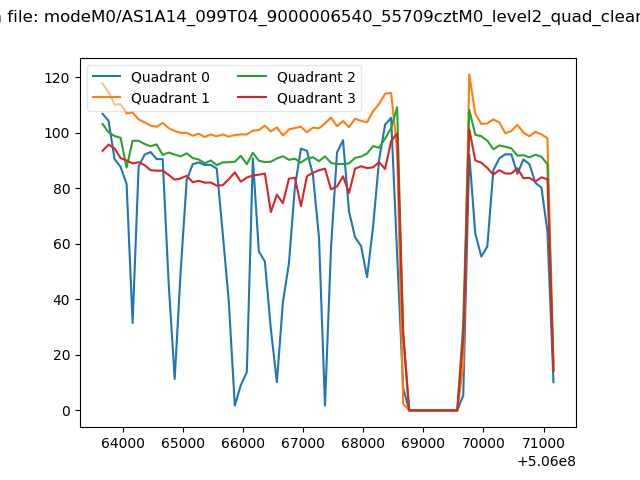
| Quadrant-wise count rates Data is divided into 100 sec bins |
 |
|
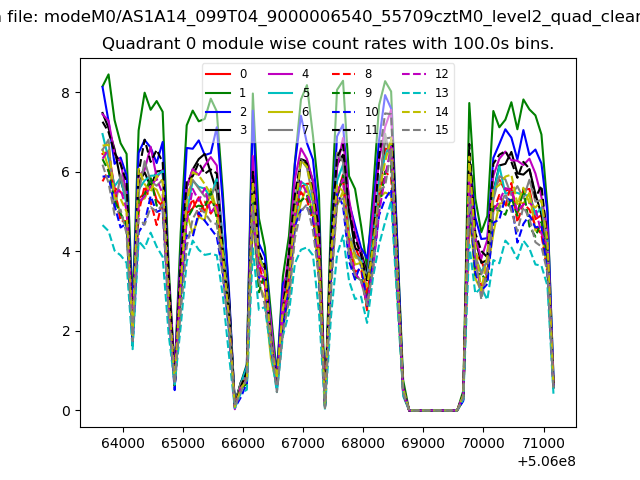
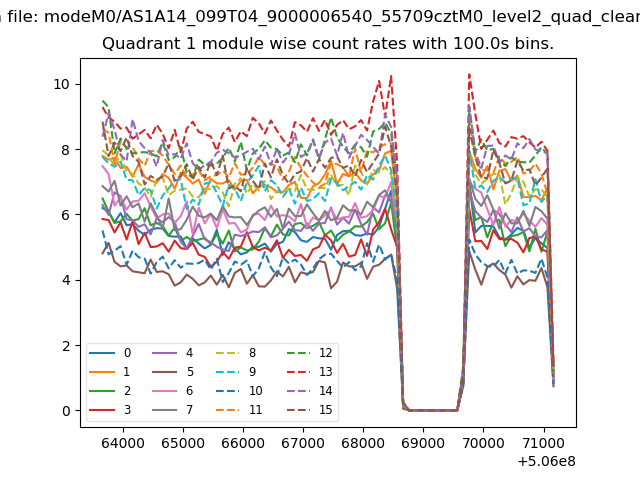
| Module-wise count rates for Quadrant A Data is divided into 100 sec bins |
 |
 |
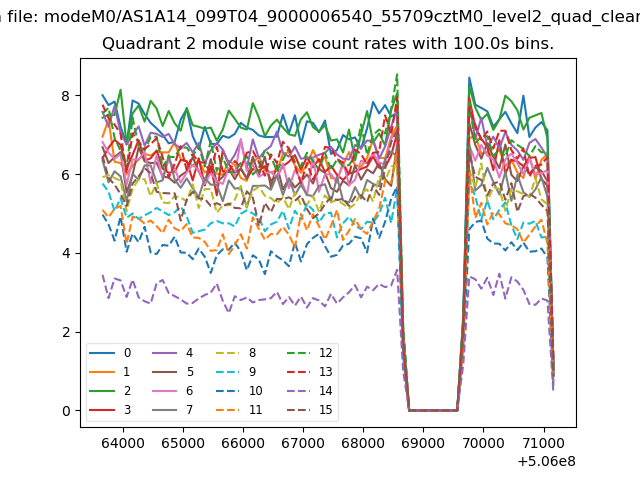
| Module-wise count rates for Quadrant B Data is divided into 100 sec bins |
 |
 |
| Module-wise count rates for Quadrant C Data is divided into 100 sec bins |
 |
 |
| Module-wise count rates for Quadrant D Data is divided into 100 sec bins |
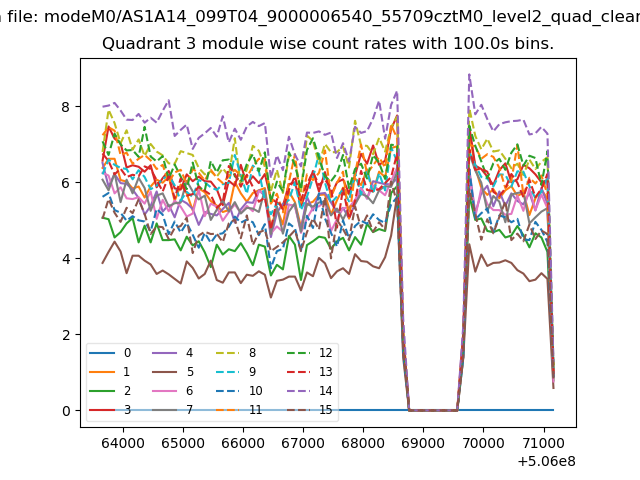 |
 |
| Parameter | Plot |
|---|---|
| CZT HV Monitor | 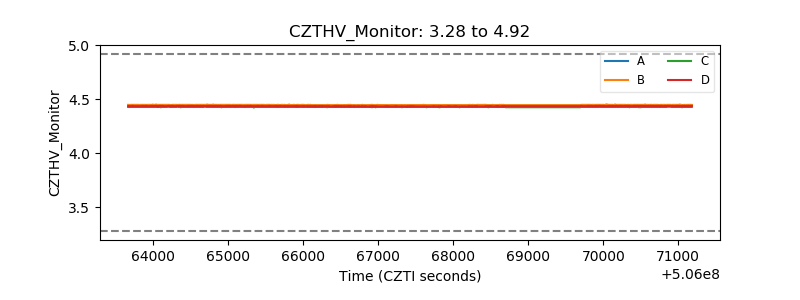 |
| D_VDD | 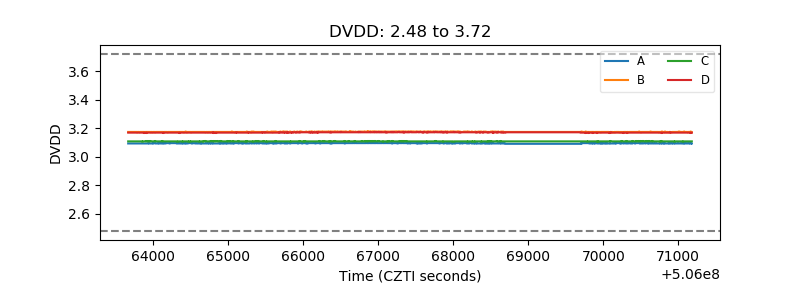 |
| Temperature 1 | 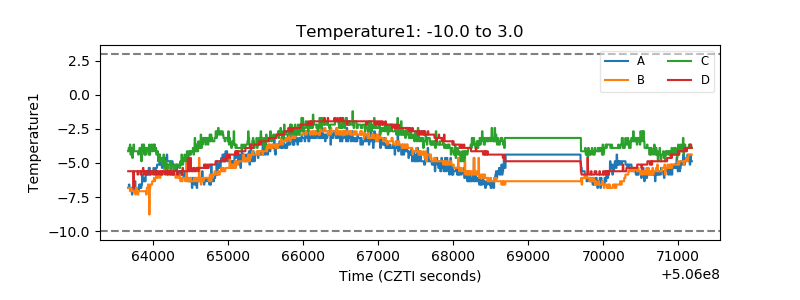 |
| Veto HV Monitor | 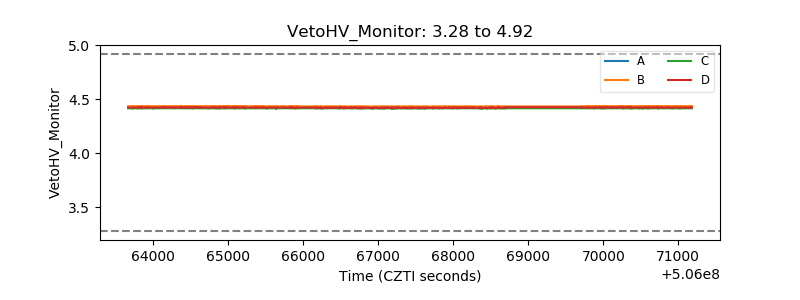 |
| Veto LLD | 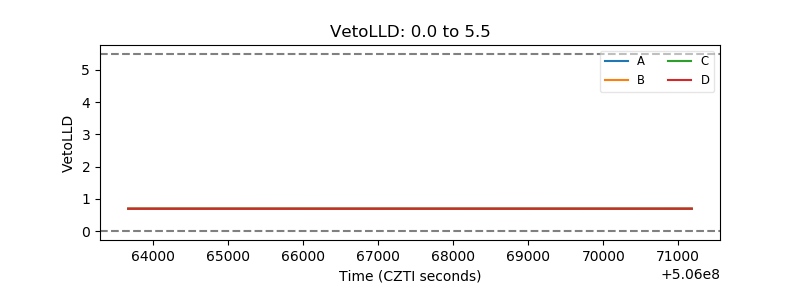 |
| Alpha Counter | 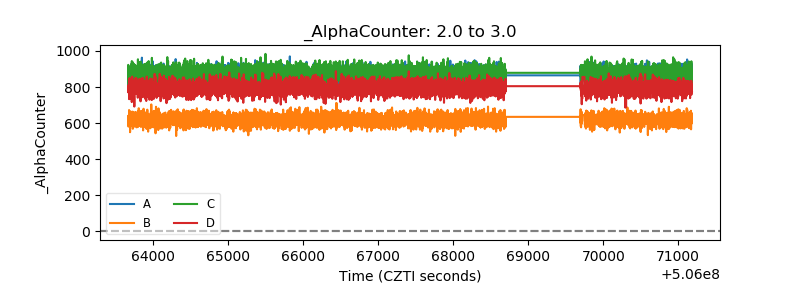 |
| _CPM_Rate | 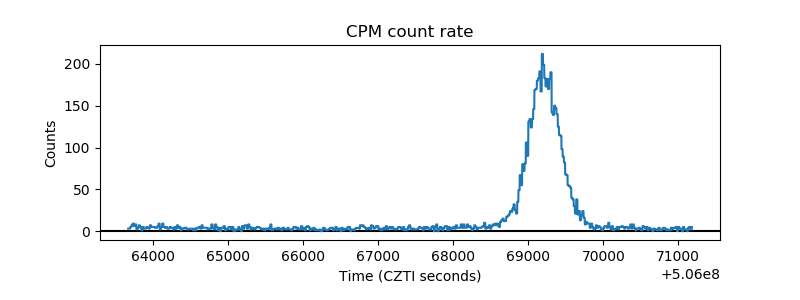 |
| CZT Counter | 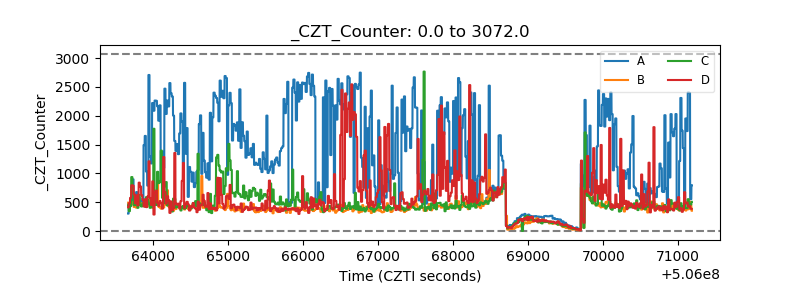 |
| +2.5 Volts monitor |  |
| +5 Volts monitor |  |
| _ROLL_ROT | 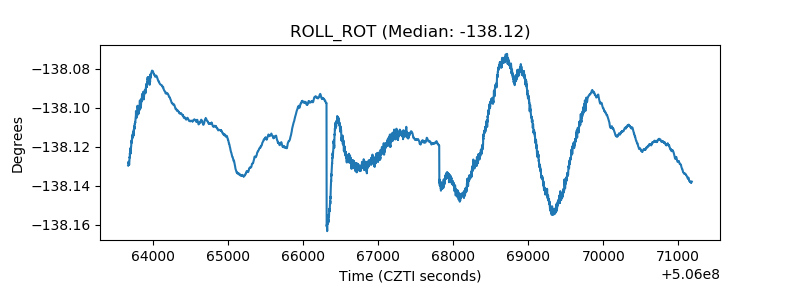 |
| _Roll_DEC | 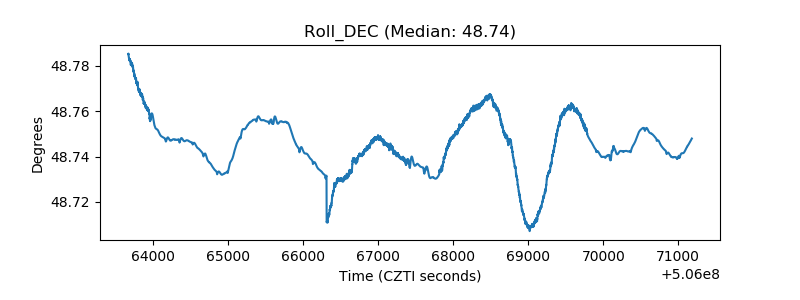 |
| _Roll_RA | 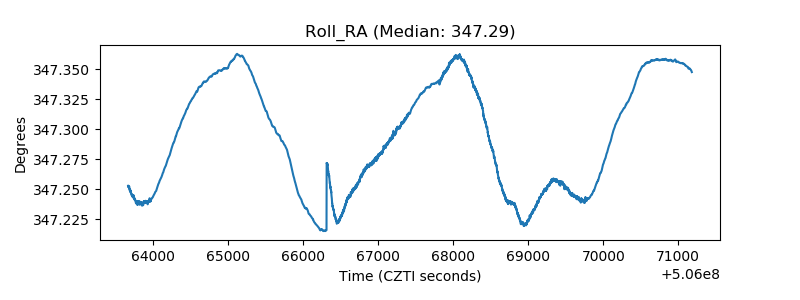 |
| Veto Counter | 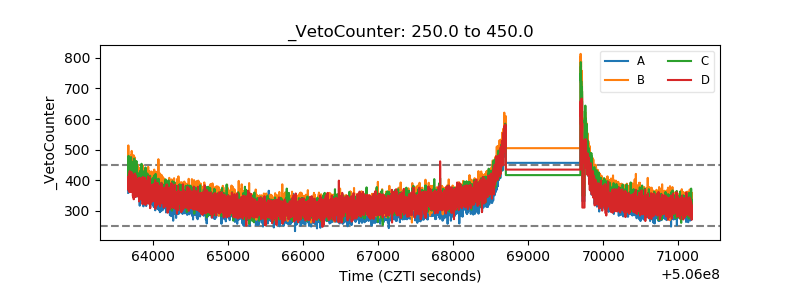 |