| Param | Original file | Final file |
|---|---|---|
| Filename | modeM0/AS1A14_099T04_9000006540_55711cztM0_level2.fits | modeM0/AS1A14_099T04_9000006540_55711cztM0_level2_quad_clean.evt |
| Size (bytes) | 636,523,200 | 93,012,480 |
| Size | 607.0 MB | 88.7 MB |
| Events in quadrant A | 8,699,312 | 488,526 |
| Events in quadrant B | 3,227,216 | 696,384 |
| Events in quadrant C | 4,130,035 | 636,130 |
| Events in quadrant D | 6,954,125 | 501,026 |
| Mode M0 | |||
|---|---|---|---|
| Quadrant | BADHDUFLAG | Total packets | Discarded packets |
| A | 0 | 30728 | 0 |
| B | 0 | 15013 | 0 |
| C | 0 | 17791 | 0 |
| D | 0 | 25650 | 0 |
| Mode SS | |||
|---|---|---|---|
| Quadrant | BADHDUFLAG | Total packets | Discarded packets |
| A | 0 | 142 | 0 |
| B | 0 | 142 | 0 |
| C | 0 | 142 | 0 |
| D | 0 | 142 | 0 |
| Quadrant | Total seconds | Saturated seconds | Saturation percentage |
|---|---|---|---|
| A | 7095 | 2074 | 29.231853% |
| B | 7096 | 260 | 3.664036% |
| C | 7096 | 242 | 3.410372% |
| D | 7096 | 1291 | 18.193348% |
Noise dominated data is calculated using 1-second bins in cleaned event files. If a bin has >2000 counts, and if more than 50% of those come from <1% of pixels, then it is considered to be noise-dominated and hence unusable.
| Quadrant | # 1 sec bins | Bins with >0 counts | Bins with >2000 counts | High rate bins dominated by noise | Noise dominated (total time) | Noise dominated (detector-on time) | Marked lightcurve |
|---|---|---|---|---|---|---|---|
| A | 7094 | 7094 | 1671 | 1671 | 23.56% | 23.56% | 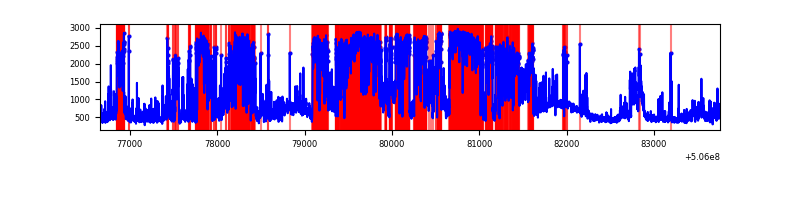 |
| B | 7095 | 7095 | 3 | 3 | 0.04% | 0.04% | 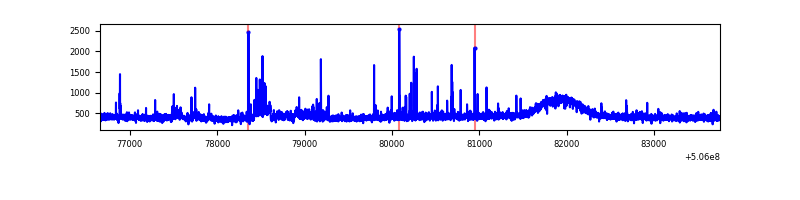 |
| C | 7095 | 7095 | 164 | 164 | 2.31% | 2.31% | 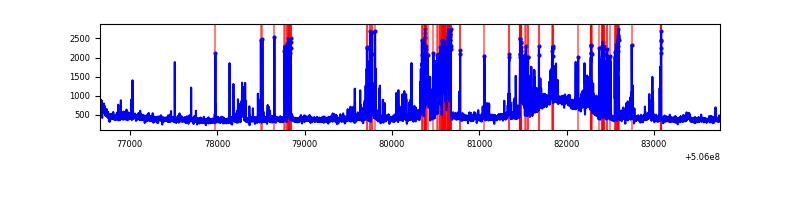 |
| D | 7095 | 7095 | 1102 | 1102 | 15.53% | 15.53% | 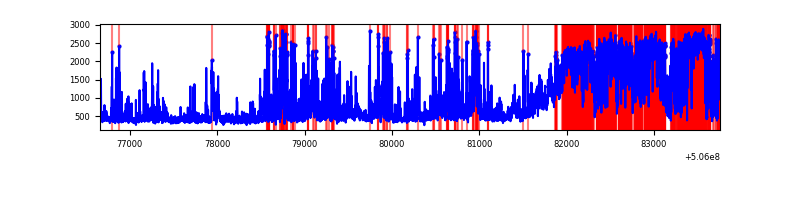 |
Top three noisy pixels from each quadrant. If the there are fewer than three noisy pixels in the level2.evt file, extra rows are filled as -1
| Pixel properties | Quadrant properties | ||||||
|---|---|---|---|---|---|---|---|
| Quadrant | DetID | PixID | Counts | Sigma | Mean | Median | Sigma |
| A | 15 | 32 | 5322310 | 32748.77 | 660 | 643 | 162.5 |
| A | 12 | 115 | 426565 | 2621.06 | 660 | 643 | 162.5 |
| A | 0 | 8 | 123395 | 755.4 | 660 | 643 | 162.5 |
| B | 7 | 0 | 83119 | 497.91 | 764 | 733 | 165.5 |
| B | 7 | 252 | 33047 | 195.29 | 764 | 733 | 165.5 |
| B | 0 | 173 | 24441 | 143.28 | 764 | 733 | 165.5 |
| C | 6 | 223 | 793784 | 3871.09 | 749 | 741 | 204.9 |
| C | 13 | 3 | 142103 | 690.03 | 749 | 741 | 204.9 |
| C | 14 | 96 | 97893 | 474.23 | 749 | 741 | 204.9 |
| D | 11 | 129 | 3313744 | 17236.7 | 678 | 647 | 192.2 |
| D | 10 | 181 | 447353 | 2324.03 | 678 | 647 | 192.2 |
| D | 8 | 245 | 373823 | 1941.48 | 678 | 647 | 192.2 |
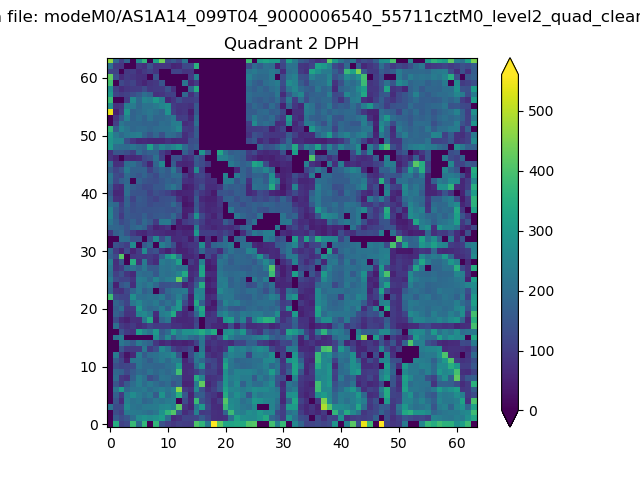
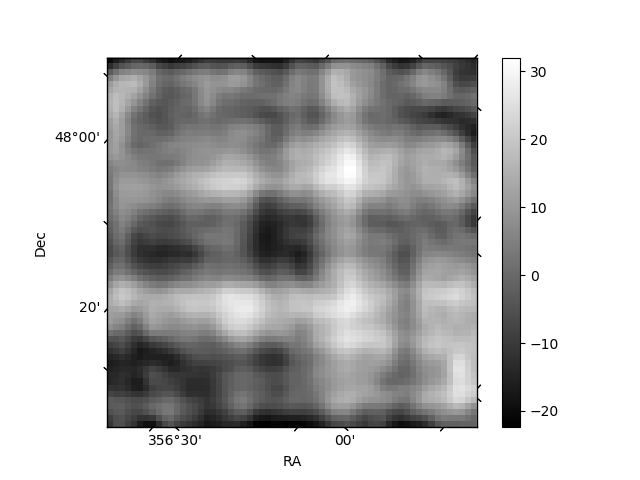
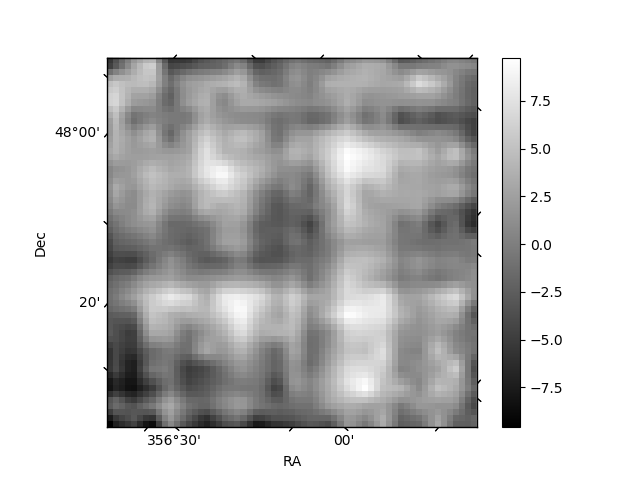
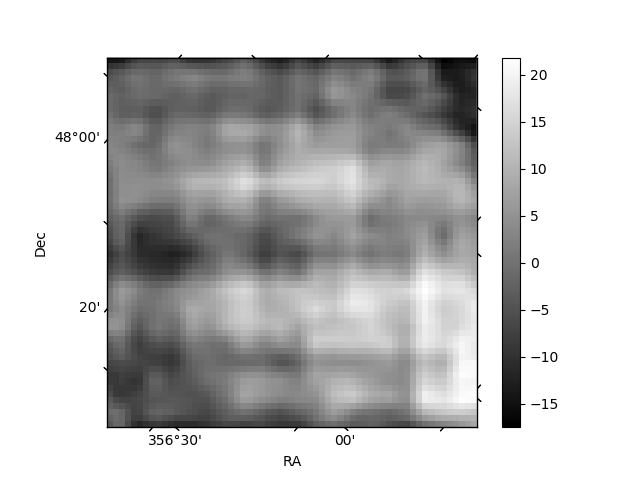
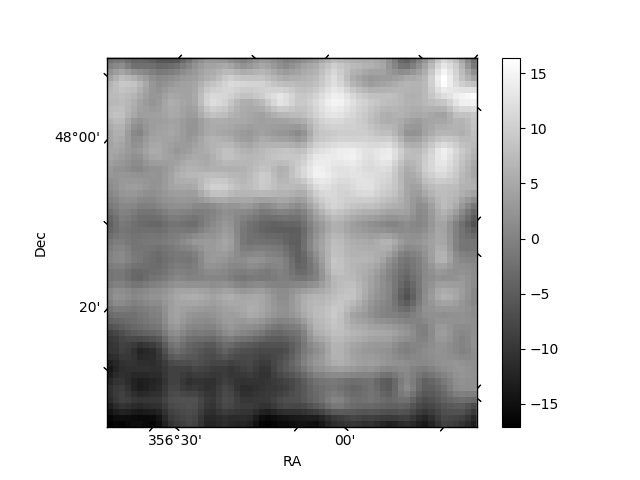
Histogram calculated using DETX and DETY for each event in the final _common_clean file
| Quadrant A | 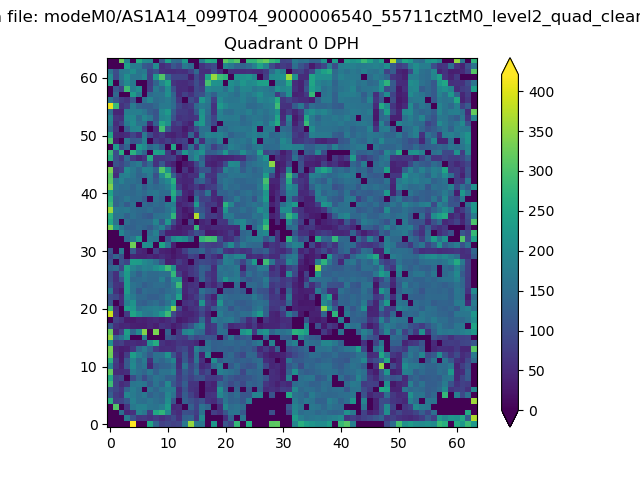 |
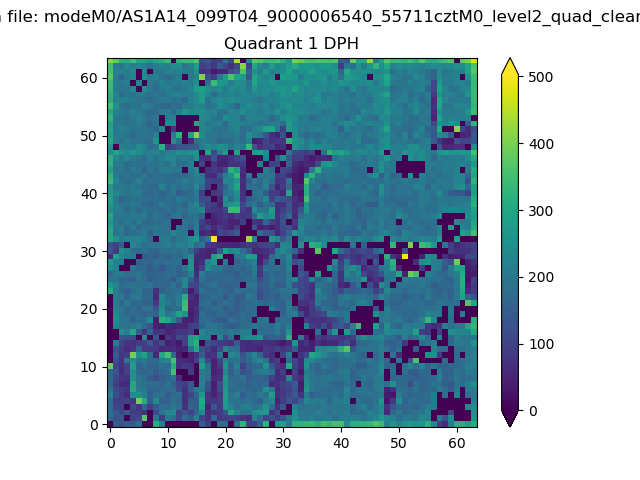 |
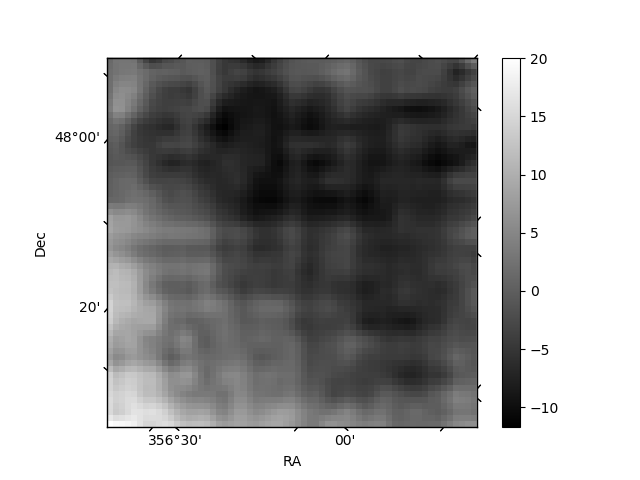
Quadrant B |
|---|---|---|---|
| Quadrant D | 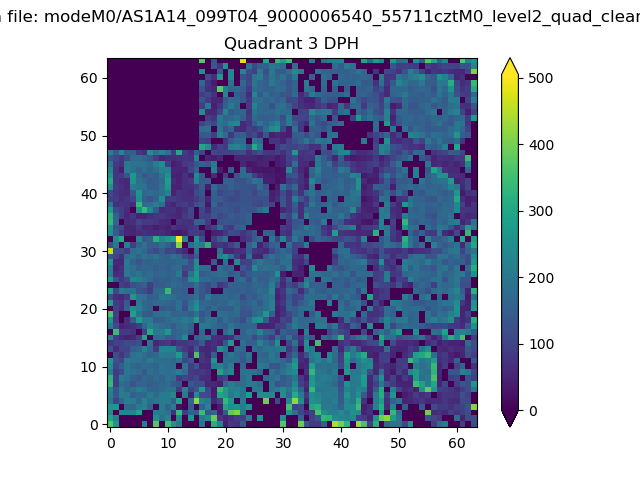 |
 |
Quadrant C |
| Plot type | Count rate plots | Images |
|---|---|---|
| Comparison with Poisson distribution Blue bars denote a histogram of data divided into 1 sec bins. Red curve is a Poisson curve with rate = median count rate of data. |
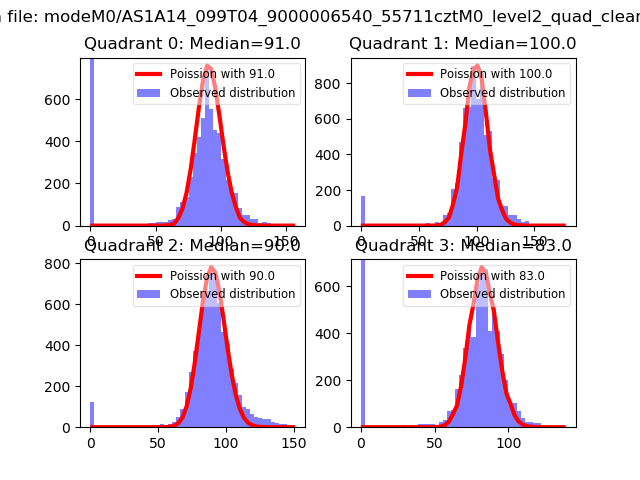 |
 |
| Quadrant-wise count rates Data is divided into 100 sec bins |
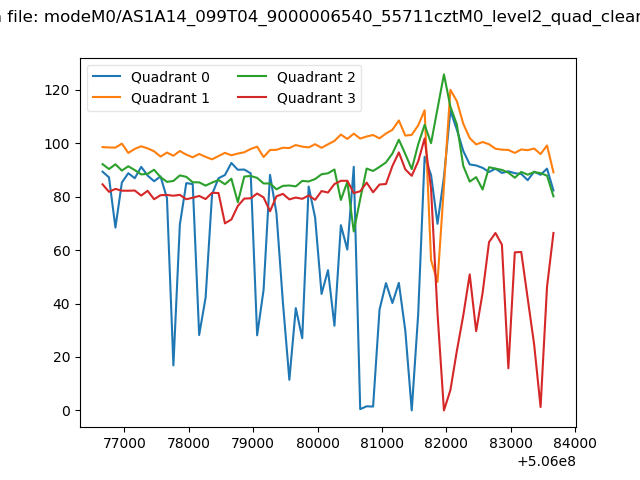 |
|
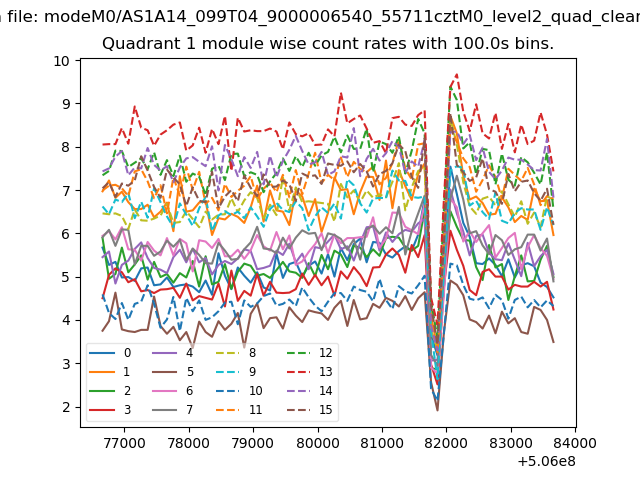
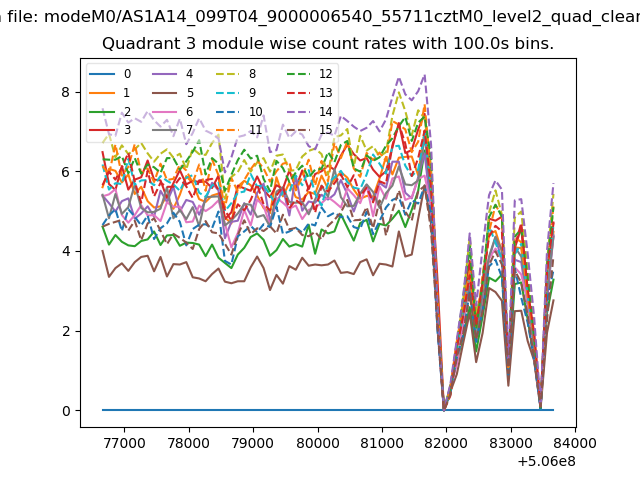
| Module-wise count rates for Quadrant A Data is divided into 100 sec bins |
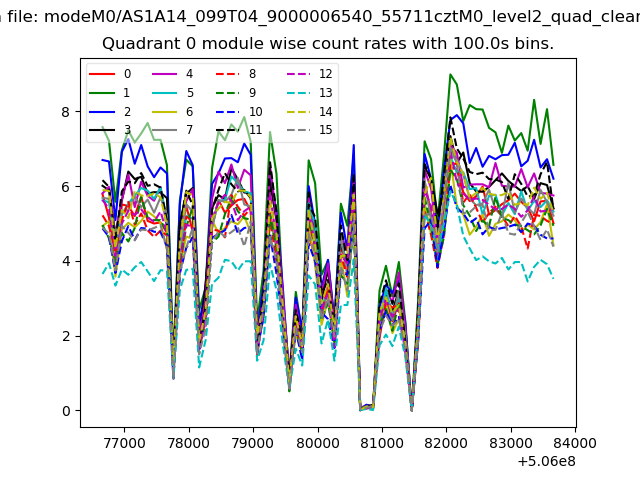 |
 |
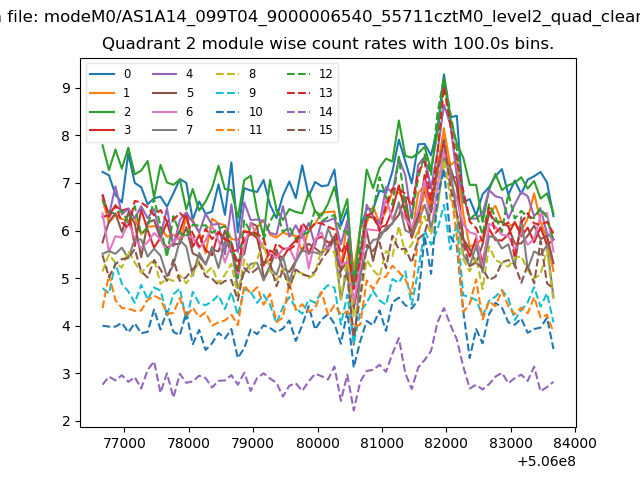
| Module-wise count rates for Quadrant B Data is divided into 100 sec bins |
 |
 |
| Module-wise count rates for Quadrant C Data is divided into 100 sec bins |
 |
 |
| Module-wise count rates for Quadrant D Data is divided into 100 sec bins |
 |
 |
| Parameter | Plot |
|---|---|
| CZT HV Monitor | 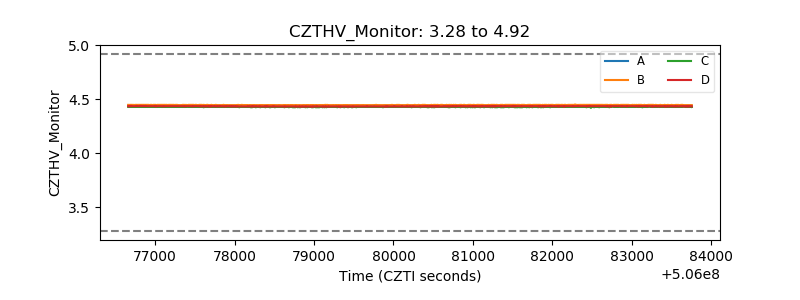 |
| D_VDD | 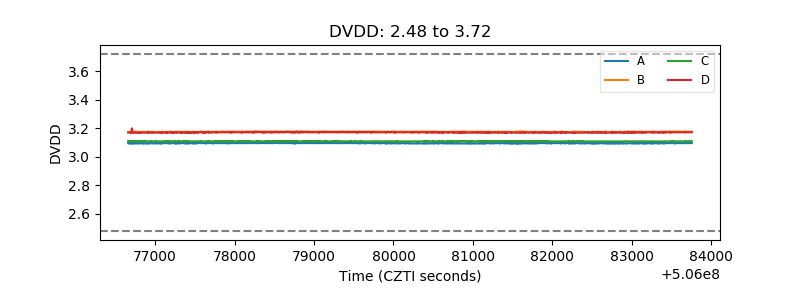 |
| Temperature 1 | 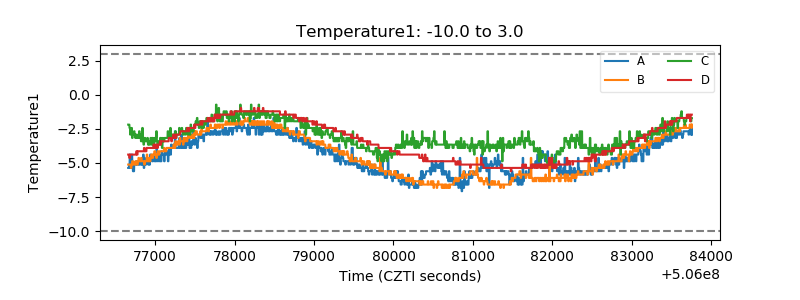 |
| Veto HV Monitor |  |
| Veto LLD | 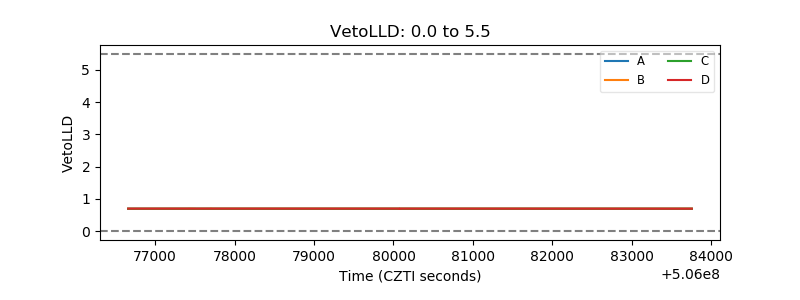 |
| Alpha Counter | 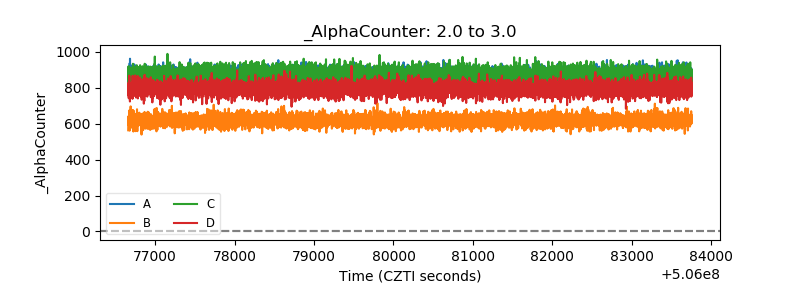 |
| _CPM_Rate | 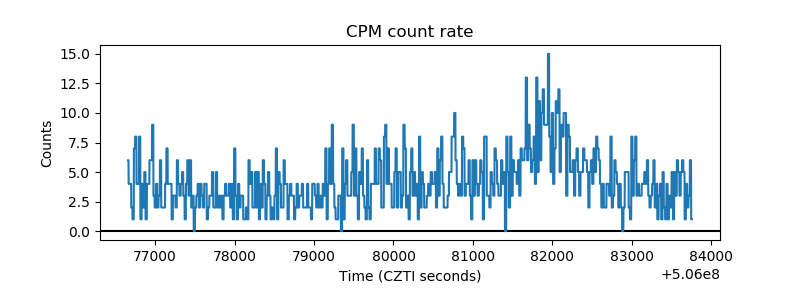 |
| CZT Counter | 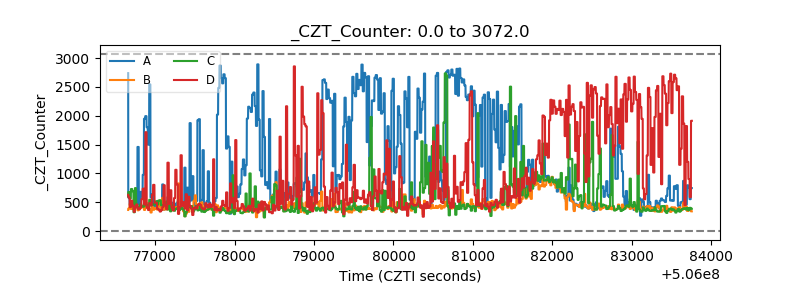 |
| +2.5 Volts monitor |  |
| +5 Volts monitor |  |
| _ROLL_ROT | 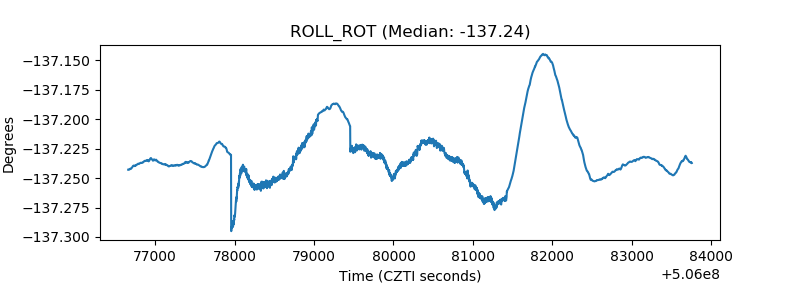 |
| _Roll_DEC | 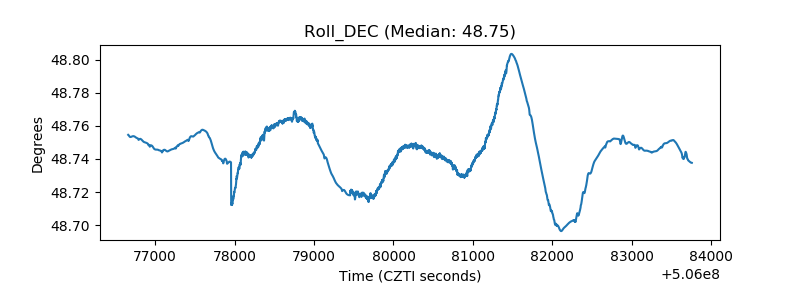 |
| _Roll_RA | 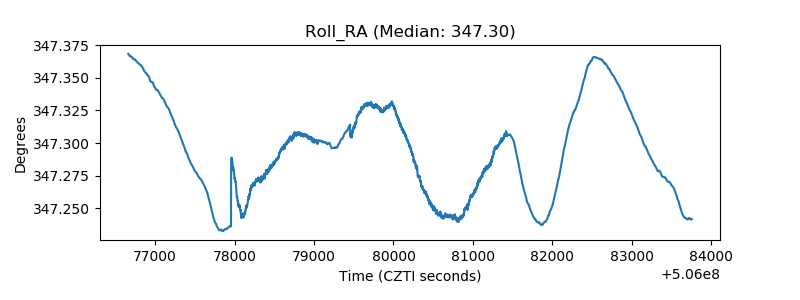 |
| Veto Counter | 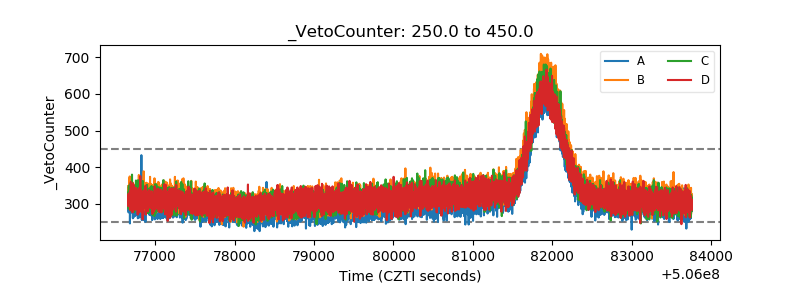 |