| Param | Original file | Final file |
|---|---|---|
| Filename | modeM0/AS1A14_099T04_9000006540_55712cztM0_level2.fits | modeM0/AS1A14_099T04_9000006540_55712cztM0_level2_quad_clean.evt |
| Size (bytes) | 665,173,440 | 102,444,480 |
| Size | 634.4 MB | 97.7 MB |
| Events in quadrant A | 6,806,195 | 657,907 |
| Events in quadrant B | 3,254,512 | 760,700 |
| Events in quadrant C | 4,770,269 | 650,481 |
| Events in quadrant D | 9,196,354 | 498,897 |
| Mode M0 | |||
|---|---|---|---|
| Quadrant | BADHDUFLAG | Total packets | Discarded packets |
| A | 0 | 25562 | 0 |
| B | 0 | 15772 | 0 |
| C | 0 | 20078 | 0 |
| D | 0 | 32687 | 0 |
| Mode SS | |||
|---|---|---|---|
| Quadrant | BADHDUFLAG | Total packets | Discarded packets |
| A | 0 | 154 | 0 |
| B | 0 | 154 | 0 |
| C | 0 | 154 | 0 |
| D | 0 | 154 | 0 |
| Quadrant | Total seconds | Saturated seconds | Saturation percentage |
|---|---|---|---|
| A | 7669 | 670 | 8.736472% |
| B | 7670 | 16 | 0.208605% |
| C | 7670 | 507 | 6.610169% |
| D | 7670 | 1878 | 24.485007% |
Noise dominated data is calculated using 1-second bins in cleaned event files. If a bin has >2000 counts, and if more than 50% of those come from <1% of pixels, then it is considered to be noise-dominated and hence unusable.
| Quadrant | # 1 sec bins | Bins with >0 counts | Bins with >2000 counts | High rate bins dominated by noise | Noise dominated (total time) | Noise dominated (detector-on time) | Marked lightcurve |
|---|---|---|---|---|---|---|---|
| A | 7668 | 7668 | 644 | 644 | 8.40% | 8.40% | 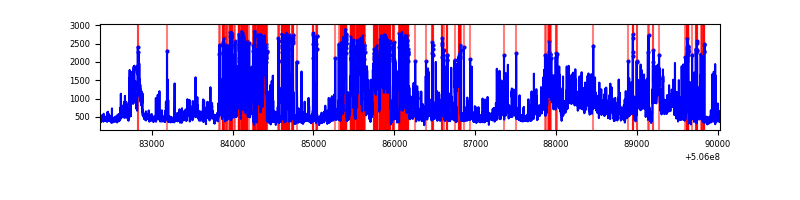 |
| B | 7669 | 7669 | 2 | 2 | 0.03% | 0.03% | 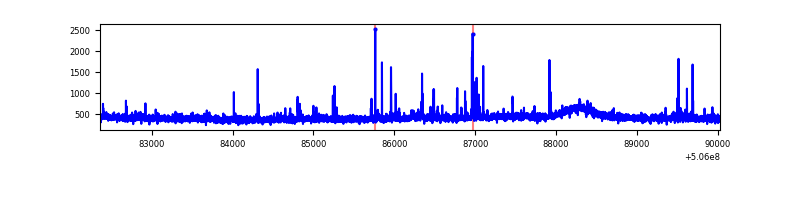 |
| C | 7669 | 7669 | 513 | 513 | 6.69% | 6.69% | 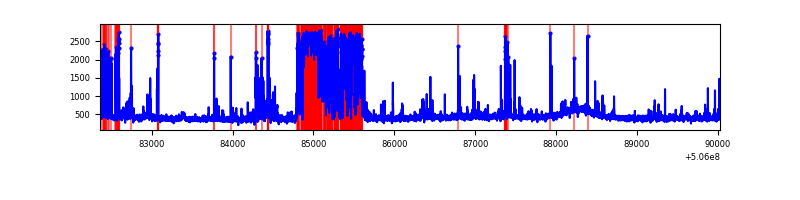 |
| D | 7669 | 7669 | 1874 | 1874 | 24.44% | 24.44% | 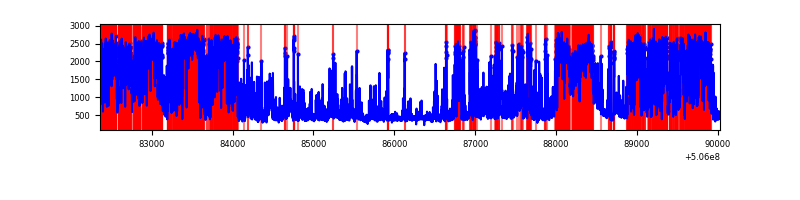 |
Top three noisy pixels from each quadrant. If the there are fewer than three noisy pixels in the level2.evt file, extra rows are filled as -1
| Pixel properties | Quadrant properties | ||||||
|---|---|---|---|---|---|---|---|
| Quadrant | DetID | PixID | Counts | Sigma | Mean | Median | Sigma |
| A | 15 | 32 | 2647085 | 13860.06 | 772 | 753 | 190.9 |
| A | 0 | 8 | 517574 | 2706.83 | 772 | 753 | 190.9 |
| A | 12 | 115 | 264351 | 1380.58 | 772 | 753 | 190.9 |
| B | 5 | 236 | 33992 | 195.33 | 790 | 760 | 170.1 |
| B | 2 | 249 | 23496 | 133.64 | 790 | 760 | 170.1 |
| B | 12 | 111 | 21041 | 119.21 | 790 | 760 | 170.1 |
| C | 6 | 223 | 1513787 | 7328.47 | 755 | 745 | 206.5 |
| C | 13 | 3 | 182820 | 881.89 | 755 | 745 | 206.5 |
| C | 12 | 252 | 63142 | 302.22 | 755 | 745 | 206.5 |
| D | 11 | 129 | 5664271 | 29052.91 | 692 | 663 | 194.9 |
| D | 8 | 245 | 607911 | 3115.03 | 692 | 663 | 194.9 |
| D | 10 | 181 | 66120 | 335.78 | 692 | 663 | 194.9 |
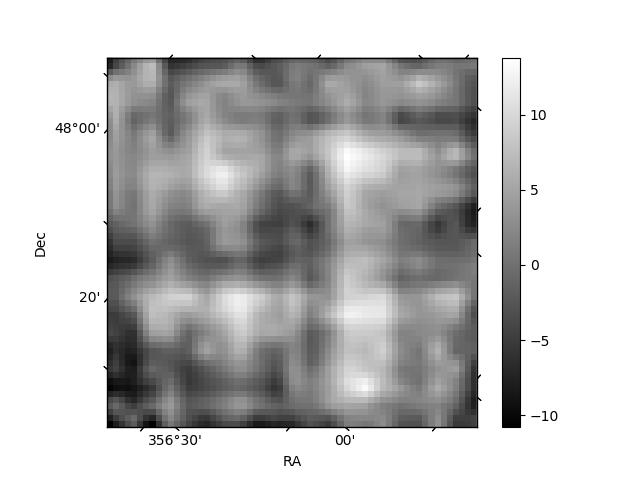
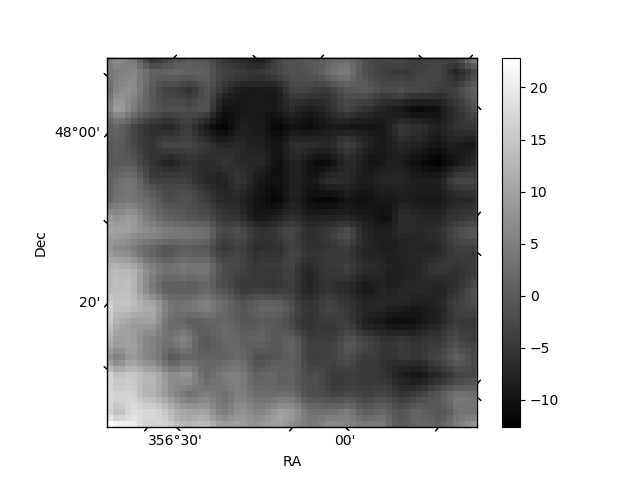
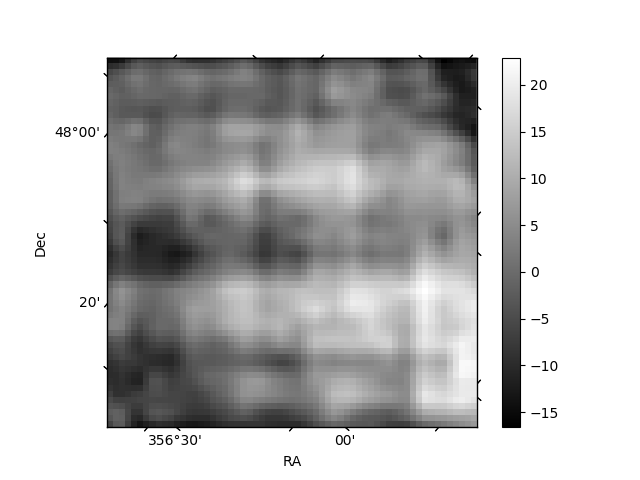
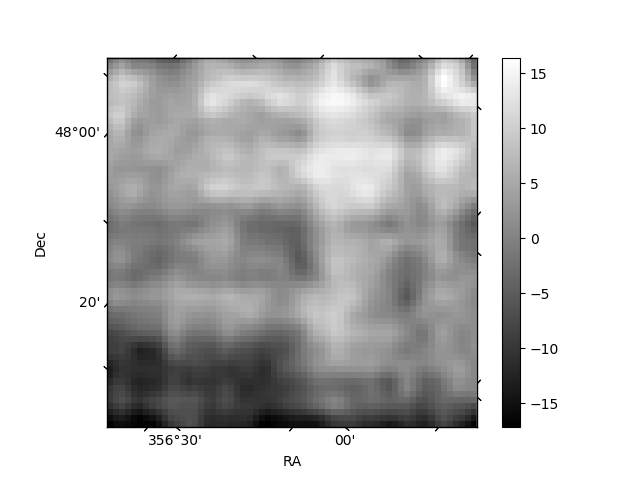
Histogram calculated using DETX and DETY for each event in the final _common_clean file
| Quadrant A | 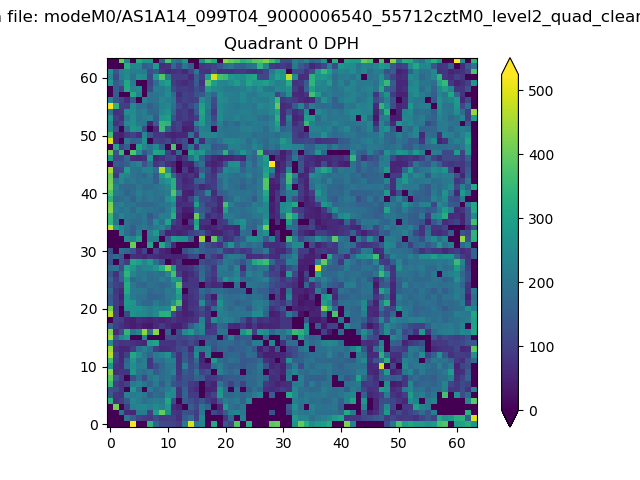 |
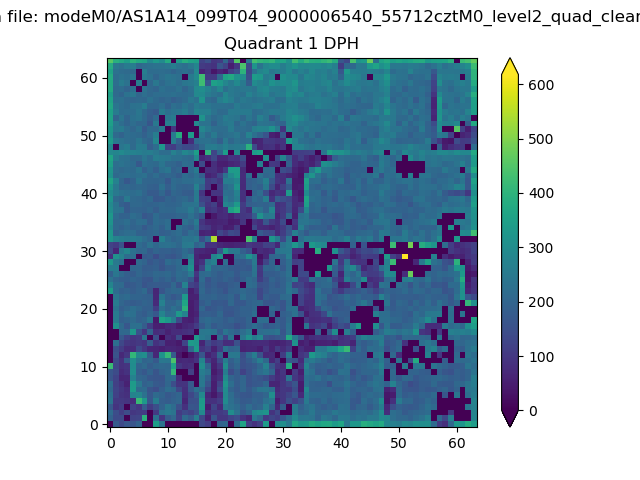 |
Quadrant B |
|---|---|---|---|
| Quadrant D | 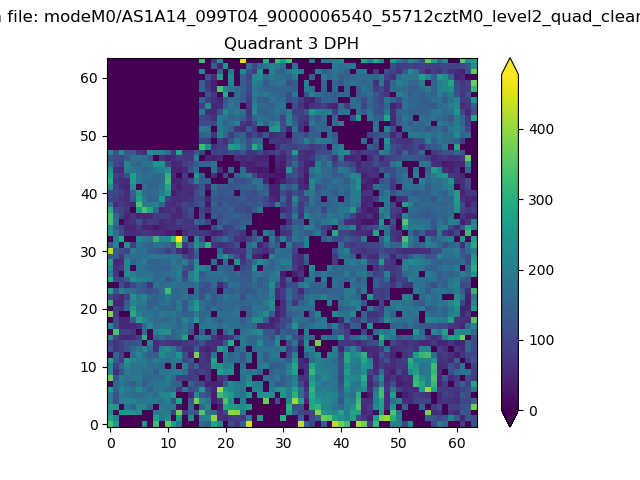 |
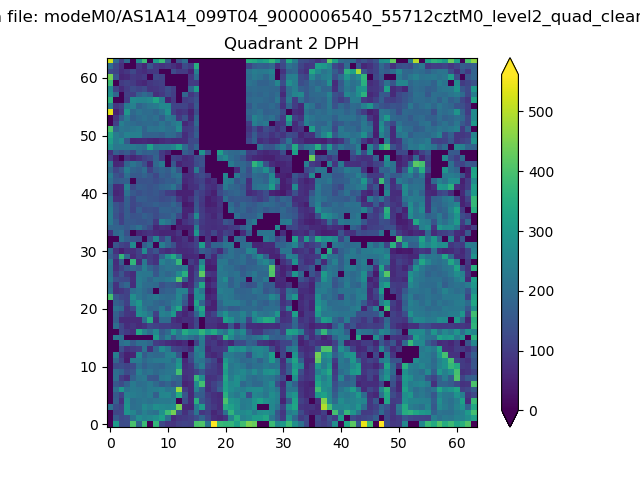 |
Quadrant C |
| Plot type | Count rate plots | Images |
|---|---|---|
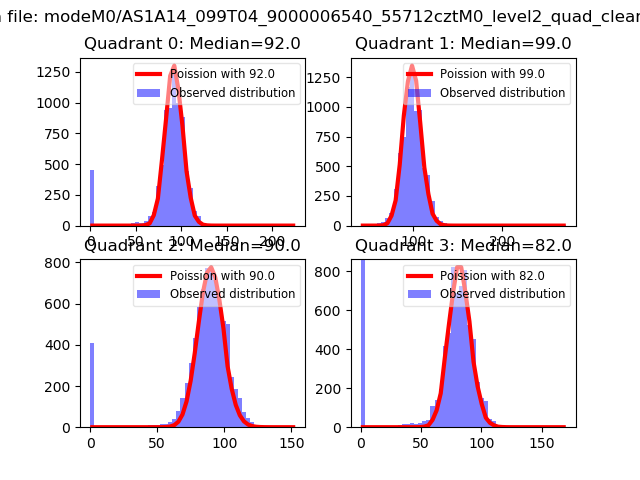
| Comparison with Poisson distribution Blue bars denote a histogram of data divided into 1 sec bins. Red curve is a Poisson curve with rate = median count rate of data. |
 |
 |
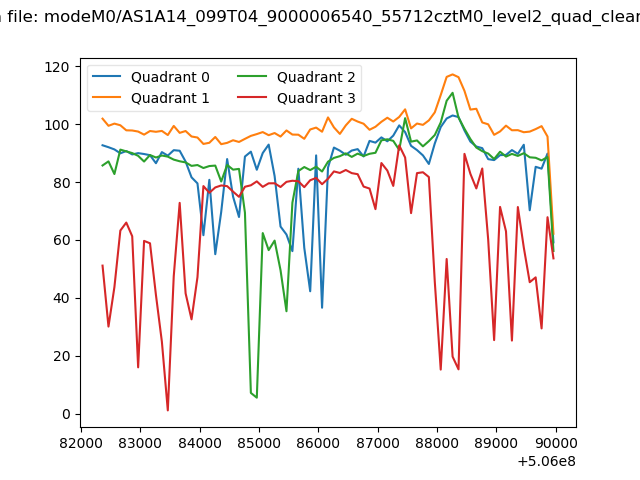
| Quadrant-wise count rates Data is divided into 100 sec bins |
 |
|
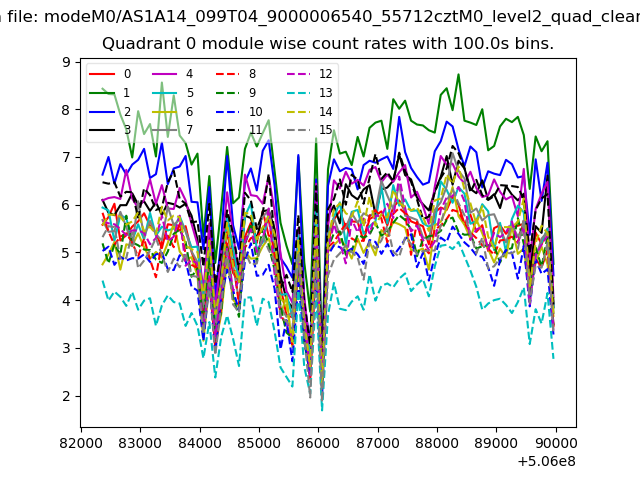
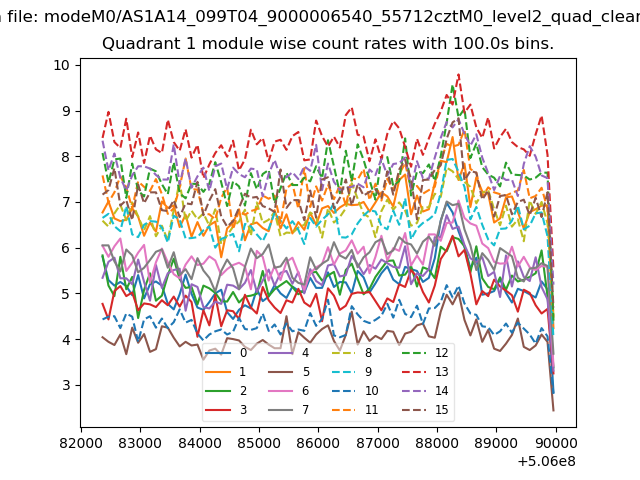
| Module-wise count rates for Quadrant A Data is divided into 100 sec bins |
 |
 |
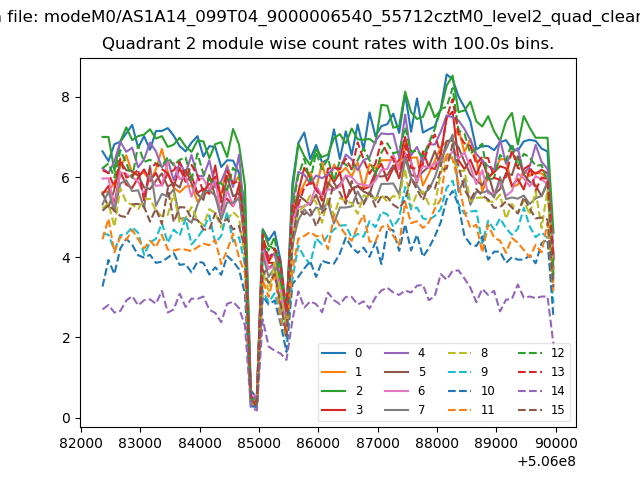
| Module-wise count rates for Quadrant B Data is divided into 100 sec bins |
 |
 |
| Module-wise count rates for Quadrant C Data is divided into 100 sec bins |
 |
 |
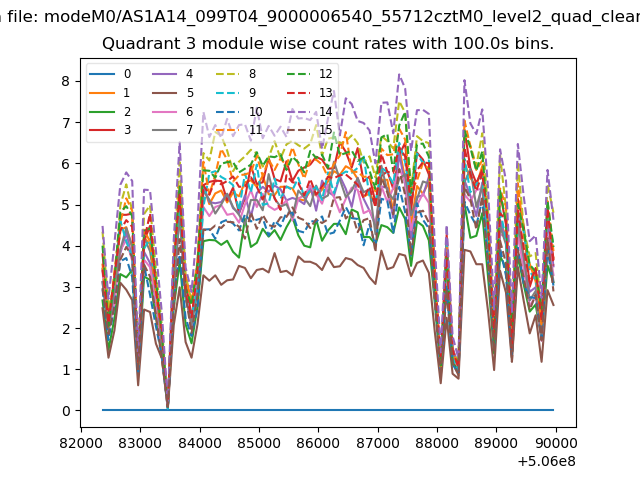
| Module-wise count rates for Quadrant D Data is divided into 100 sec bins |
 |
 |
| Parameter | Plot |
|---|---|
| CZT HV Monitor | 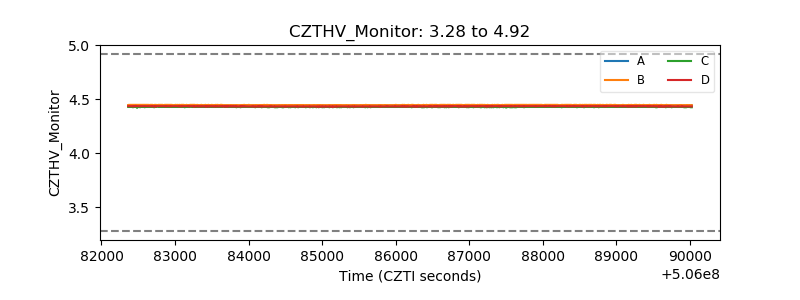 |
| D_VDD | 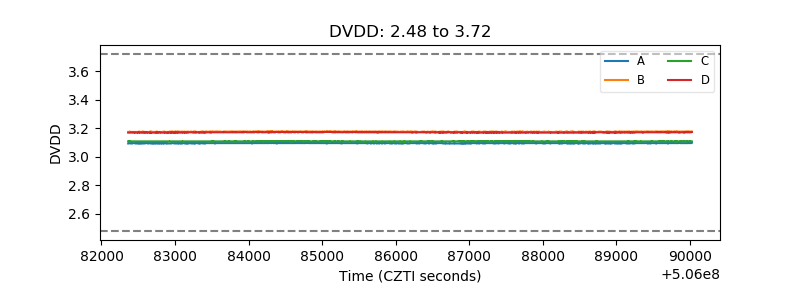 |
| Temperature 1 | 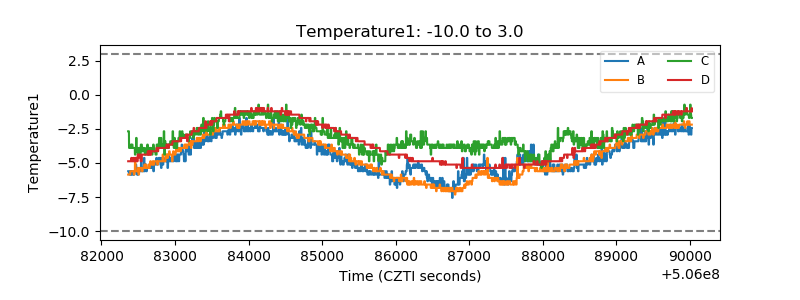 |
| Veto HV Monitor | 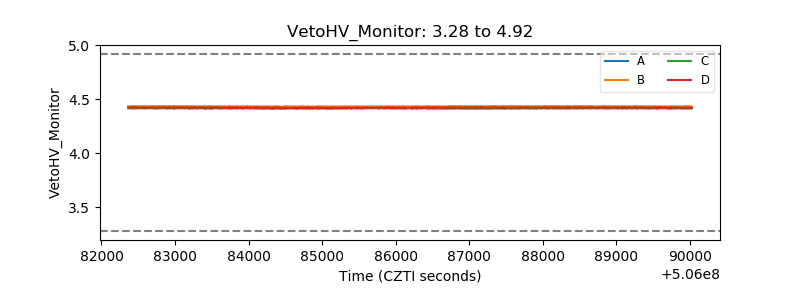 |
| Veto LLD | 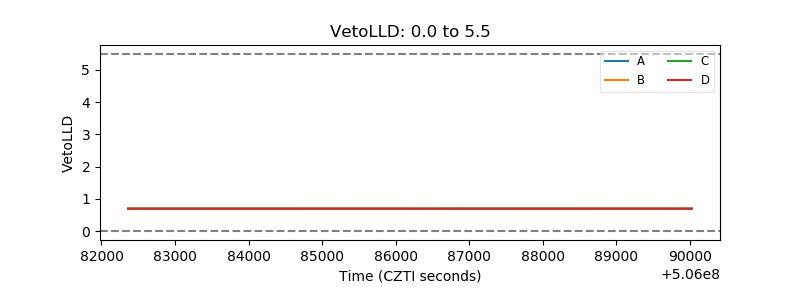 |
| Alpha Counter | 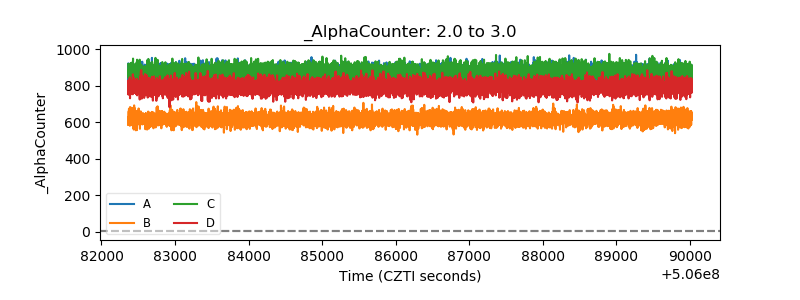 |
| _CPM_Rate | 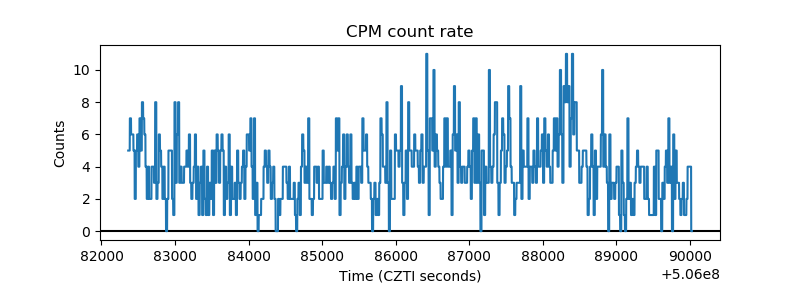 |
| CZT Counter | 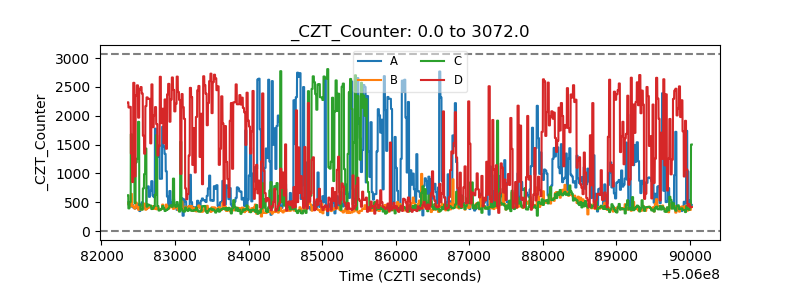 |
| +2.5 Volts monitor |  |
| +5 Volts monitor |  |
| _ROLL_ROT | 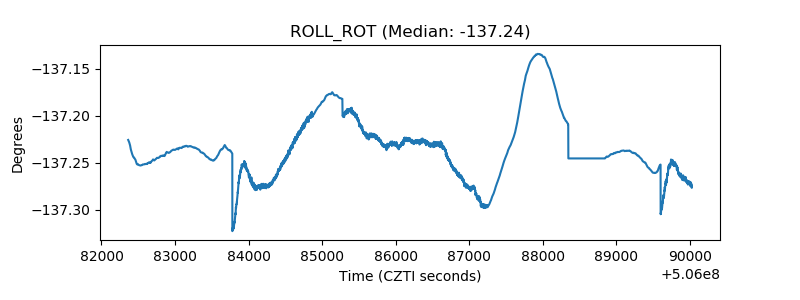 |
| _Roll_DEC | 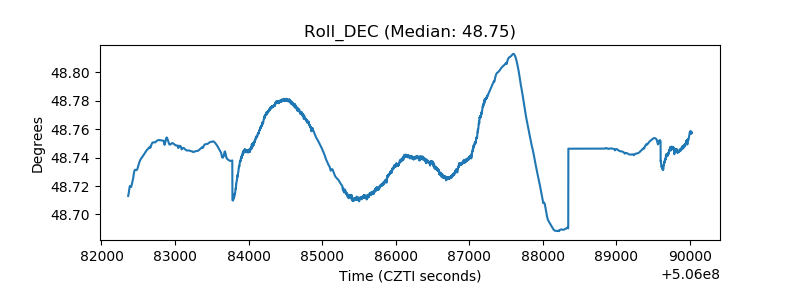 |
| _Roll_RA | 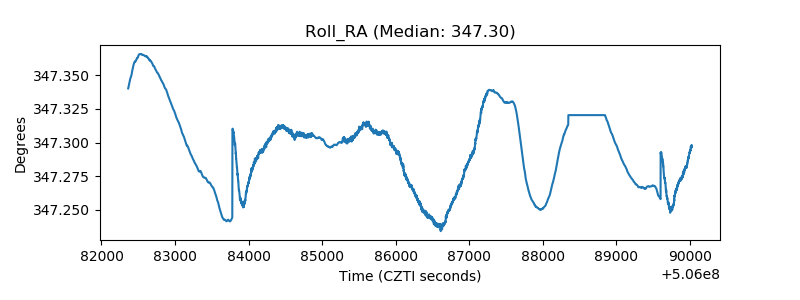 |
| Veto Counter | 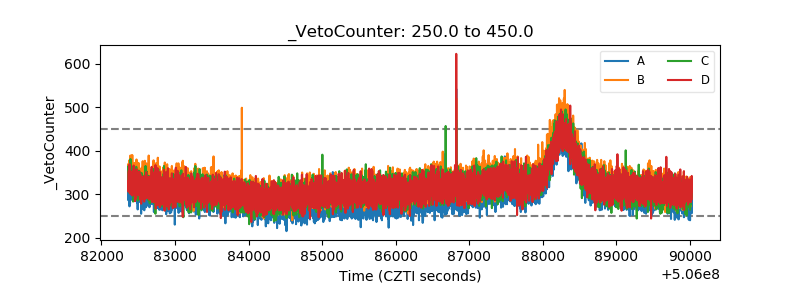 |