| Param | Original file | Final file |
|---|---|---|
| Filename | modeM0/AS1A14_099T04_9000006540_55713cztM0_level2.fits | modeM0/AS1A14_099T04_9000006540_55713cztM0_level2_quad_clean.evt |
| Size (bytes) | 673,122,240 | 99,699,840 |
| Size | 641.9 MB | 95.1 MB |
| Events in quadrant A | 9,500,392 | 543,813 |
| Events in quadrant B | 3,173,280 | 747,183 |
| Events in quadrant C | 3,577,629 | 668,784 |
| Events in quadrant D | 8,082,259 | 535,618 |
| Mode M0 | |||
|---|---|---|---|
| Quadrant | BADHDUFLAG | Total packets | Discarded packets |
| A | 0 | 33462 | 0 |
| B | 0 | 15430 | 0 |
| C | 0 | 16524 | 0 |
| D | 0 | 29181 | 0 |
| Mode SS | |||
|---|---|---|---|
| Quadrant | BADHDUFLAG | Total packets | Discarded packets |
| A | 0 | 150 | 0 |
| B | 0 | 150 | 0 |
| C | 0 | 150 | 0 |
| D | 0 | 150 | 0 |
| Quadrant | Total seconds | Saturated seconds | Saturation percentage |
|---|---|---|---|
| A | 7519 | 1863 | 24.777231% |
| B | 7520 | 11 | 0.146277% |
| C | 7520 | 70 | 0.930851% |
| D | 7520 | 1336 | 17.765957% |
Noise dominated data is calculated using 1-second bins in cleaned event files. If a bin has >2000 counts, and if more than 50% of those come from <1% of pixels, then it is considered to be noise-dominated and hence unusable.
| Quadrant | # 1 sec bins | Bins with >0 counts | Bins with >2000 counts | High rate bins dominated by noise | Noise dominated (total time) | Noise dominated (detector-on time) | Marked lightcurve |
|---|---|---|---|---|---|---|---|
| A | 7519 | 7519 | 1742 | 1742 | 23.17% | 23.17% | 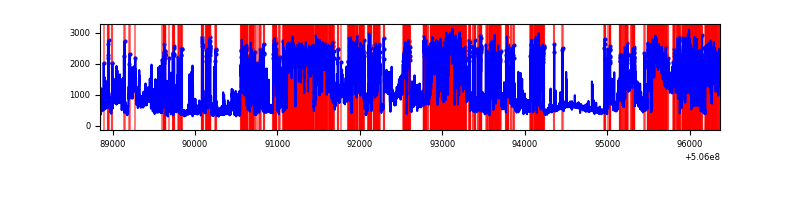 |
| B | 7520 | 7520 | 4 | 4 | 0.05% | 0.05% | 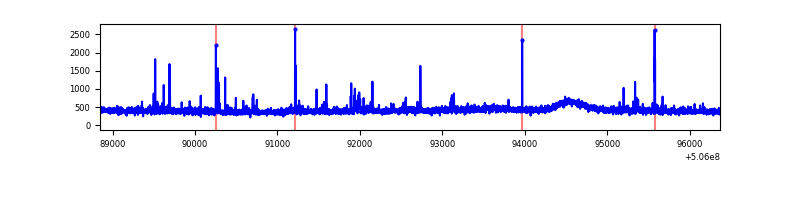 |
| C | 7520 | 7520 | 85 | 85 | 1.13% | 1.13% | 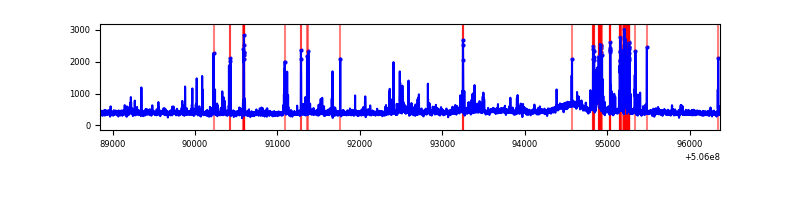 |
| D | 7519 | 7519 | 1367 | 1367 | 18.18% | 18.18% | 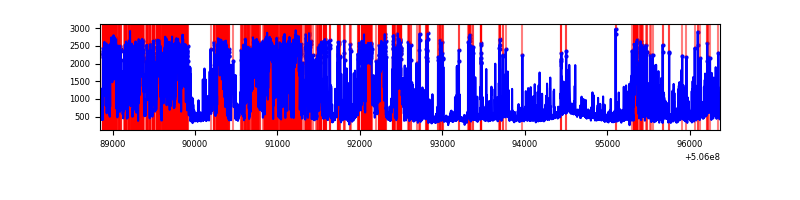 |
Top three noisy pixels from each quadrant. If the there are fewer than three noisy pixels in the level2.evt file, extra rows are filled as -1
| Pixel properties | Quadrant properties | ||||||
|---|---|---|---|---|---|---|---|
| Quadrant | DetID | PixID | Counts | Sigma | Mean | Median | Sigma |
| A | 15 | 32 | 5758673 | 33027.18 | 703 | 685 | 174.3 |
| A | 0 | 8 | 520998 | 2984.46 | 703 | 685 | 174.3 |
| A | 8 | 249 | 261175 | 1494.14 | 703 | 685 | 174.3 |
| B | 9 | 251 | 31243 | 182.52 | 773 | 745 | 167.1 |
| B | 0 | 173 | 27259 | 158.68 | 773 | 745 | 167.1 |
| B | 10 | 247 | 20544 | 118.49 | 773 | 745 | 167.1 |
| C | 13 | 3 | 389757 | 1842.56 | 762 | 752 | 211.1 |
| C | 6 | 223 | 99487 | 467.67 | 762 | 752 | 211.1 |
| C | 12 | 252 | 37056 | 171.96 | 762 | 752 | 211.1 |
| D | 11 | 129 | 4636831 | 23057.6 | 708 | 676 | 201.1 |
| D | 10 | 181 | 355677 | 1765.57 | 708 | 676 | 201.1 |
| D | 2 | 31 | 101668 | 502.27 | 708 | 676 | 201.1 |
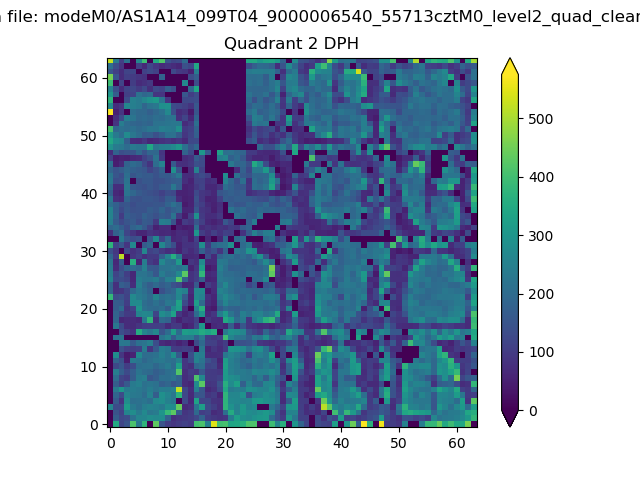
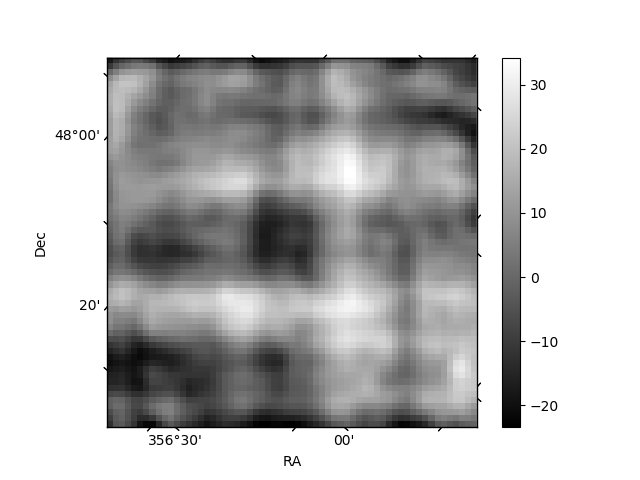
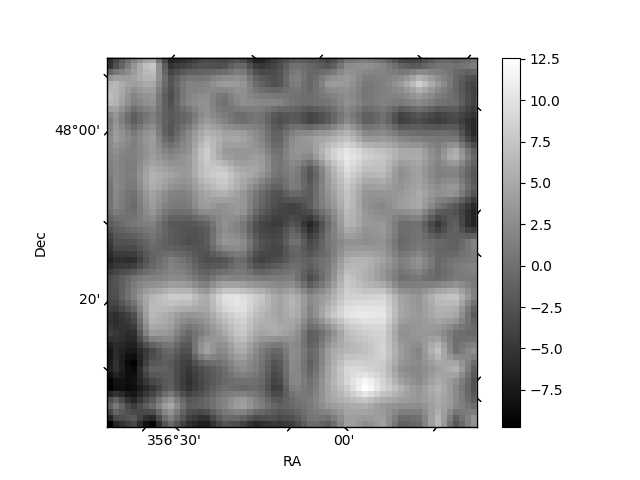
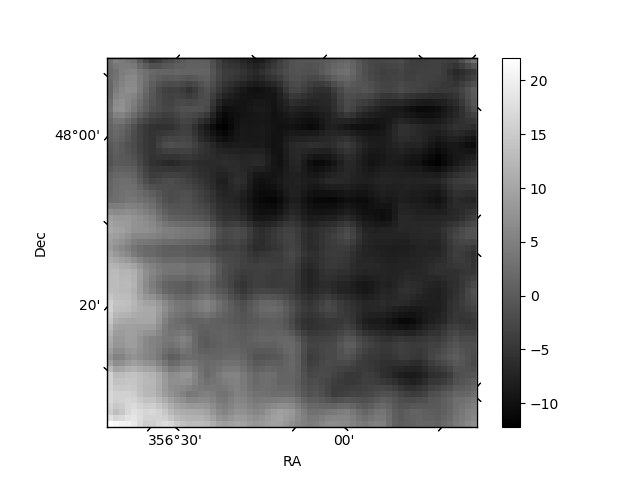
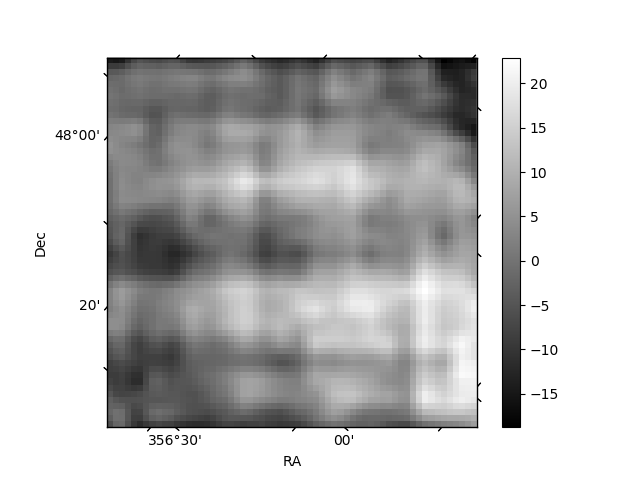
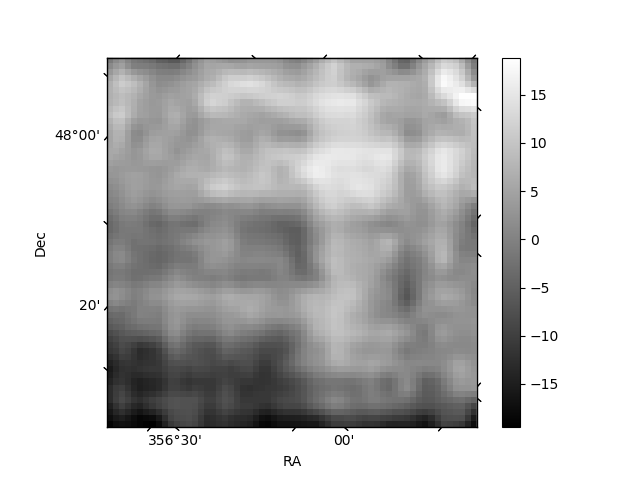
Histogram calculated using DETX and DETY for each event in the final _common_clean file
| Quadrant A | 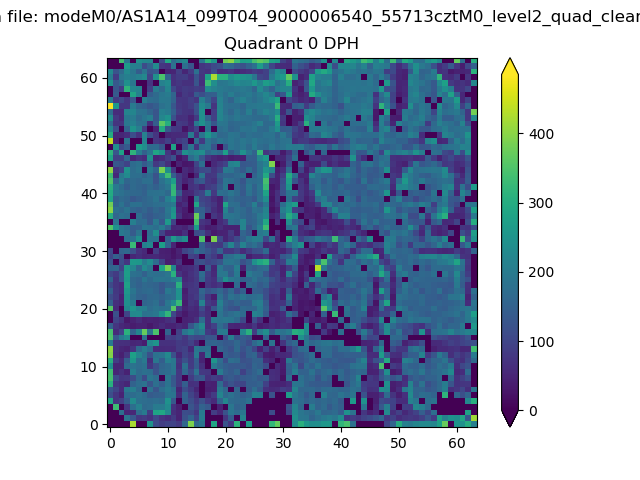 |
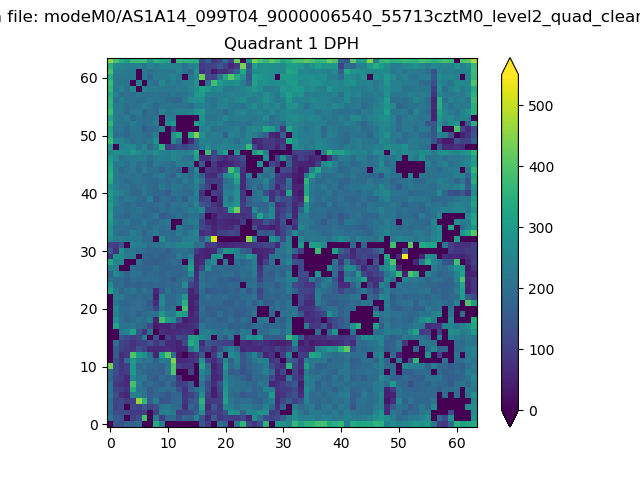 |
Quadrant B |
|---|---|---|---|
| Quadrant D | 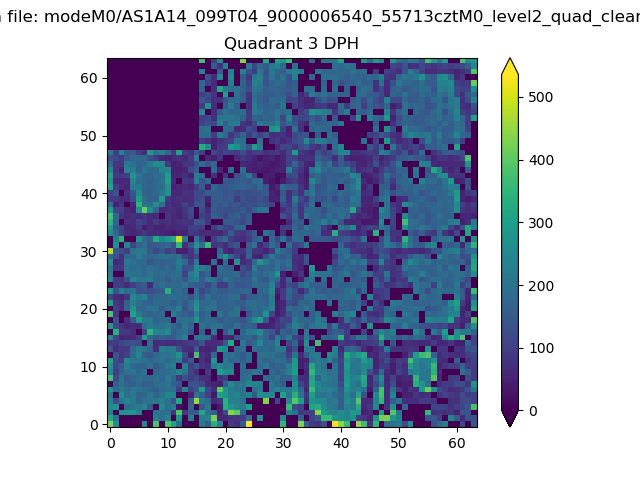 |
 |
Quadrant C |
| Plot type | Count rate plots | Images |
|---|---|---|
| Comparison with Poisson distribution Blue bars denote a histogram of data divided into 1 sec bins. Red curve is a Poisson curve with rate = median count rate of data. |
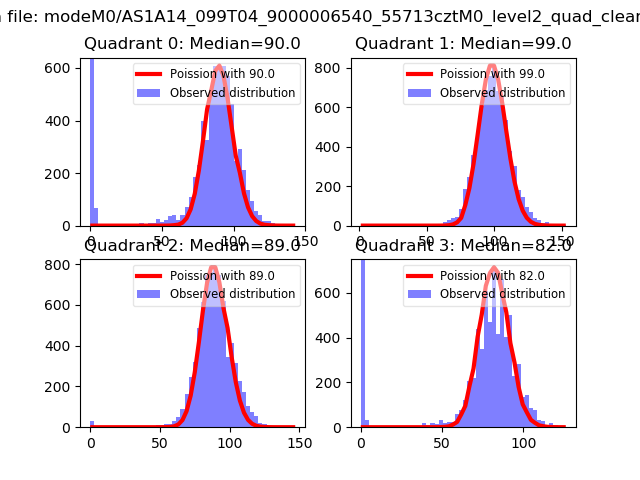 |
 |
| Quadrant-wise count rates Data is divided into 100 sec bins |
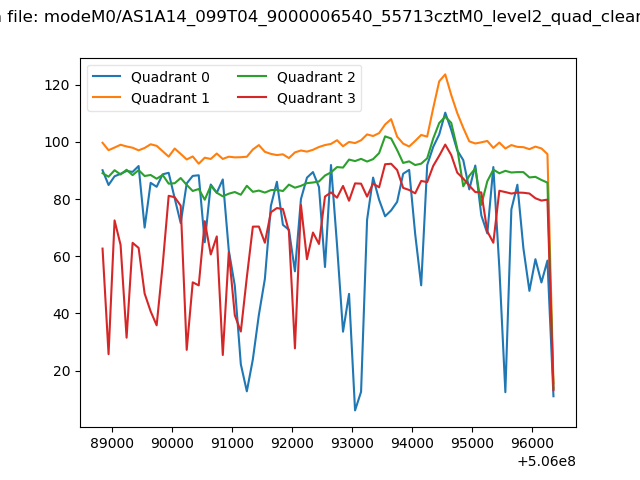 |
|
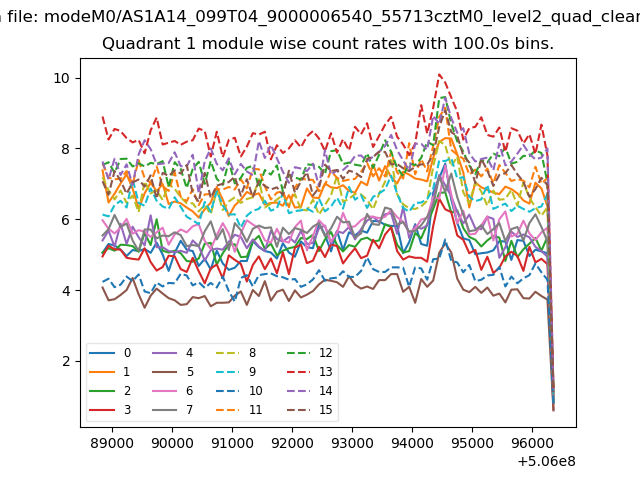
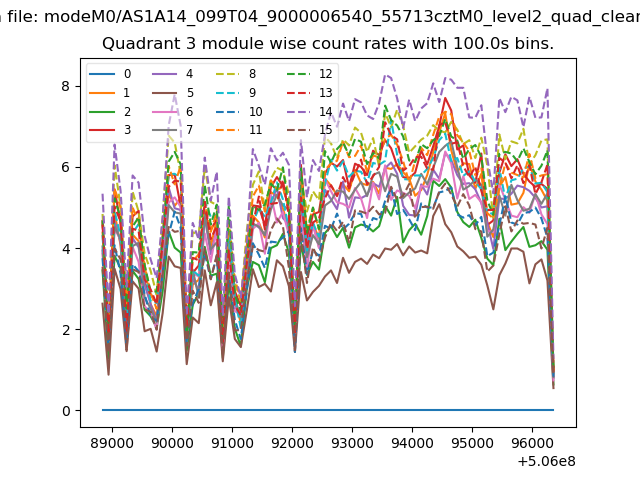
| Module-wise count rates for Quadrant A Data is divided into 100 sec bins |
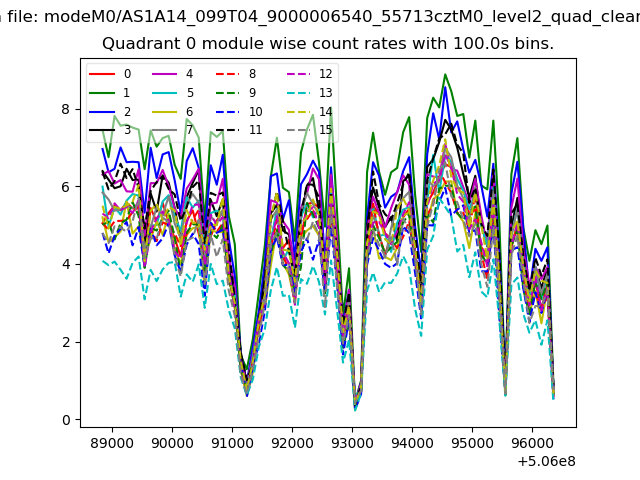 |
 |
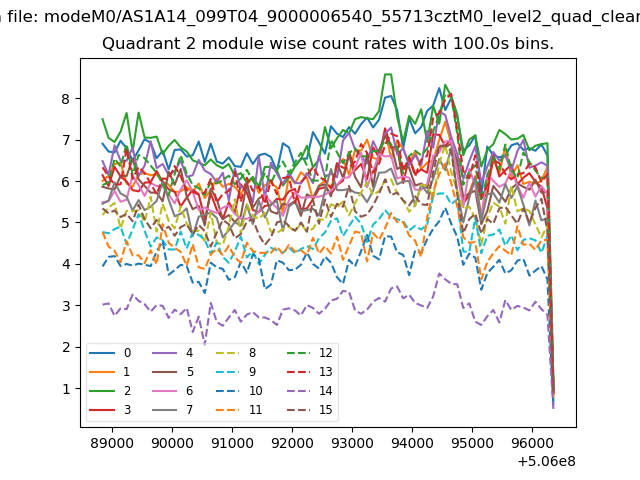
| Module-wise count rates for Quadrant B Data is divided into 100 sec bins |
 |
 |
| Module-wise count rates for Quadrant C Data is divided into 100 sec bins |
 |
 |
| Module-wise count rates for Quadrant D Data is divided into 100 sec bins |
 |
 |
| Parameter | Plot |
|---|---|
| CZT HV Monitor | 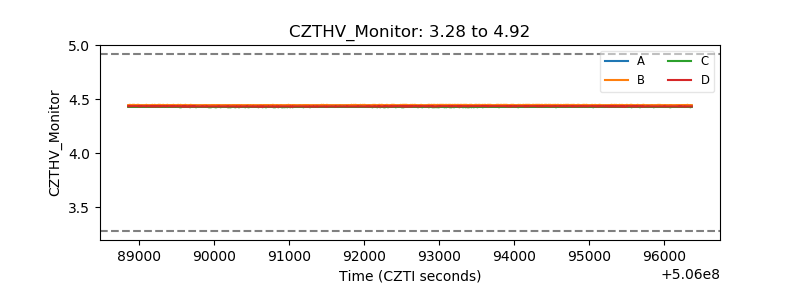 |
| D_VDD | 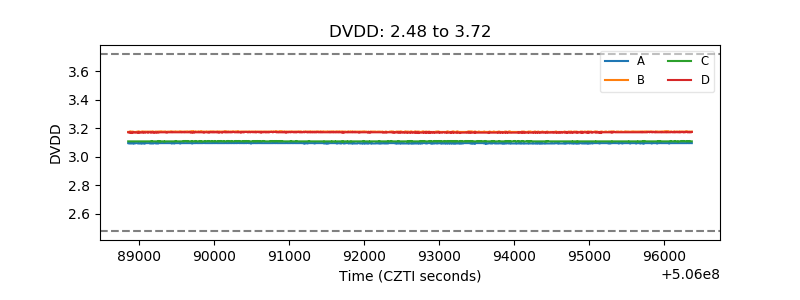 |
| Temperature 1 | 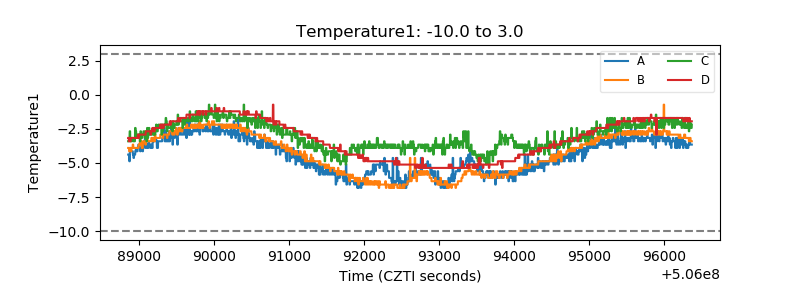 |
| Veto HV Monitor | 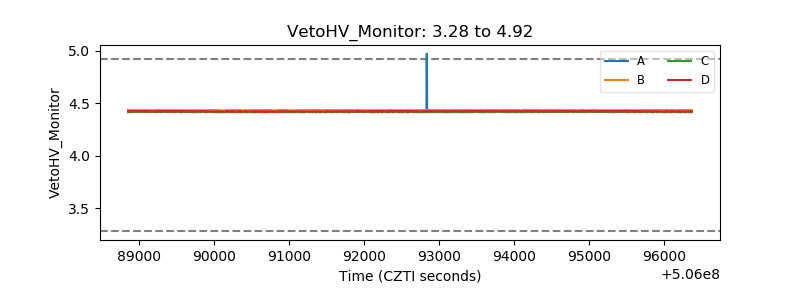 |
| Veto LLD | 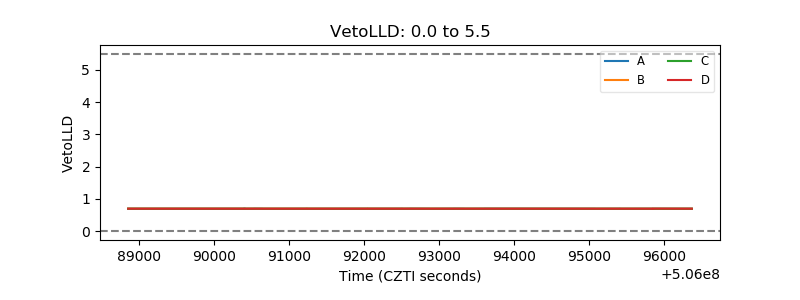 |
| Alpha Counter | 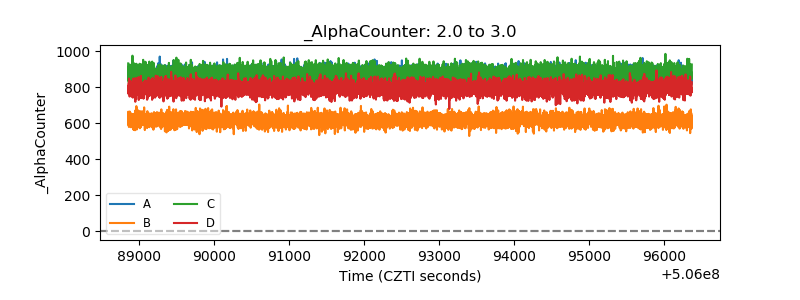 |
| _CPM_Rate | 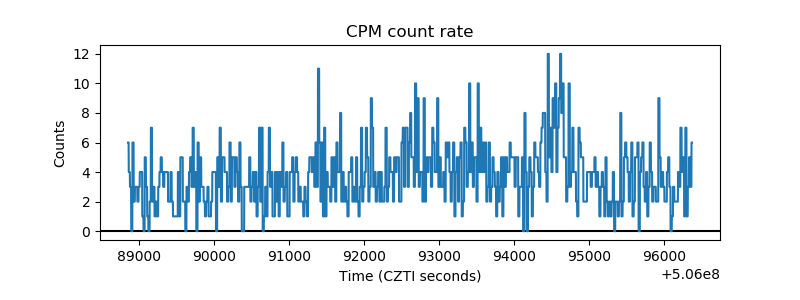 |
| CZT Counter | 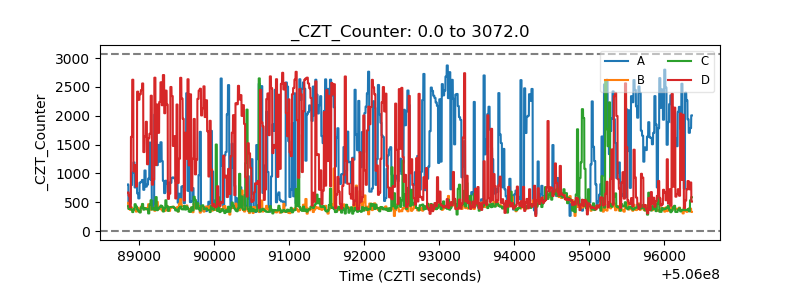 |
| +2.5 Volts monitor |  |
| +5 Volts monitor | 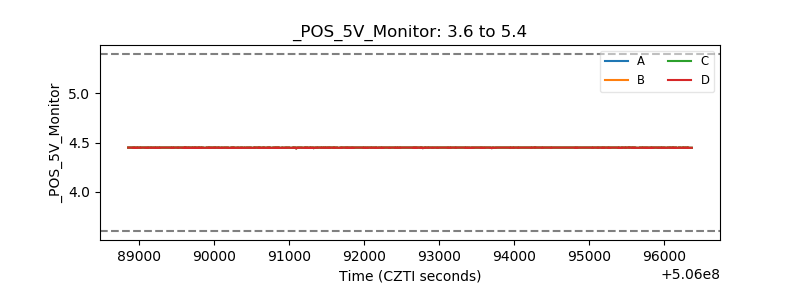 |
| _ROLL_ROT | 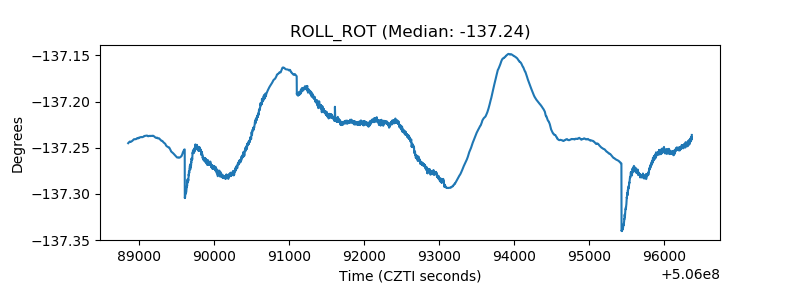 |
| _Roll_DEC | 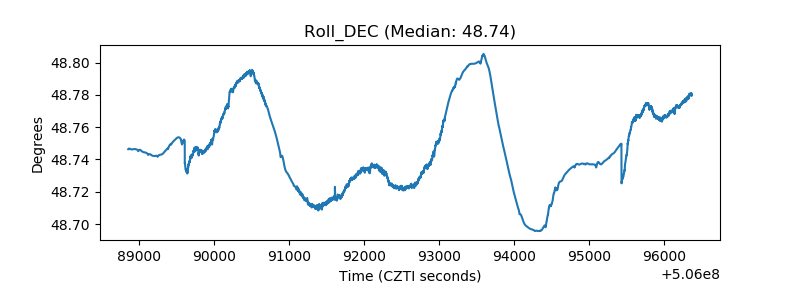 |
| _Roll_RA | 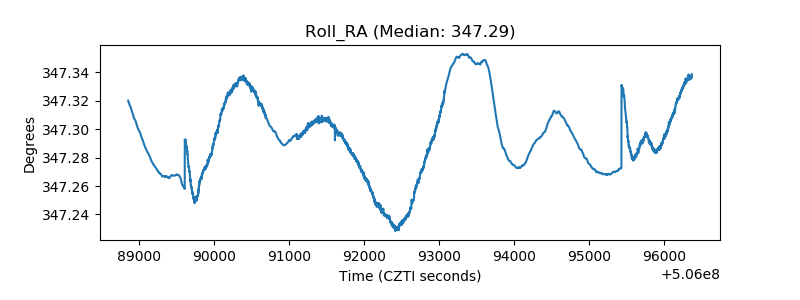 |
| Veto Counter | 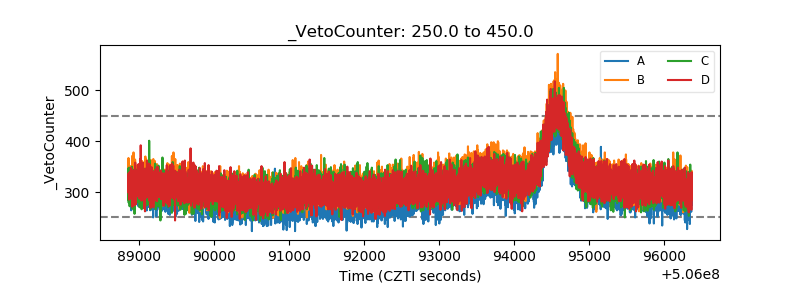 |