| Param | Original file | Final file |
|---|---|---|
| Filename | modeM0/AS1A14_099T04_9000006540_55716cztM0_level2.fits | modeM0/AS1A14_099T04_9000006540_55716cztM0_level2_quad_clean.evt |
| Size (bytes) | 1,532,926,080 | 247,265,280 |
| Size | 1.4 GB | 235.8 MB |
| Events in quadrant A | 22,402,826 | 1,301,129 |
| Events in quadrant B | 7,978,319 | 1,833,114 |
| Events in quadrant C | 11,078,318 | 1,598,642 |
| Events in quadrant D | 13,830,587 | 1,457,707 |
| Mode M0 | |||
|---|---|---|---|
| Quadrant | BADHDUFLAG | Total packets | Discarded packets |
| A | 0 | 79543 | 5 |
| B | 0 | 38638 | 3 |
| C | 0 | 46929 | 3 |
| D | 0 | 54315 | 3 |
| Mode M9 | |||
|---|---|---|---|
| Quadrant | BADHDUFLAG | Total packets | Discarded packets |
| A | 0 | 12 | 0 |
| B | 0 | 12 | 0 |
| C | 0 | 12 | 0 |
| D | 0 | 12 | 0 |
| Mode SS | |||
|---|---|---|---|
| Quadrant | BADHDUFLAG | Total packets | Discarded packets |
| A | 0 | 382 | 0 |
| B | 0 | 382 | 0 |
| C | 0 | 382 | 0 |
| D | 0 | 382 | 0 |
| Quadrant | Total seconds | Saturated seconds | Saturation percentage |
|---|---|---|---|
| A | 18797 | 4624 | 24.599670% |
| B | 18797 | 196 | 1.042720% |
| C | 18798 | 792 | 4.213214% |
| D | 18798 | 1189 | 6.325141% |
Noise dominated data is calculated using 1-second bins in cleaned event files. If a bin has >2000 counts, and if more than 50% of those come from <1% of pixels, then it is considered to be noise-dominated and hence unusable.
| Quadrant | # 1 sec bins | Bins with >0 counts | Bins with >2000 counts | High rate bins dominated by noise | Noise dominated (total time) | Noise dominated (detector-on time) | Marked lightcurve |
|---|---|---|---|---|---|---|---|
| A | 19947 | 18802 | 3781 | 3781 | 18.96% | 20.11% | 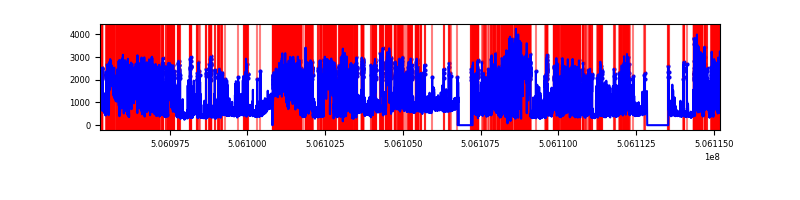 |
| B | 19947 | 18802 | 28 | 28 | 0.14% | 0.15% | 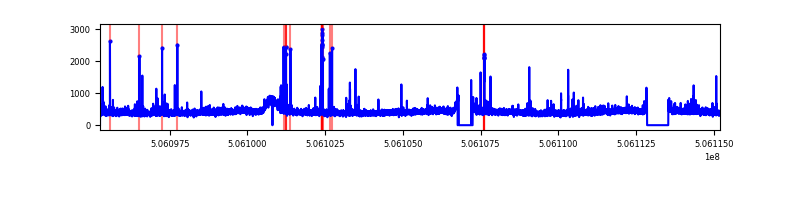 |
| C | 19948 | 18803 | 649 | 649 | 3.25% | 3.45% | 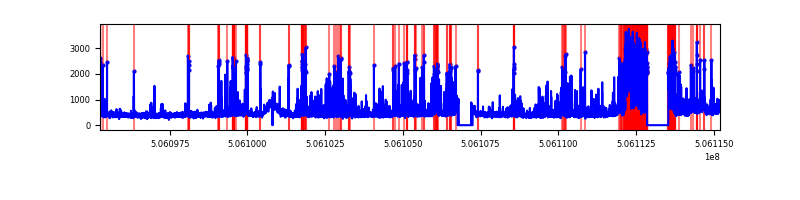 |
| D | 19948 | 18803 | 1101 | 1101 | 5.52% | 5.86% | 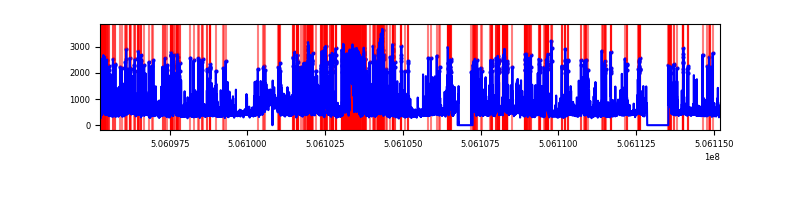 |
Top three noisy pixels from each quadrant. If the there are fewer than three noisy pixels in the level2.evt file, extra rows are filled as -1
| Pixel properties | Quadrant properties | ||||||
|---|---|---|---|---|---|---|---|
| Quadrant | DetID | PixID | Counts | Sigma | Mean | Median | Sigma |
| A | 15 | 32 | 12769644 | 29762.32 | 1748 | 1706 | 429.0 |
| A | 4 | 249 | 1484165 | 3455.64 | 1748 | 1706 | 429.0 |
| A | 0 | 8 | 743757 | 1729.74 | 1748 | 1706 | 429.0 |
| B | 5 | 248 | 77811 | 181.57 | 1947 | 1872 | 418.2 |
| B | 12 | 111 | 52142 | 120.19 | 1947 | 1872 | 418.2 |
| B | 11 | 111 | 48554 | 111.62 | 1947 | 1872 | 418.2 |
| C | 12 | 249 | 1771638 | 3405.1 | 1905 | 1887 | 519.7 |
| C | 12 | 252 | 500650 | 959.65 | 1905 | 1887 | 519.7 |
| C | 13 | 3 | 346179 | 662.44 | 1905 | 1887 | 519.7 |
| D | 11 | 129 | 5138067 | 9718.55 | 1883 | 1800 | 528.5 |
| D | 10 | 181 | 762971 | 1440.24 | 1883 | 1800 | 528.5 |
| D | 2 | 31 | 187798 | 351.93 | 1883 | 1800 | 528.5 |
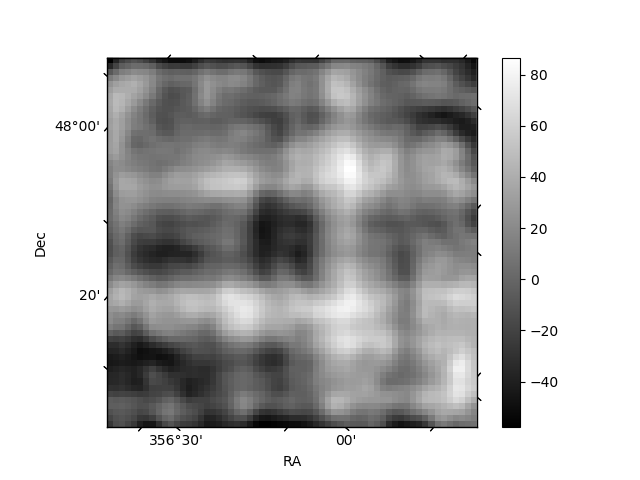
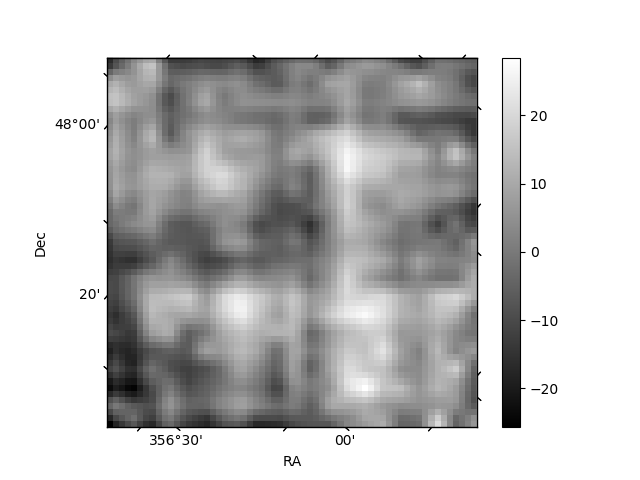
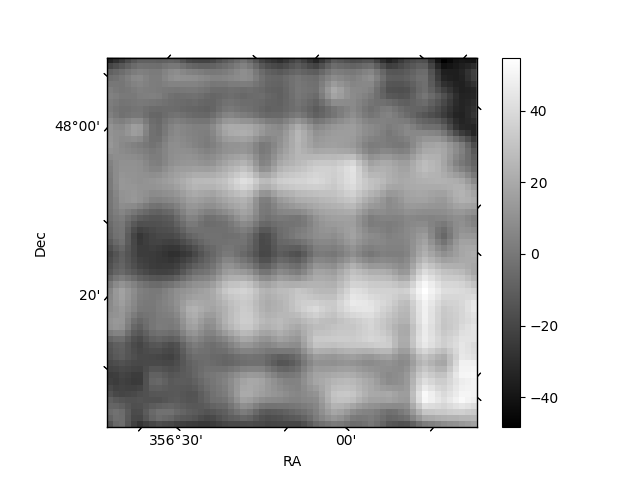
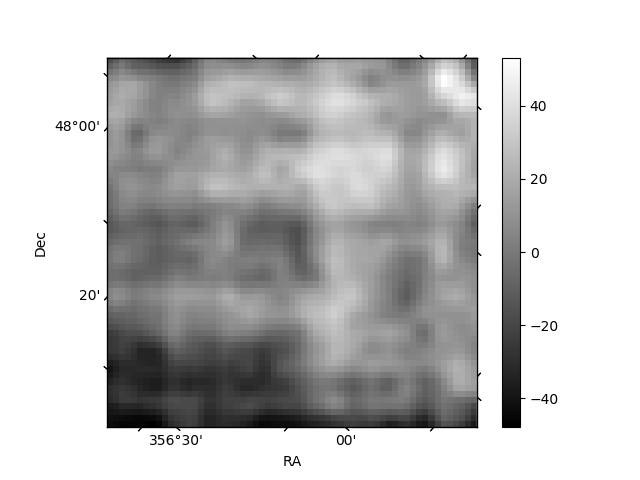
Histogram calculated using DETX and DETY for each event in the final _common_clean file
| Quadrant A | 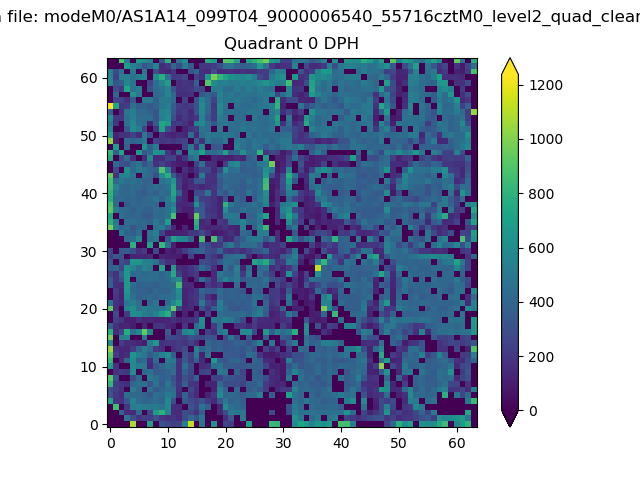 |
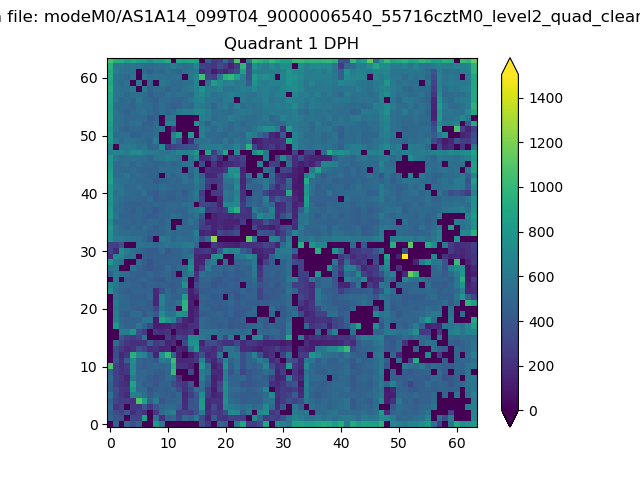 |
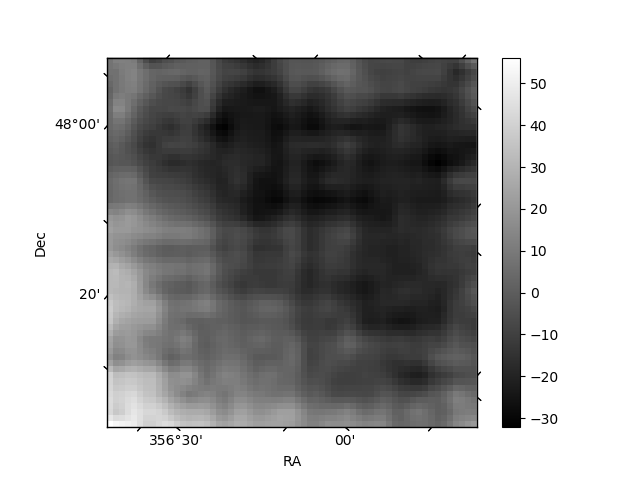
Quadrant B |
|---|---|---|---|
| Quadrant D | 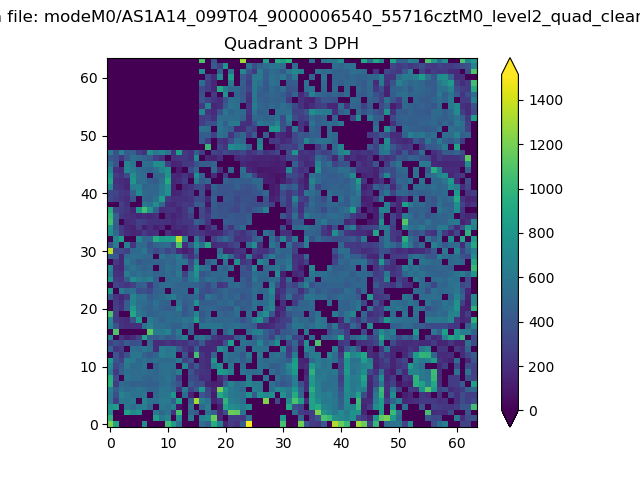 |
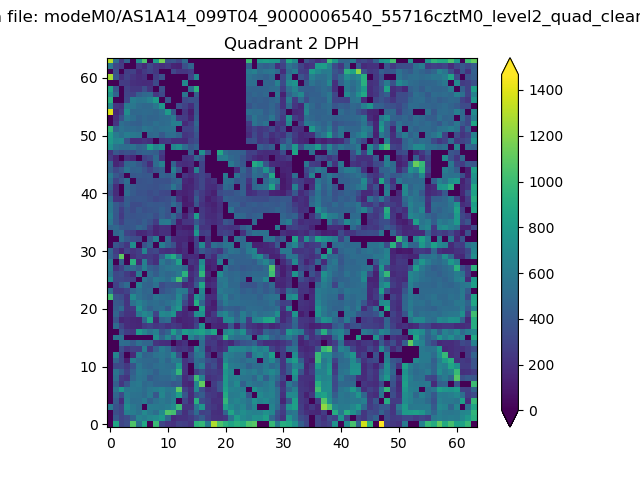 |
Quadrant C |
| Plot type | Count rate plots | Images |
|---|---|---|
| Comparison with Poisson distribution Blue bars denote a histogram of data divided into 1 sec bins. Red curve is a Poisson curve with rate = median count rate of data. |
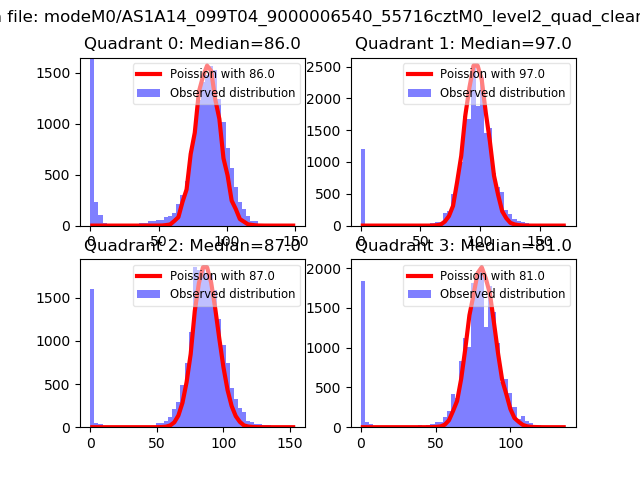 |
 |
| Quadrant-wise count rates Data is divided into 100 sec bins |
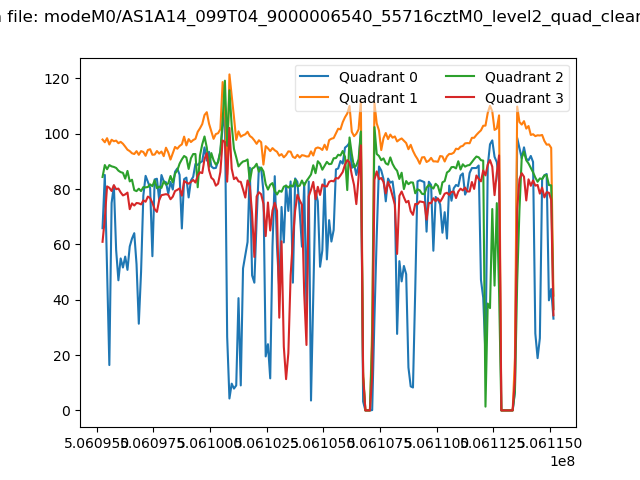 |
|
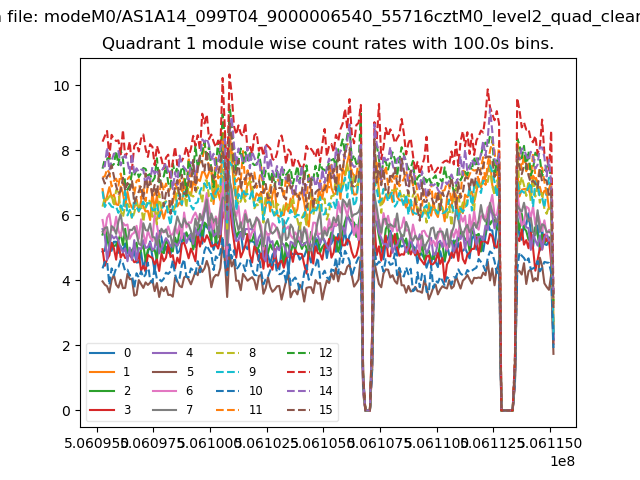
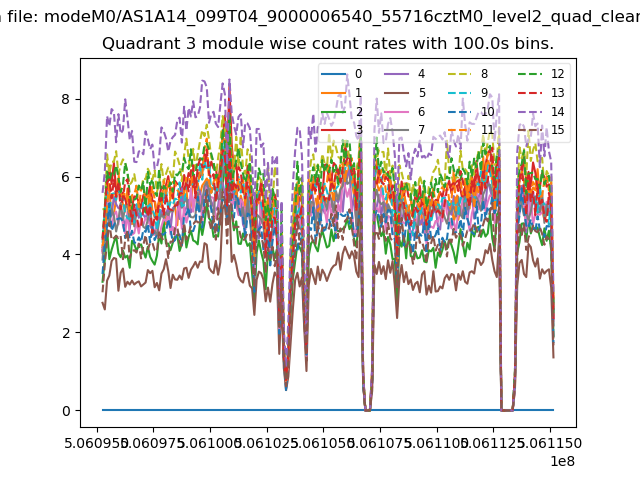
| Module-wise count rates for Quadrant A Data is divided into 100 sec bins |
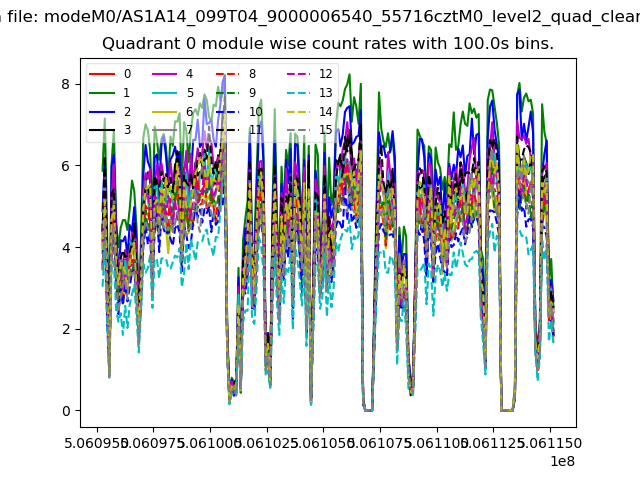 |
 |
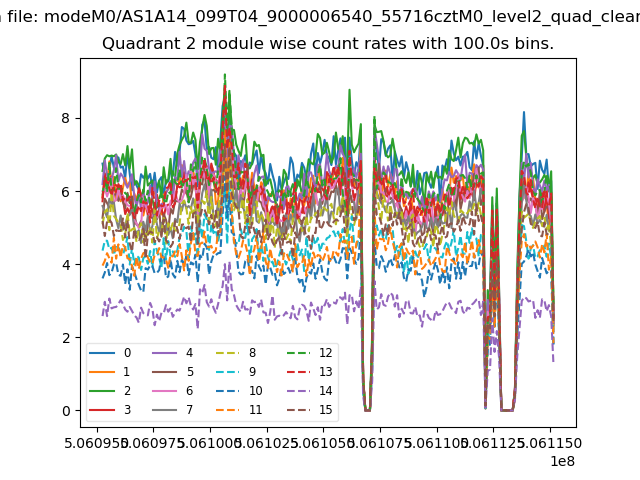
| Module-wise count rates for Quadrant B Data is divided into 100 sec bins |
 |
 |
| Module-wise count rates for Quadrant C Data is divided into 100 sec bins |
 |
 |
| Module-wise count rates for Quadrant D Data is divided into 100 sec bins |
 |
 |
| Parameter | Plot |
|---|---|
| CZT HV Monitor | 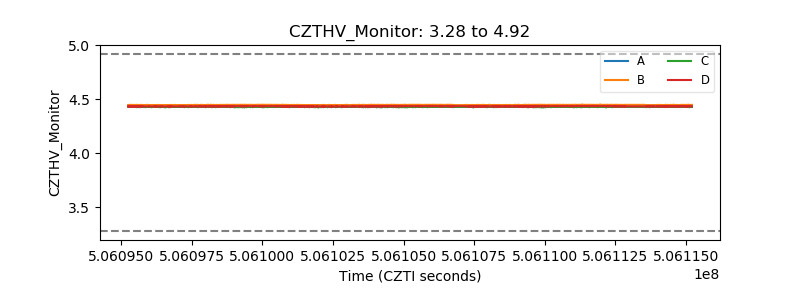 |
| D_VDD | 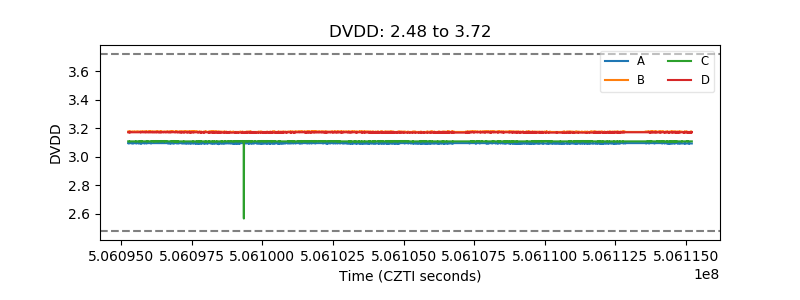 |
| Temperature 1 | 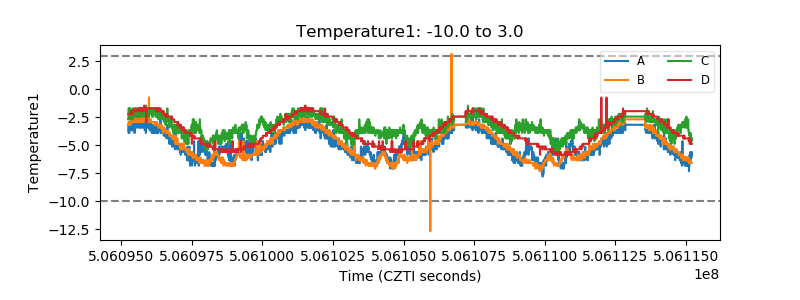 |
| Veto HV Monitor | 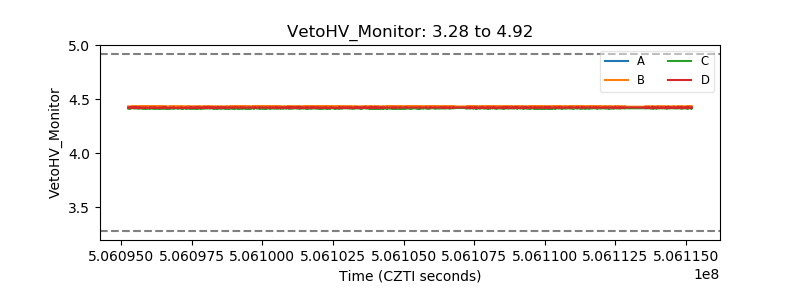 |
| Veto LLD | 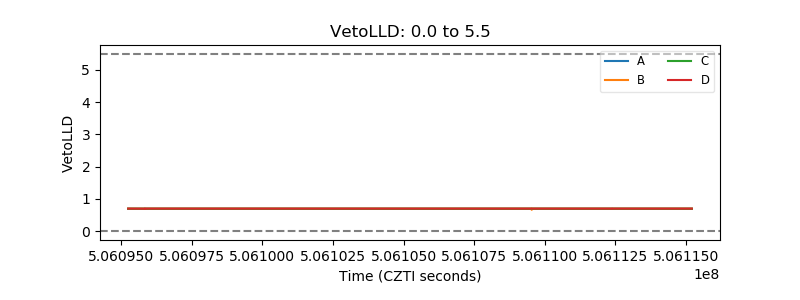 |
| Alpha Counter | 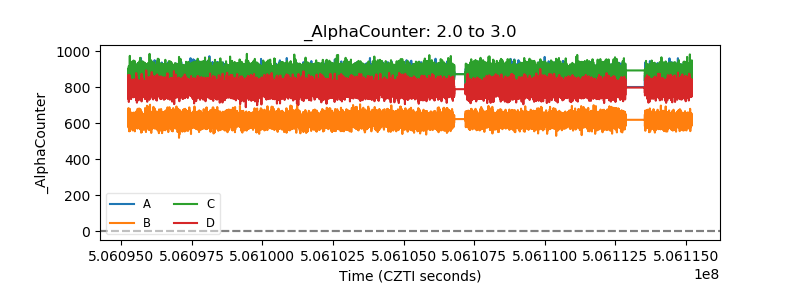 |
| _CPM_Rate | 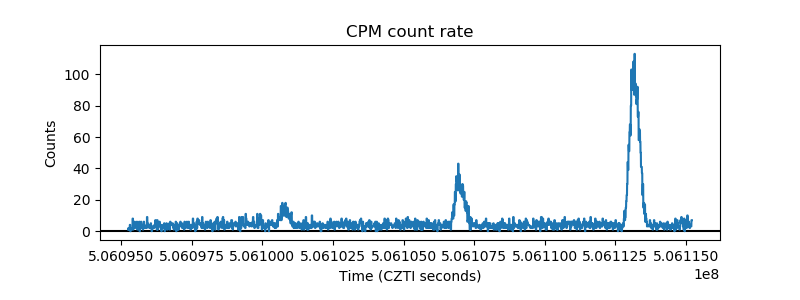 |
| CZT Counter | 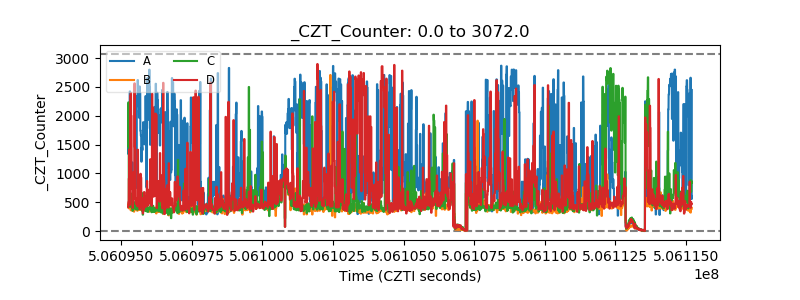 |
| +2.5 Volts monitor |  |
| +5 Volts monitor |  |
| _ROLL_ROT | 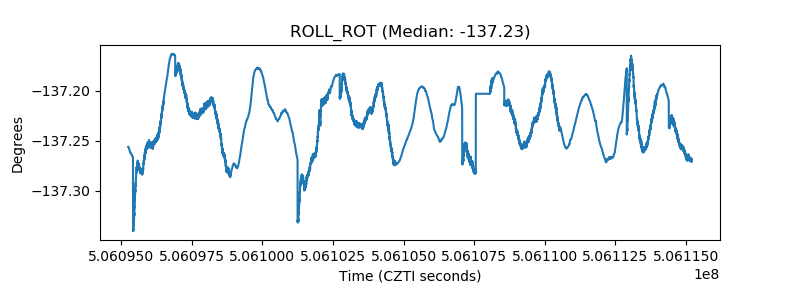 |
| _Roll_DEC | 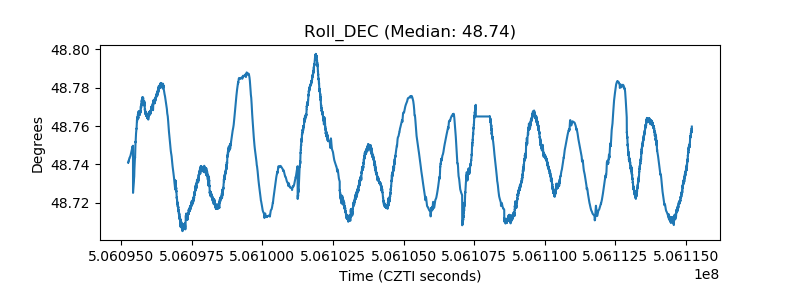 |
| _Roll_RA | 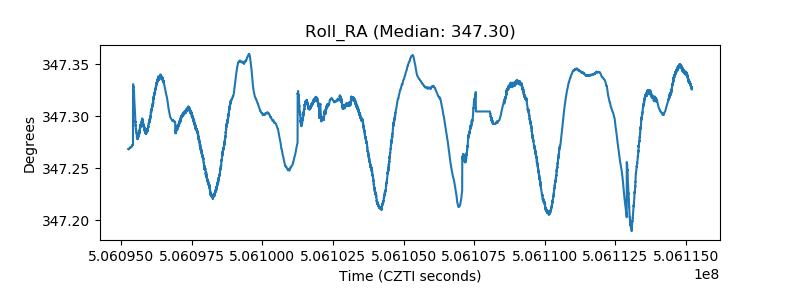 |
| Veto Counter | 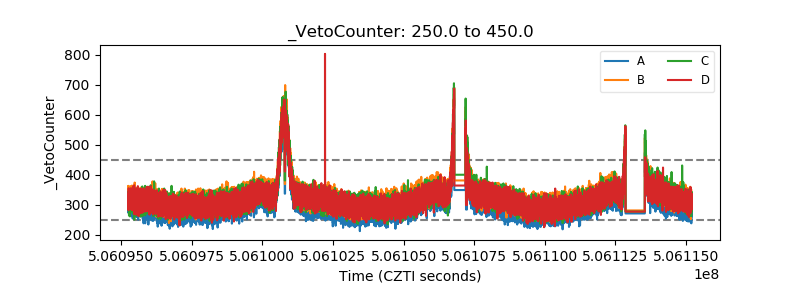 |