| Param | Original file | Final file |
|---|---|---|
| Filename | modeM0/AS1A14_099T04_9000006540_55717cztM0_level2.fits | modeM0/AS1A14_099T04_9000006540_55717cztM0_level2_quad_clean.evt |
| Size (bytes) | 530,452,800 | 92,954,880 |
| Size | 505.9 MB | 88.6 MB |
| Events in quadrant A | 7,466,565 | 521,660 |
| Events in quadrant B | 2,978,971 | 671,501 |
| Events in quadrant C | 3,825,419 | 599,242 |
| Events in quadrant D | 4,837,106 | 548,929 |
| Mode M0 | |||
|---|---|---|---|
| Quadrant | BADHDUFLAG | Total packets | Discarded packets |
| A | 0 | 26849 | 1 |
| B | 0 | 14078 | 1 |
| C | 0 | 16224 | 1 |
| D | 0 | 19149 | 1 |
| Mode M9 | |||
|---|---|---|---|
| Quadrant | BADHDUFLAG | Total packets | Discarded packets |
| A | 0 | 9 | 0 |
| B | 0 | 9 | 0 |
| C | 0 | 9 | 0 |
| D | 0 | 9 | 0 |
| Mode SS | |||
|---|---|---|---|
| Quadrant | BADHDUFLAG | Total packets | Discarded packets |
| A | 0 | 136 | 0 |
| B | 0 | 136 | 0 |
| C | 0 | 136 | 0 |
| D | 0 | 136 | 0 |
| Quadrant | Total seconds | Saturated seconds | Saturation percentage |
|---|---|---|---|
| A | 6792 | 1406 | 20.700824% |
| B | 6793 | 18 | 0.264979% |
| C | 6793 | 86 | 1.266009% |
| D | 6793 | 355 | 5.225968% |
Noise dominated data is calculated using 1-second bins in cleaned event files. If a bin has >2000 counts, and if more than 50% of those come from <1% of pixels, then it is considered to be noise-dominated and hence unusable.
| Quadrant | # 1 sec bins | Bins with >0 counts | Bins with >2000 counts | High rate bins dominated by noise | Noise dominated (total time) | Noise dominated (detector-on time) | Marked lightcurve |
|---|---|---|---|---|---|---|---|
| A | 7637 | 6793 | 1213 | 1213 | 15.88% | 17.86% | 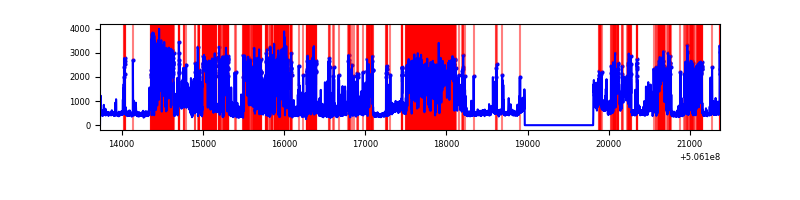 |
| B | 7638 | 6794 | 2 | 2 | 0.03% | 0.03% | 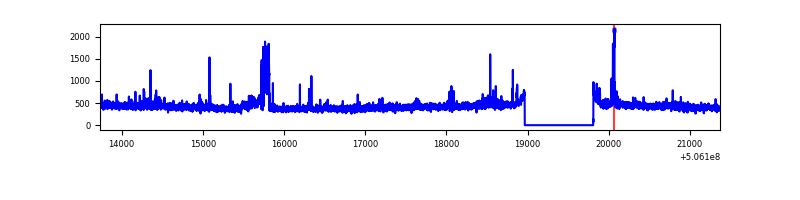 |
| C | 7638 | 6794 | 54 | 54 | 0.71% | 0.79% | 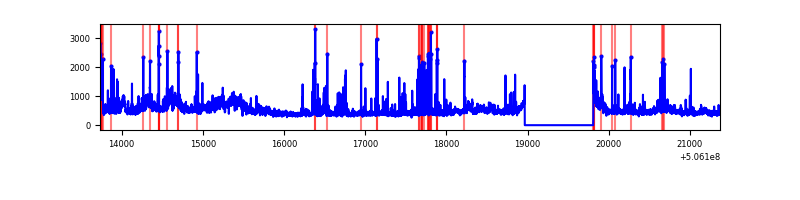 |
| D | 7638 | 6794 | 335 | 335 | 4.39% | 4.93% | 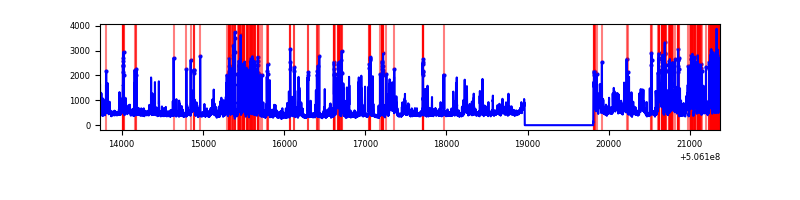 |
Top three noisy pixels from each quadrant. If the there are fewer than three noisy pixels in the level2.evt file, extra rows are filled as -1
| Pixel properties | Quadrant properties | ||||||
|---|---|---|---|---|---|---|---|
| Quadrant | DetID | PixID | Counts | Sigma | Mean | Median | Sigma |
| A | 15 | 32 | 4265302 | 26588.88 | 646 | 628 | 160.4 |
| A | 7 | 64 | 357276 | 2223.58 | 646 | 628 | 160.4 |
| A | 4 | 249 | 77500 | 479.27 | 646 | 628 | 160.4 |
| B | 5 | 236 | 119644 | 794.03 | 698 | 671 | 149.8 |
| B | 5 | 248 | 26033 | 169.26 | 698 | 671 | 149.8 |
| B | 12 | 111 | 18571 | 119.46 | 698 | 671 | 149.8 |
| C | 15 | 208 | 515777 | 2703.85 | 690 | 683 | 190.5 |
| C | 6 | 223 | 179901 | 940.76 | 690 | 683 | 190.5 |
| C | 12 | 249 | 103312 | 538.72 | 690 | 683 | 190.5 |
| D | 11 | 129 | 1939925 | 10116.25 | 675 | 645 | 191.7 |
| D | 10 | 181 | 75197 | 388.9 | 675 | 645 | 191.7 |
| D | 7 | 129 | 62203 | 321.12 | 675 | 645 | 191.7 |
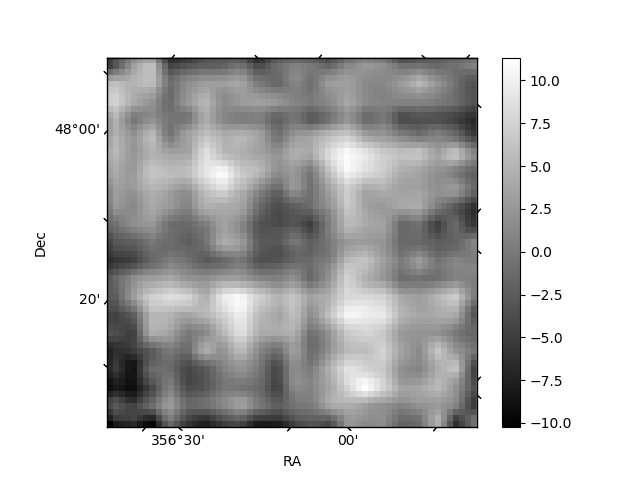
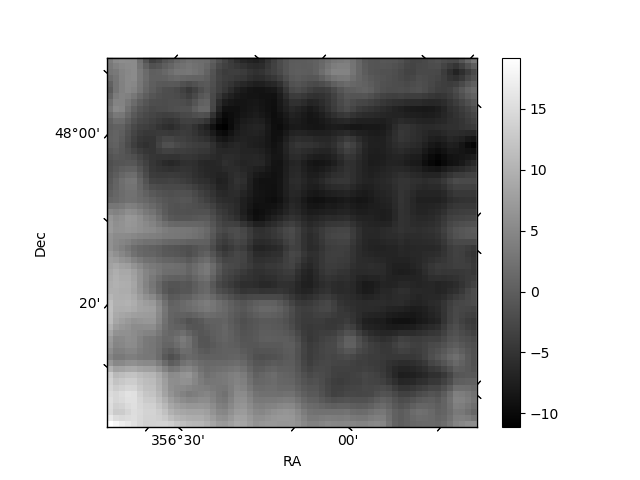
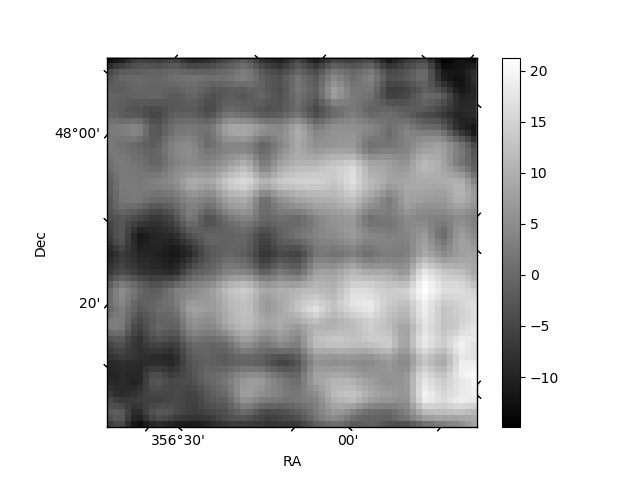
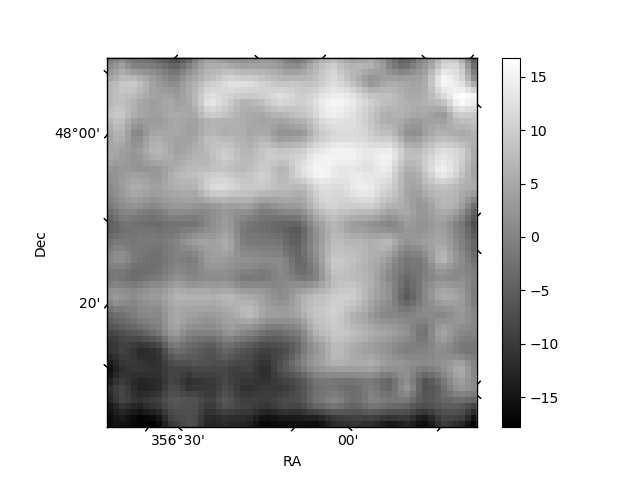
Histogram calculated using DETX and DETY for each event in the final _common_clean file
| Quadrant A | 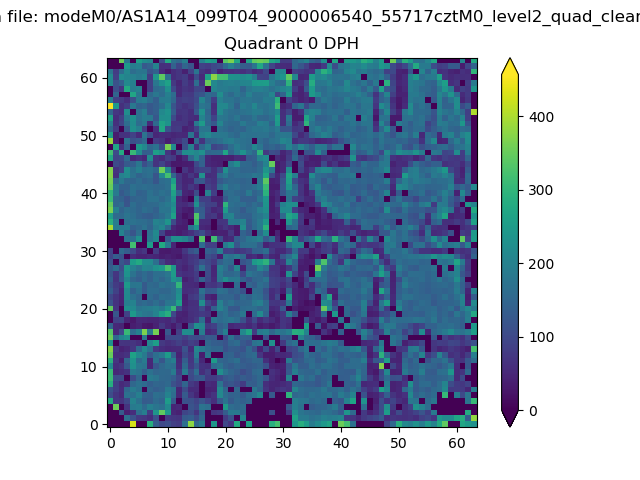 |
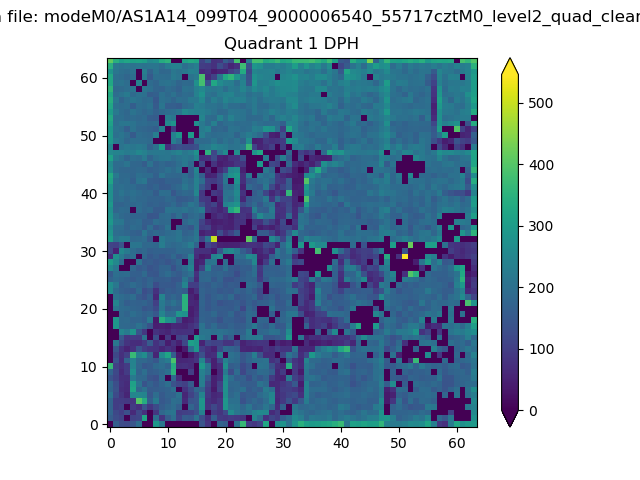 |
Quadrant B |
|---|---|---|---|
| Quadrant D | 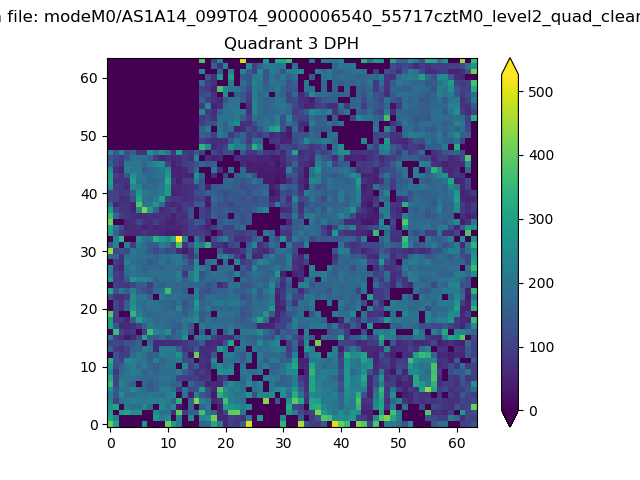 |
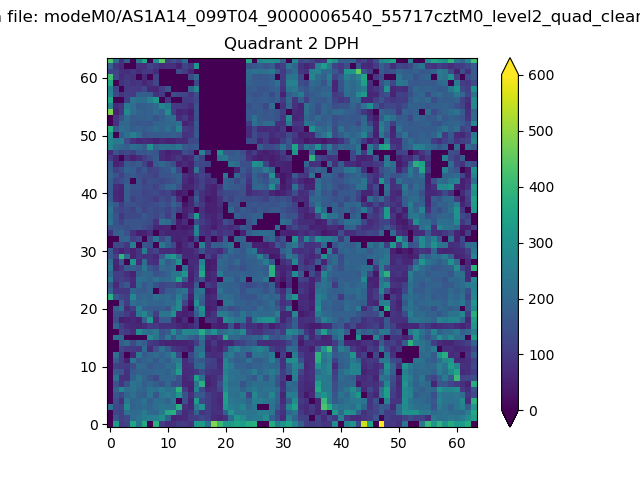 |
Quadrant C |
| Plot type | Count rate plots | Images |
|---|---|---|
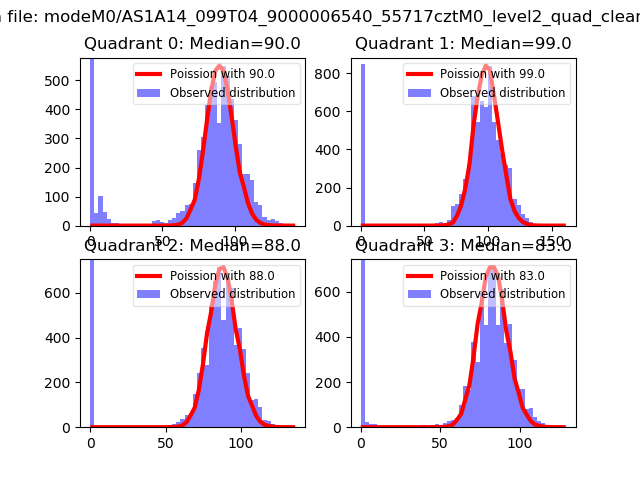
| Comparison with Poisson distribution Blue bars denote a histogram of data divided into 1 sec bins. Red curve is a Poisson curve with rate = median count rate of data. |
 |
 |
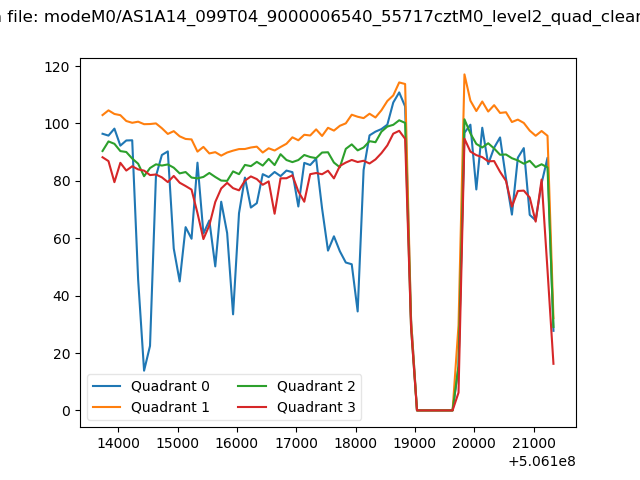
| Quadrant-wise count rates Data is divided into 100 sec bins |
 |
|
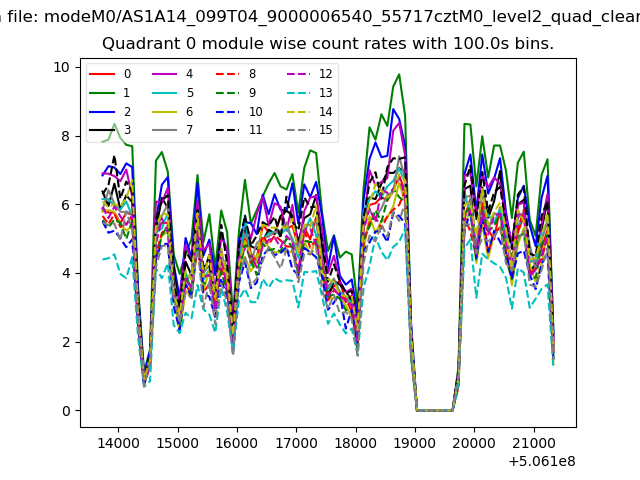
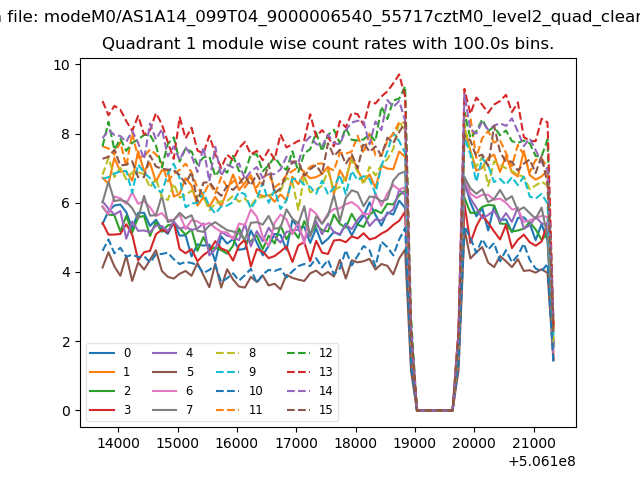
| Module-wise count rates for Quadrant A Data is divided into 100 sec bins |
 |
 |
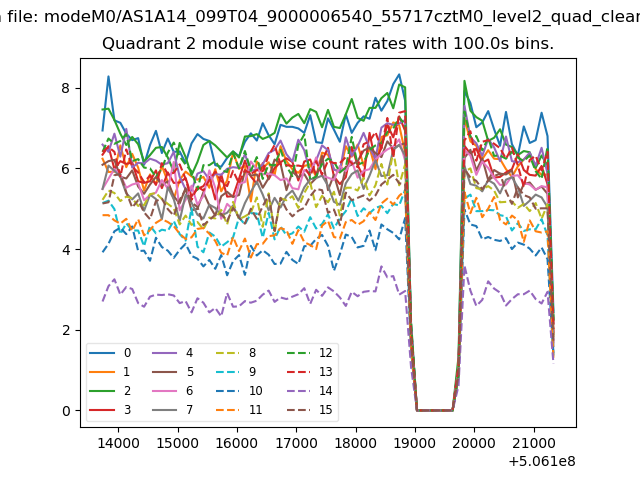
| Module-wise count rates for Quadrant B Data is divided into 100 sec bins |
 |
 |
| Module-wise count rates for Quadrant C Data is divided into 100 sec bins |
 |
 |
| Module-wise count rates for Quadrant D Data is divided into 100 sec bins |
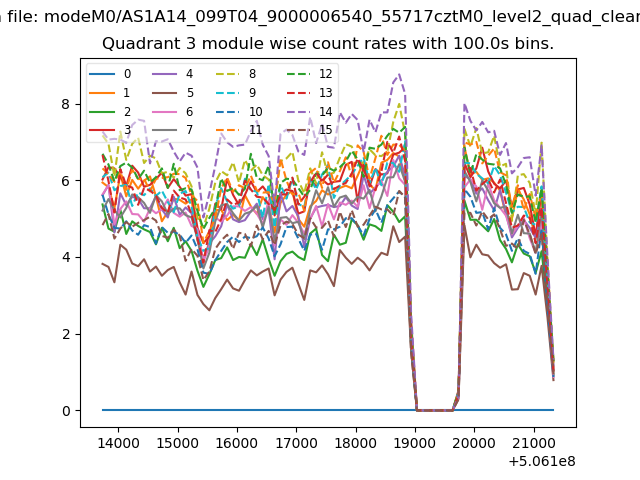 |
 |
| Parameter | Plot |
|---|---|
| CZT HV Monitor | 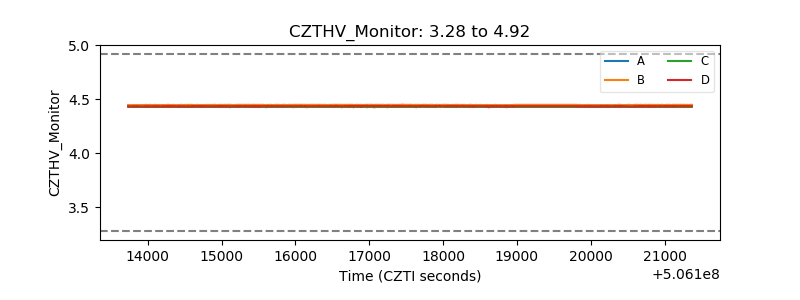 |
| D_VDD | 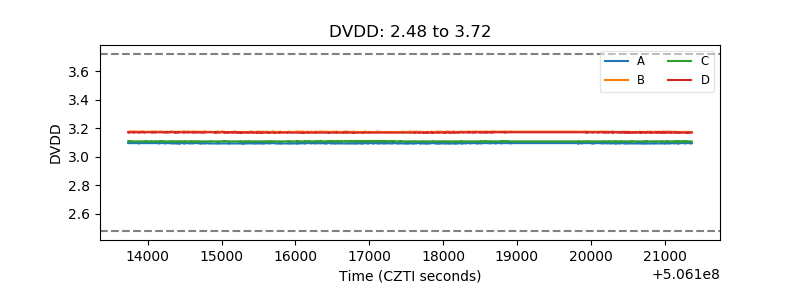 |
| Temperature 1 | 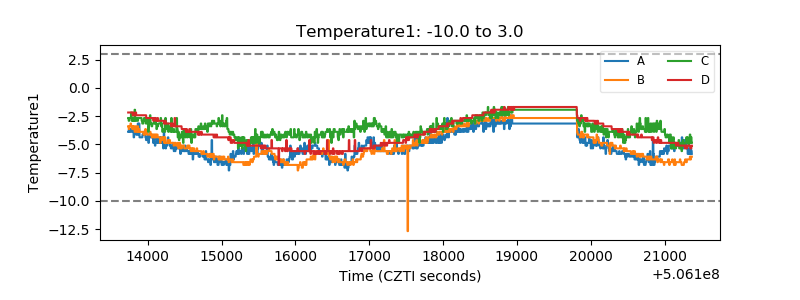 |
| Veto HV Monitor |  |
| Veto LLD | 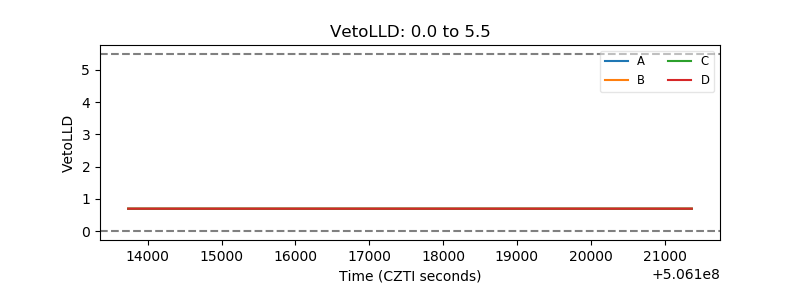 |
| Alpha Counter | 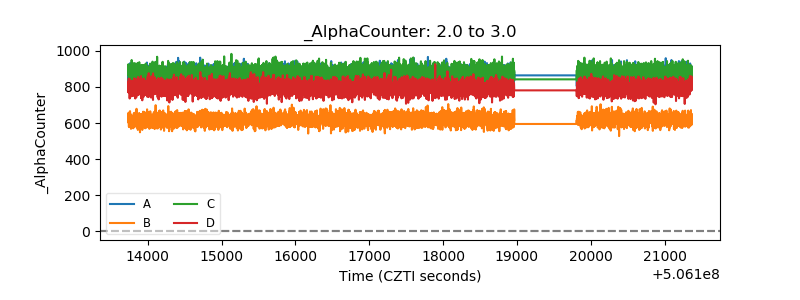 |
| _CPM_Rate | 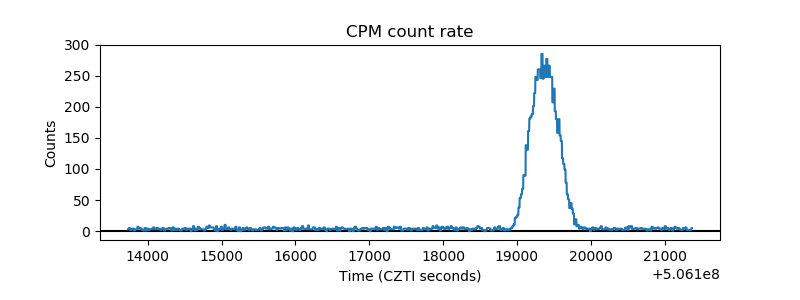 |
| CZT Counter | 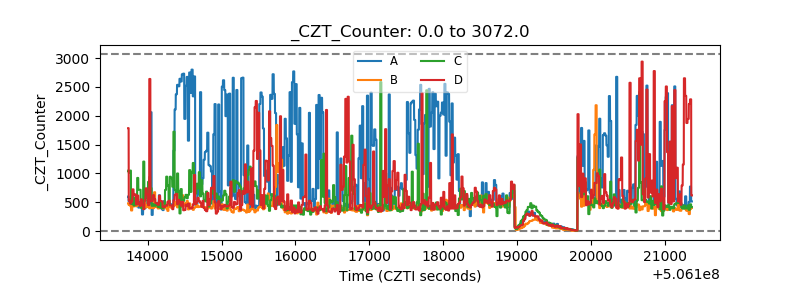 |
| +2.5 Volts monitor |  |
| +5 Volts monitor |  |
| _ROLL_ROT | 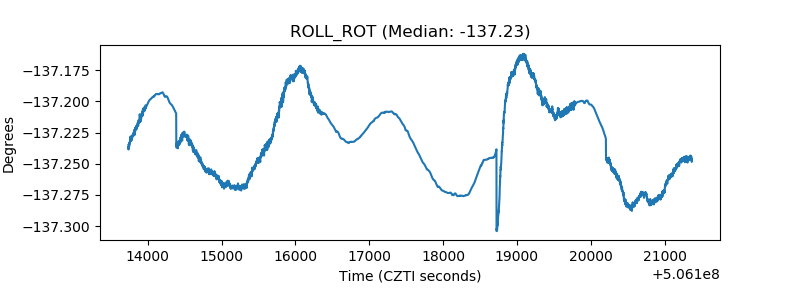 |
| _Roll_DEC | 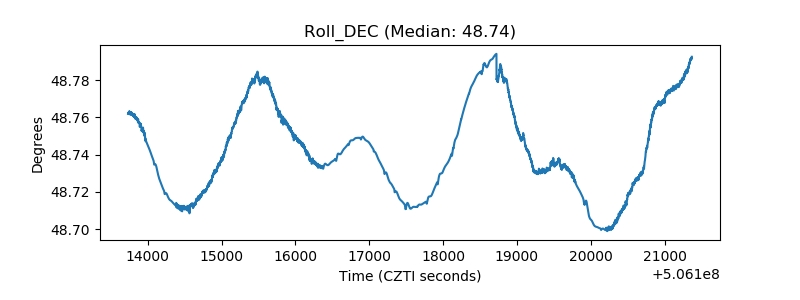 |
| _Roll_RA | 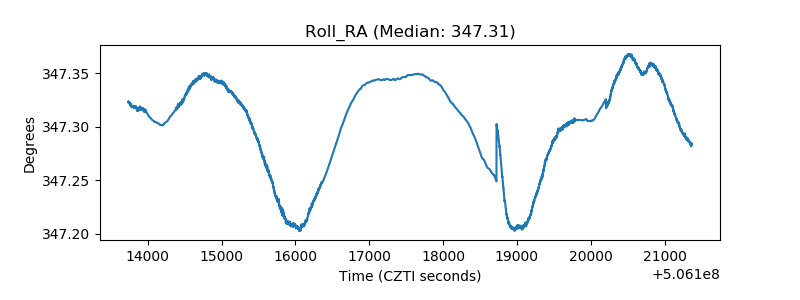 |
| Veto Counter | 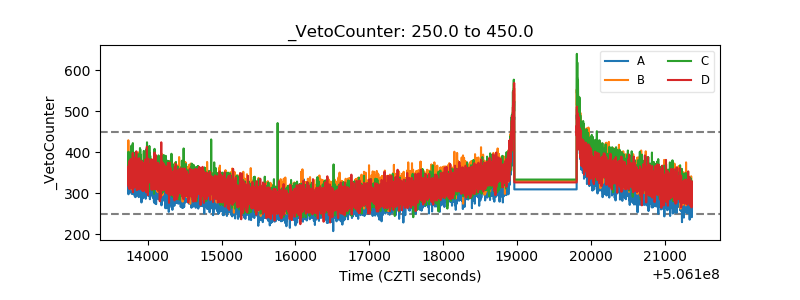 |