| Param | Original file | Final file |
|---|---|---|
| Filename | modeM0/AS1A14_099T04_9000006540_55719cztM0_level2.fits | modeM0/AS1A14_099T04_9000006540_55719cztM0_level2_quad_clean.evt |
| Size (bytes) | 538,911,360 | 92,269,440 |
| Size | 513.9 MB | 88.0 MB |
| Events in quadrant A | 6,372,104 | 539,873 |
| Events in quadrant B | 2,889,765 | 672,111 |
| Events in quadrant C | 3,911,906 | 596,852 |
| Events in quadrant D | 6,254,889 | 517,924 |
| Mode M0 | |||
|---|---|---|---|
| Quadrant | BADHDUFLAG | Total packets | Discarded packets |
| A | 0 | 23718 | 2 |
| B | 0 | 13710 | 2 |
| C | 0 | 16212 | 2 |
| D | 0 | 23283 | 2 |
| Mode M9 | |||
|---|---|---|---|
| Quadrant | BADHDUFLAG | Total packets | Discarded packets |
| A | 0 | 10 | 0 |
| B | 0 | 10 | 0 |
| C | 0 | 10 | 0 |
| D | 0 | 10 | 0 |
| Mode SS | |||
|---|---|---|---|
| Quadrant | BADHDUFLAG | Total packets | Discarded packets |
| A | 0 | 136 | 0 |
| B | 0 | 136 | 0 |
| C | 0 | 136 | 0 |
| D | 0 | 136 | 0 |
| Quadrant | Total seconds | Saturated seconds | Saturation percentage |
|---|---|---|---|
| A | 6697 | 1036 | 15.469613% |
| B | 6697 | 30 | 0.447962% |
| C | 6696 | 169 | 2.523895% |
| D | 6696 | 751 | 11.215651% |
Noise dominated data is calculated using 1-second bins in cleaned event files. If a bin has >2000 counts, and if more than 50% of those come from <1% of pixels, then it is considered to be noise-dominated and hence unusable.
| Quadrant | # 1 sec bins | Bins with >0 counts | Bins with >2000 counts | High rate bins dominated by noise | Noise dominated (total time) | Noise dominated (detector-on time) | Marked lightcurve |
|---|---|---|---|---|---|---|---|
| A | 7702 | 6698 | 895 | 895 | 11.62% | 13.36% | 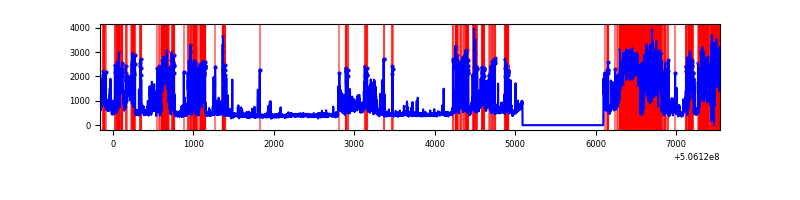 |
| B | 7702 | 6698 | 2 | 2 | 0.03% | 0.03% | 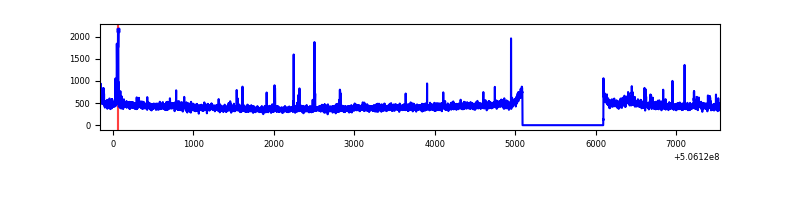 |
| C | 7701 | 6697 | 102 | 102 | 1.32% | 1.52% | 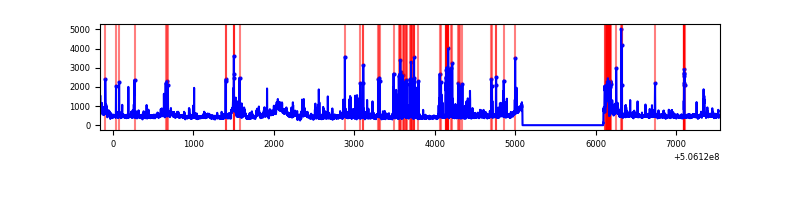 |
| D | 7701 | 6697 | 692 | 692 | 8.99% | 10.33% | 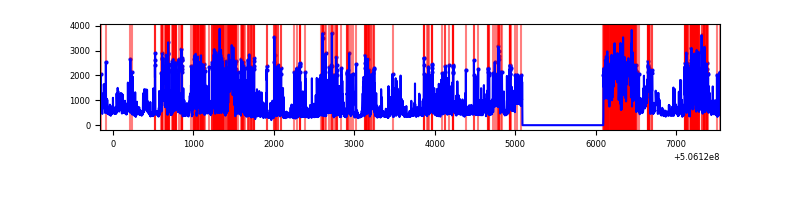 |
Top three noisy pixels from each quadrant. If the there are fewer than three noisy pixels in the level2.evt file, extra rows are filled as -1
| Pixel properties | Quadrant properties | ||||||
|---|---|---|---|---|---|---|---|
| Quadrant | DetID | PixID | Counts | Sigma | Mean | Median | Sigma |
| A | 15 | 32 | 3290539 | 20526.02 | 654 | 640 | 160.3 |
| A | 8 | 192 | 152859 | 949.71 | 654 | 640 | 160.3 |
| A | 12 | 115 | 102342 | 634.53 | 654 | 640 | 160.3 |
| B | 0 | 199 | 33034 | 216.72 | 696 | 673 | 149.3 |
| B | 5 | 248 | 25770 | 168.07 | 696 | 673 | 149.3 |
| B | 0 | 197 | 24529 | 159.76 | 696 | 673 | 149.3 |
| C | 15 | 164 | 260306 | 1379.92 | 685 | 679 | 188.1 |
| C | 15 | 208 | 241700 | 1281.03 | 685 | 679 | 188.1 |
| C | 12 | 252 | 142396 | 753.23 | 685 | 679 | 188.1 |
| D | 11 | 129 | 3383368 | 18231.98 | 655 | 626 | 185.5 |
| D | 10 | 181 | 91568 | 490.15 | 655 | 626 | 185.5 |
| D | 7 | 129 | 65919 | 351.91 | 655 | 626 | 185.5 |
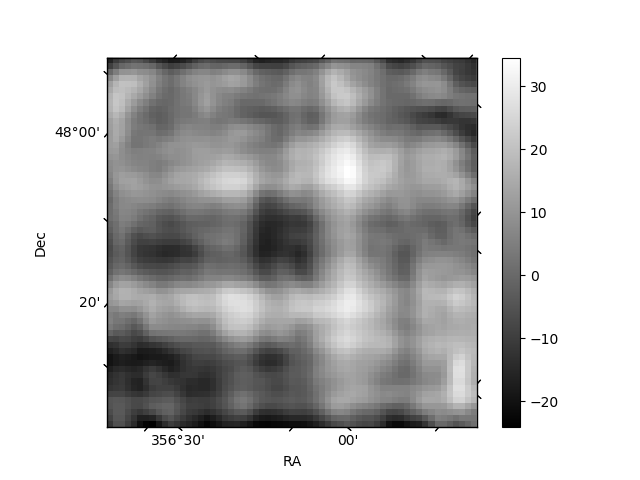
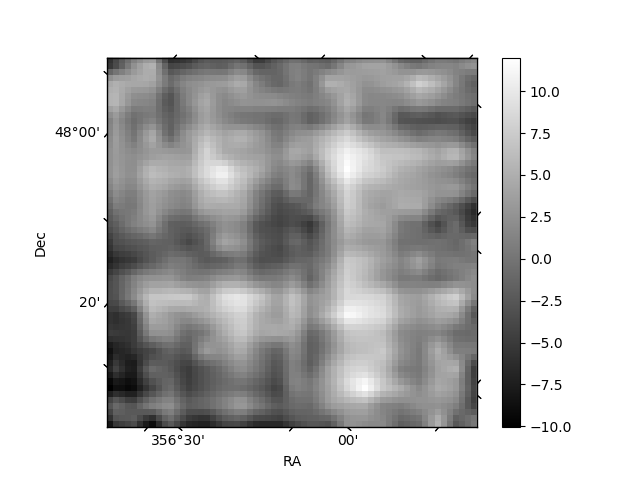
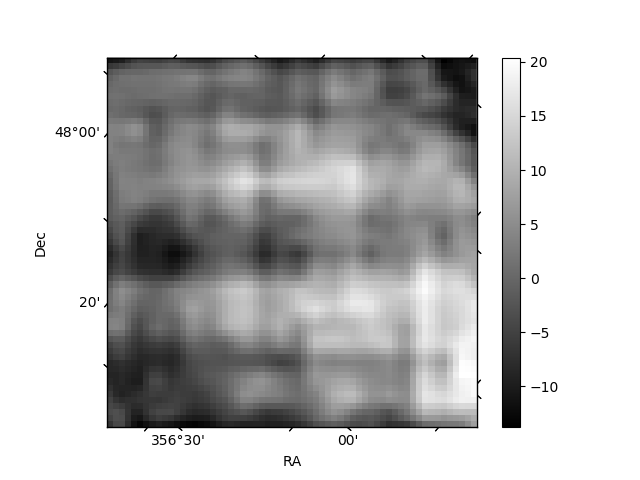
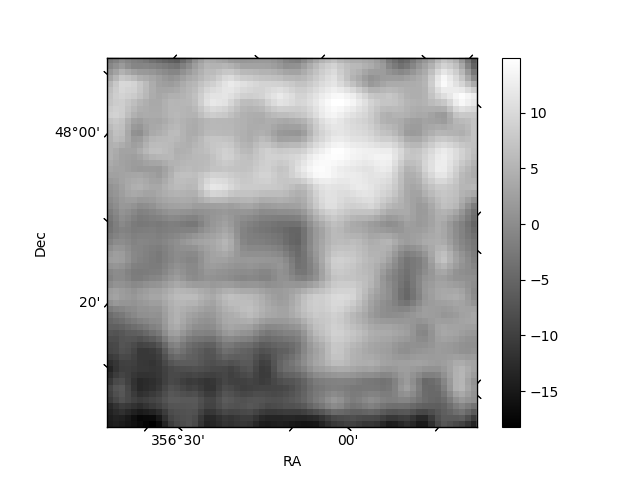
Histogram calculated using DETX and DETY for each event in the final _common_clean file
| Quadrant A | 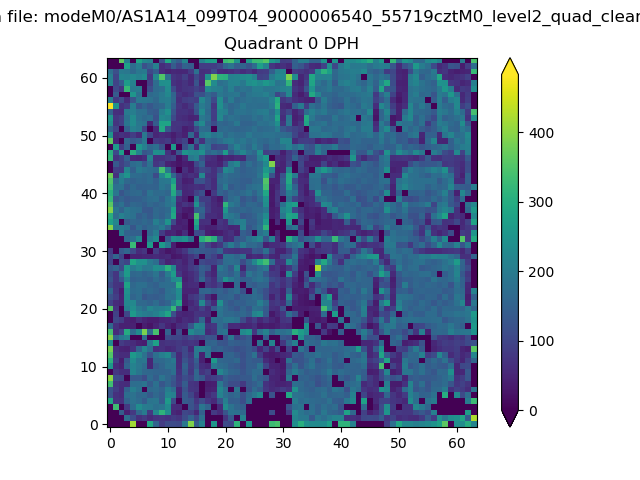 |
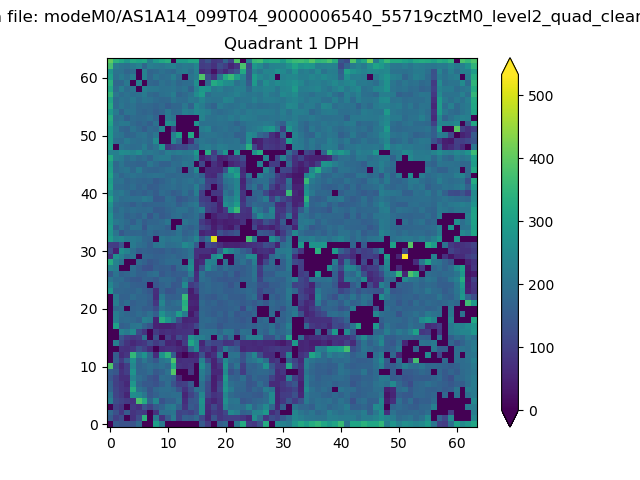 |
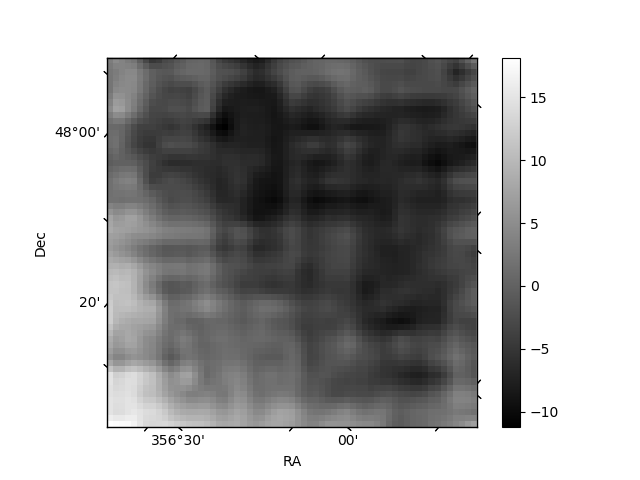
Quadrant B |
|---|---|---|---|
| Quadrant D | 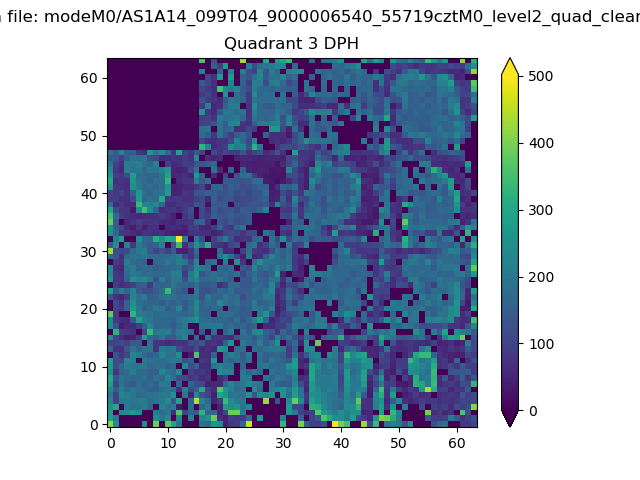 |
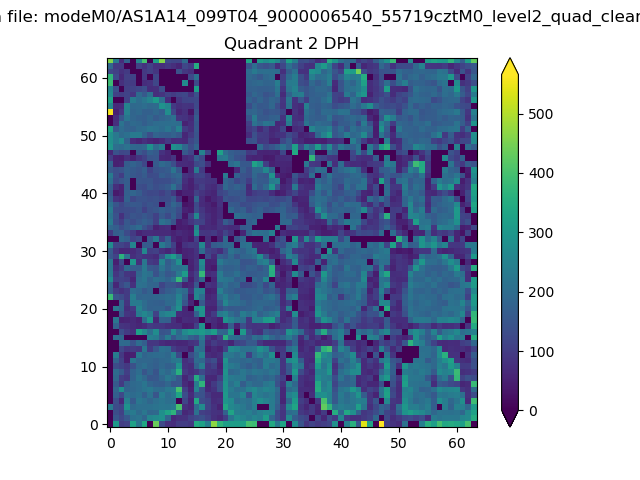 |
Quadrant C |
| Plot type | Count rate plots | Images |
|---|---|---|
| Comparison with Poisson distribution Blue bars denote a histogram of data divided into 1 sec bins. Red curve is a Poisson curve with rate = median count rate of data. |
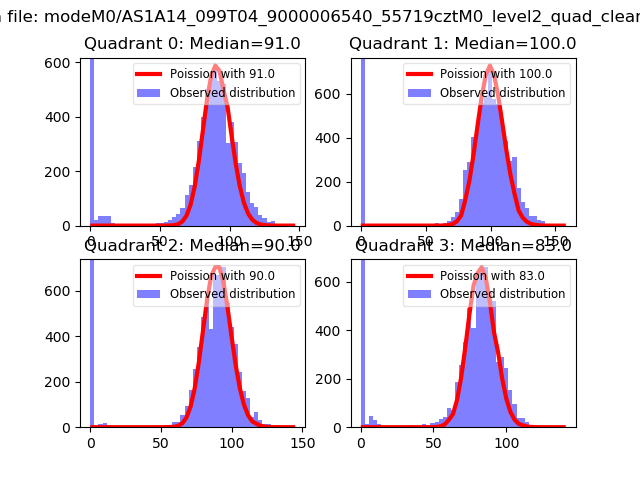 |
 |
| Quadrant-wise count rates Data is divided into 100 sec bins |
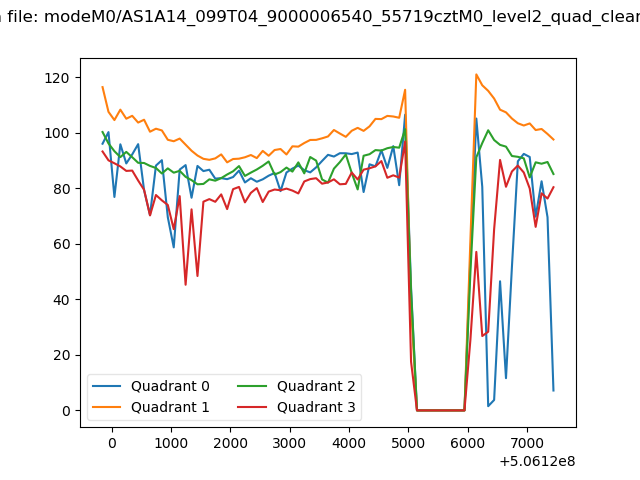 |
|
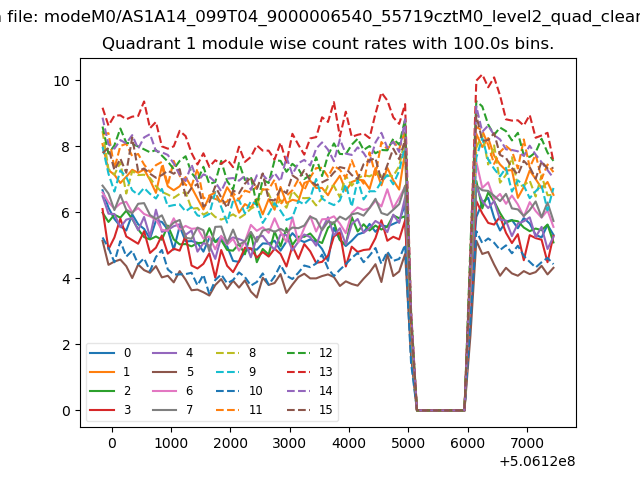
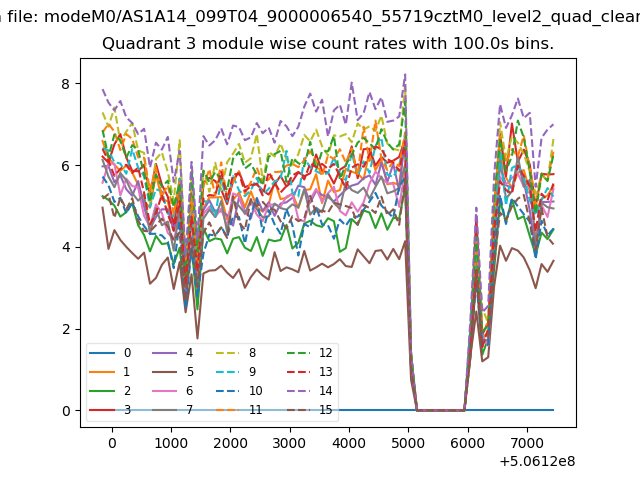
| Module-wise count rates for Quadrant A Data is divided into 100 sec bins |
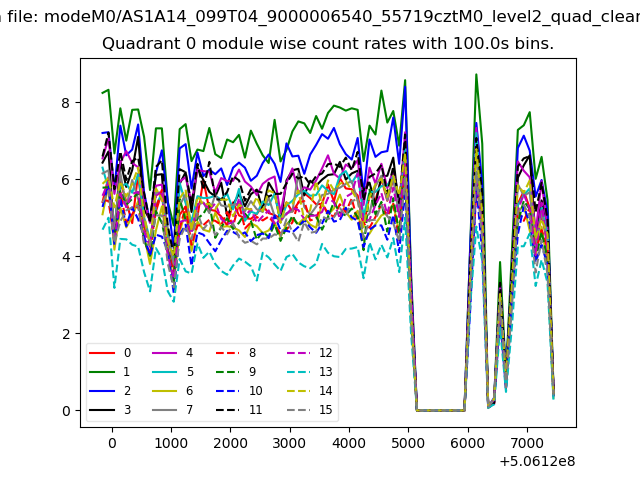 |
 |
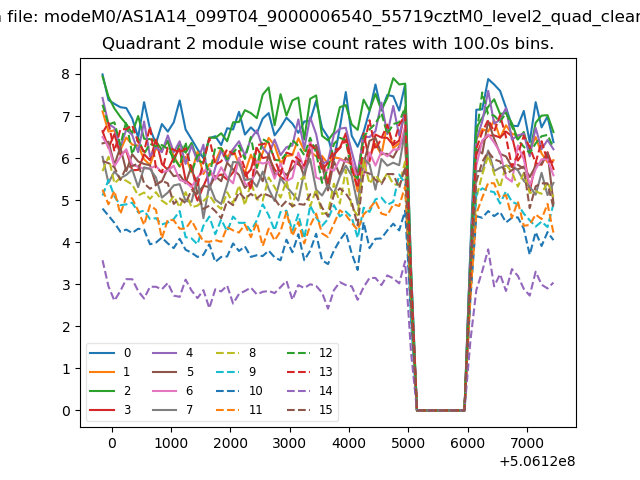
| Module-wise count rates for Quadrant B Data is divided into 100 sec bins |
 |
 |
| Module-wise count rates for Quadrant C Data is divided into 100 sec bins |
 |
 |
| Module-wise count rates for Quadrant D Data is divided into 100 sec bins |
 |
 |
| Parameter | Plot |
|---|---|
| CZT HV Monitor | 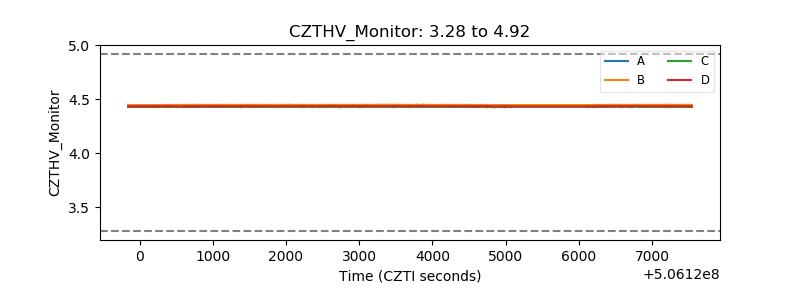 |
| D_VDD | 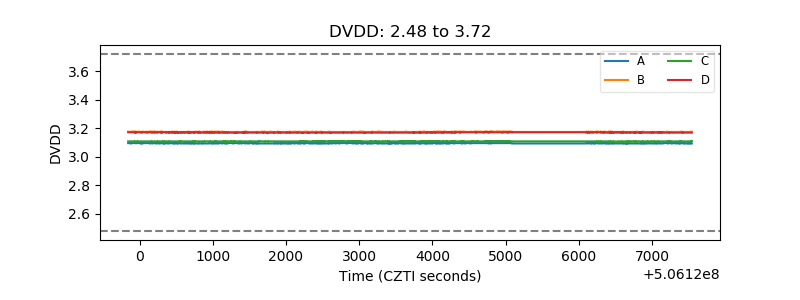 |
| Temperature 1 | 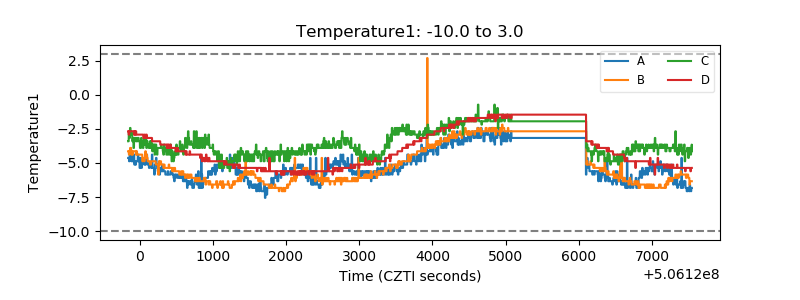 |
| Veto HV Monitor | 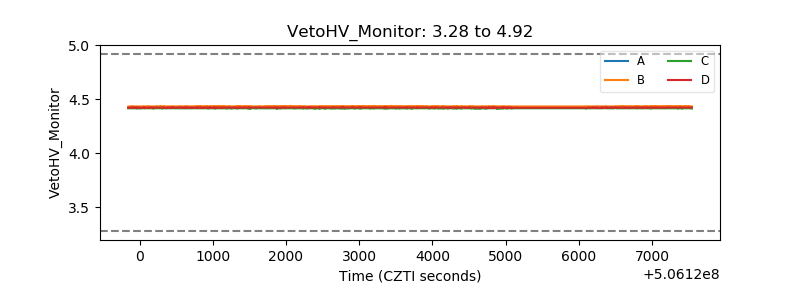 |
| Veto LLD | 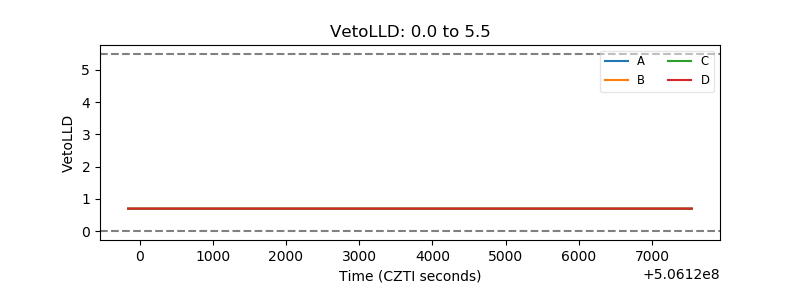 |
| Alpha Counter | 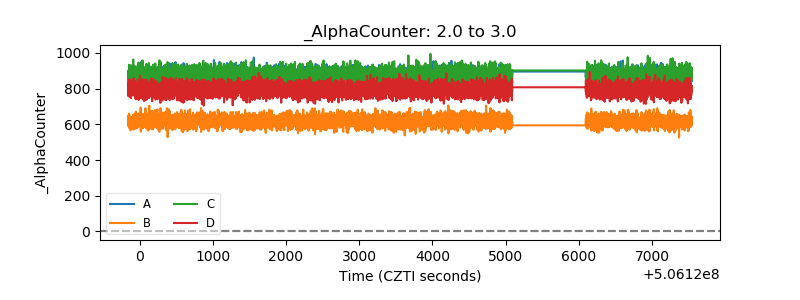 |
| _CPM_Rate | 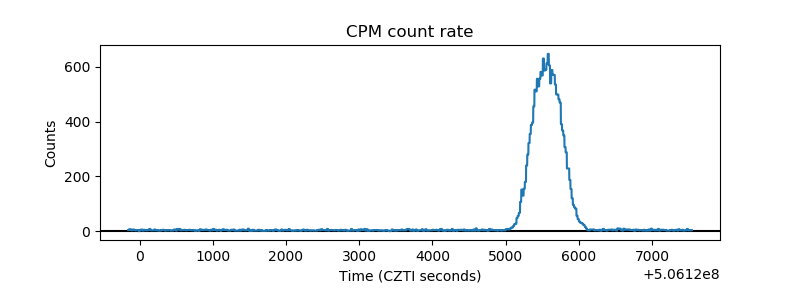 |
| CZT Counter | 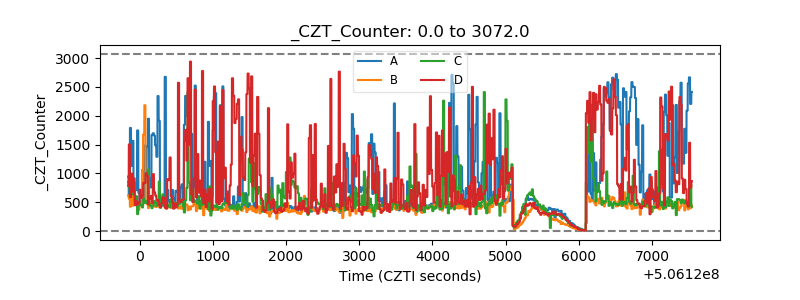 |
| +2.5 Volts monitor |  |
| +5 Volts monitor |  |
| _ROLL_ROT | 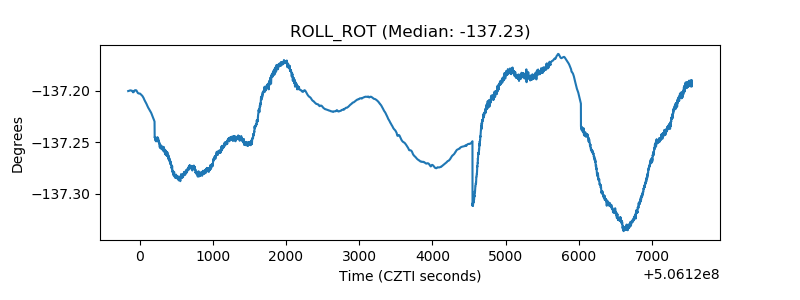 |
| _Roll_DEC | 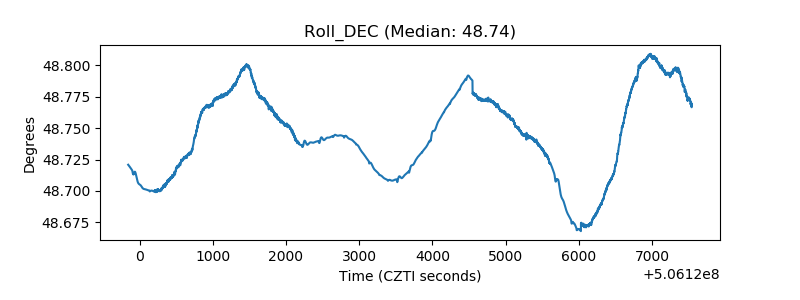 |
| _Roll_RA | 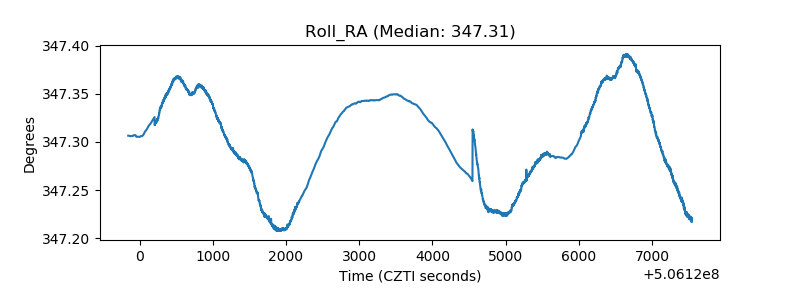 |
| Veto Counter | 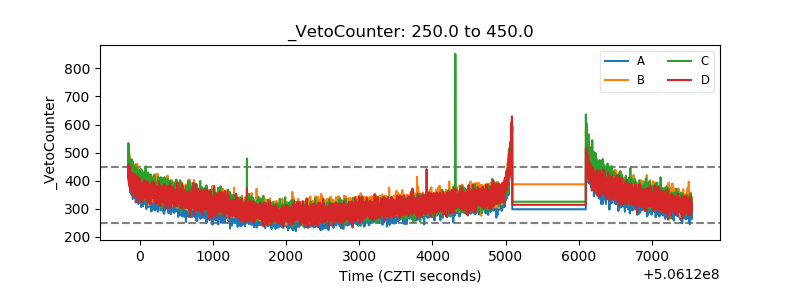 |