| Param | Original file | Final file |
|---|---|---|
| Filename | modeM0/AS1A14_099T04_9000006540_55720cztM0_level2.fits | modeM0/AS1A14_099T04_9000006540_55720cztM0_level2_quad_clean.evt |
| Size (bytes) | 679,144,320 | 87,361,920 |
| Size | 647.7 MB | 83.3 MB |
| Events in quadrant A | 10,378,003 | 418,539 |
| Events in quadrant B | 3,017,964 | 695,576 |
| Events in quadrant C | 4,854,433 | 524,351 |
| Events in quadrant D | 6,363,757 | 535,031 |
| Mode M0 | |||
|---|---|---|---|
| Quadrant | BADHDUFLAG | Total packets | Discarded packets |
| A | 0 | 35510 | 2 |
| B | 0 | 13979 | 2 |
| C | 0 | 19360 | 2 |
| D | 0 | 23694 | 2 |
| Mode M9 | |||
|---|---|---|---|
| Quadrant | BADHDUFLAG | Total packets | Discarded packets |
| A | 0 | 21 | 0 |
| B | 0 | 21 | 0 |
| C | 0 | 21 | 0 |
| D | 0 | 21 | 0 |
| Mode SS | |||
|---|---|---|---|
| Quadrant | BADHDUFLAG | Total packets | Discarded packets |
| A | 0 | 138 | 0 |
| B | 0 | 138 | 0 |
| C | 0 | 138 | 0 |
| D | 0 | 138 | 0 |
| Quadrant | Total seconds | Saturated seconds | Saturation percentage |
|---|---|---|---|
| A | 6768 | 2709 | 40.026596% |
| B | 6767 | 75 | 1.108320% |
| C | 6768 | 1205 | 17.804374% |
| D | 6768 | 732 | 10.815603% |
Noise dominated data is calculated using 1-second bins in cleaned event files. If a bin has >2000 counts, and if more than 50% of those come from <1% of pixels, then it is considered to be noise-dominated and hence unusable.
| Quadrant | # 1 sec bins | Bins with >0 counts | Bins with >2000 counts | High rate bins dominated by noise | Noise dominated (total time) | Noise dominated (detector-on time) | Marked lightcurve |
|---|---|---|---|---|---|---|---|
| A | 8883 | 6770 | 2276 | 2276 | 25.62% | 33.62% | 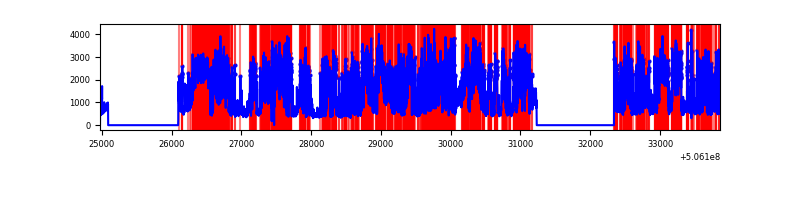 |
| B | 8882 | 6769 | 8 | 8 | 0.09% | 0.12% | 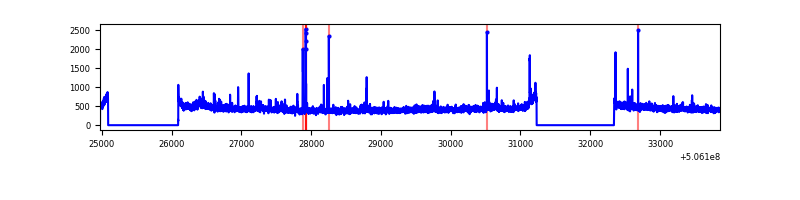 |
| C | 8882 | 6769 | 400 | 400 | 4.50% | 5.91% | 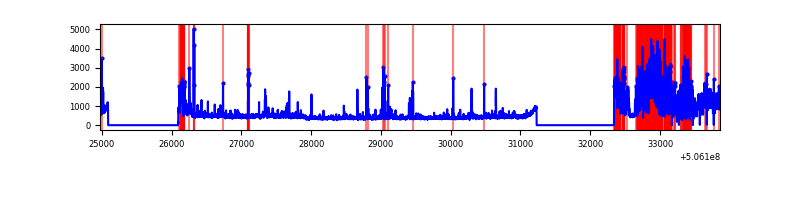 |
| D | 8883 | 6770 | 622 | 622 | 7.00% | 9.19% | 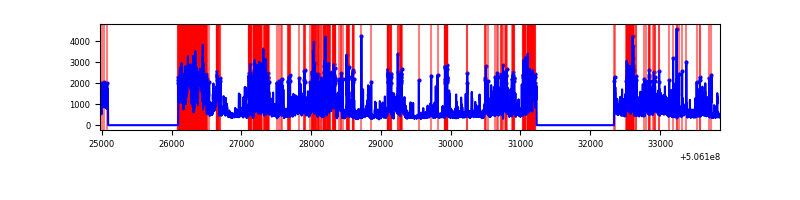 |
Top three noisy pixels from each quadrant. If the there are fewer than three noisy pixels in the level2.evt file, extra rows are filled as -1
| Pixel properties | Quadrant properties | ||||||
|---|---|---|---|---|---|---|---|
| Quadrant | DetID | PixID | Counts | Sigma | Mean | Median | Sigma |
| A | 15 | 32 | 7319477 | 50463.99 | 589 | 574 | 145.0 |
| A | 12 | 115 | 232700 | 1600.51 | 589 | 574 | 145.0 |
| A | 0 | 8 | 172423 | 1184.9 | 589 | 574 | 145.0 |
| B | 0 | 199 | 80581 | 514.93 | 721 | 693 | 155.1 |
| B | 4 | 206 | 20689 | 128.89 | 721 | 693 | 155.1 |
| B | 7 | 0 | 19360 | 120.32 | 721 | 693 | 155.1 |
| C | 15 | 199 | 1730349 | 10196.66 | 618 | 612 | 169.6 |
| C | 15 | 177 | 210412 | 1236.75 | 618 | 612 | 169.6 |
| C | 9 | 38 | 183285 | 1076.84 | 618 | 612 | 169.6 |
| D | 11 | 129 | 3121164 | 16186.49 | 677 | 645 | 192.8 |
| D | 8 | 245 | 294262 | 1523.03 | 677 | 645 | 192.8 |
| D | 6 | 239 | 72288 | 371.62 | 677 | 645 | 192.8 |
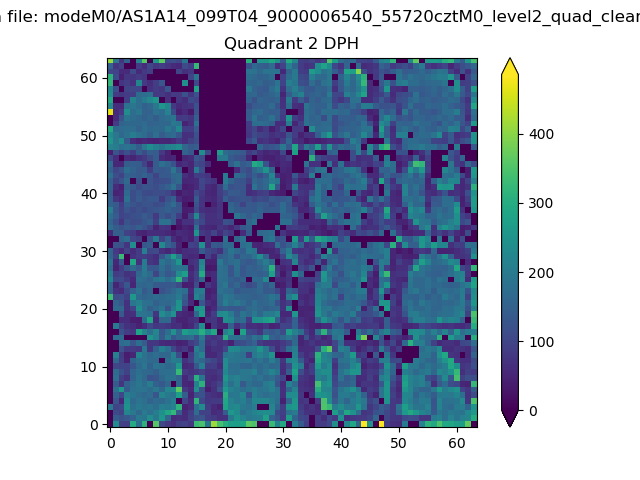
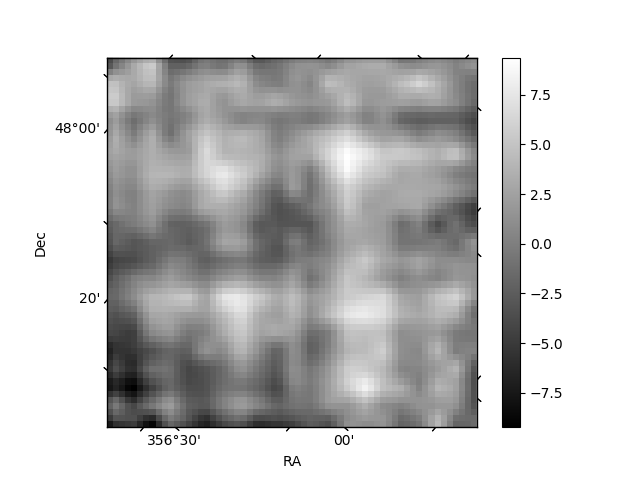
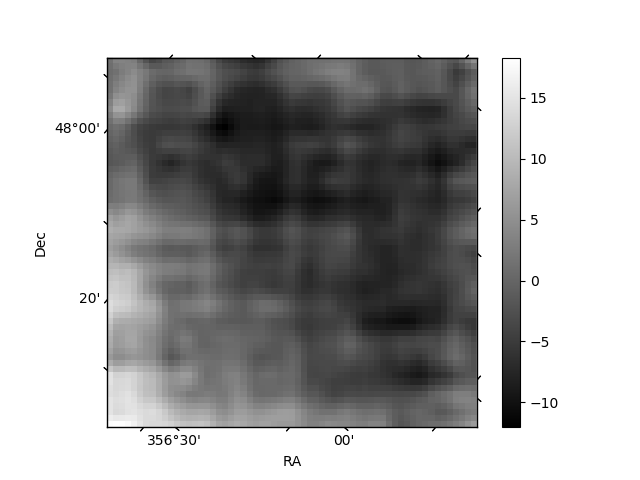
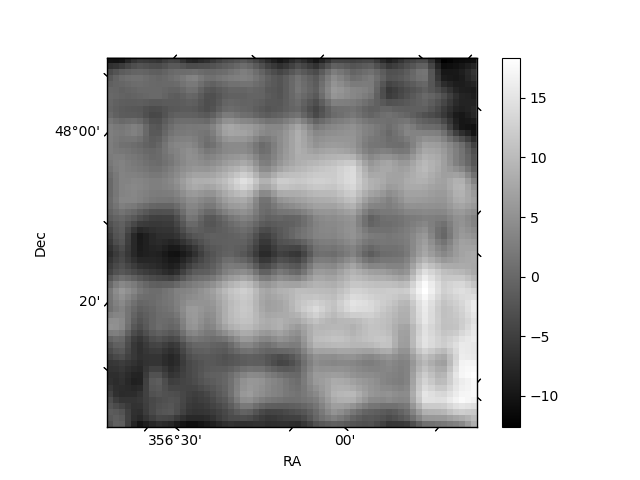
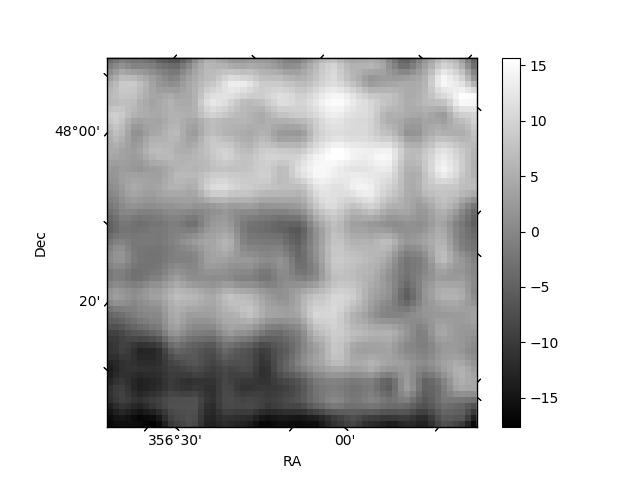
Histogram calculated using DETX and DETY for each event in the final _common_clean file
| Quadrant A | 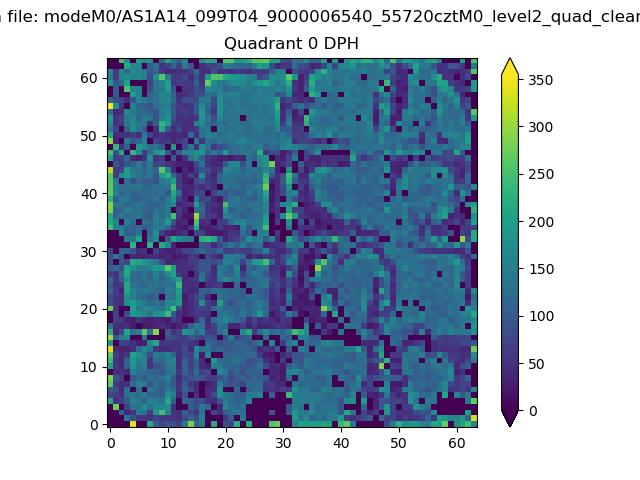 |
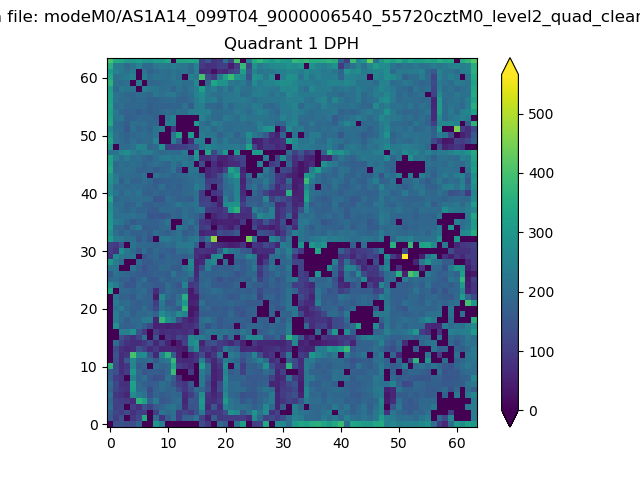 |
Quadrant B |
|---|---|---|---|
| Quadrant D | 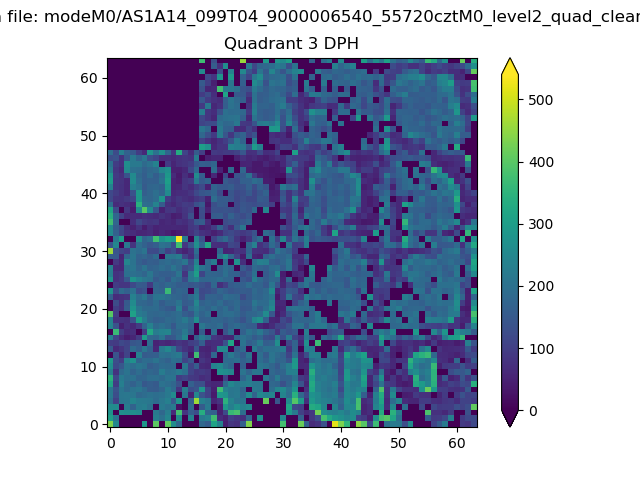 |
 |
Quadrant C |
| Plot type | Count rate plots | Images |
|---|---|---|
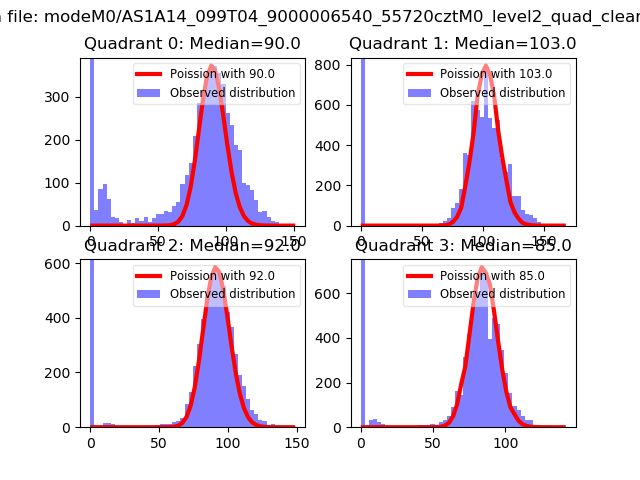
| Comparison with Poisson distribution Blue bars denote a histogram of data divided into 1 sec bins. Red curve is a Poisson curve with rate = median count rate of data. |
 |
 |
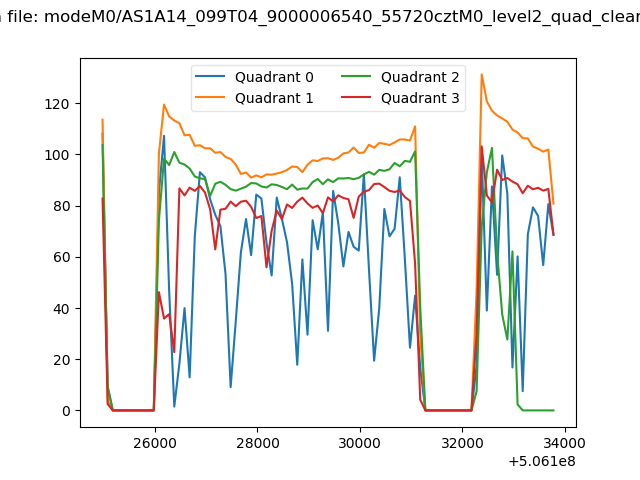
| Quadrant-wise count rates Data is divided into 100 sec bins |
 |
|
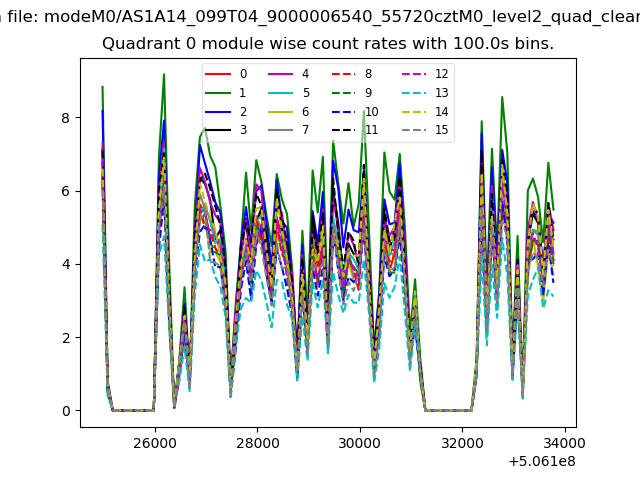
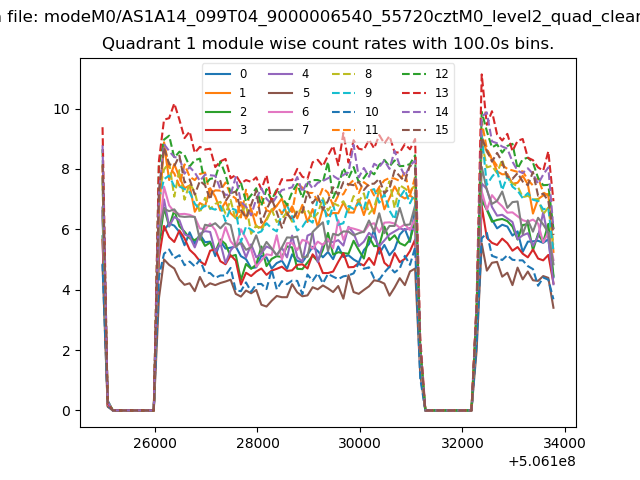
| Module-wise count rates for Quadrant A Data is divided into 100 sec bins |
 |
 |
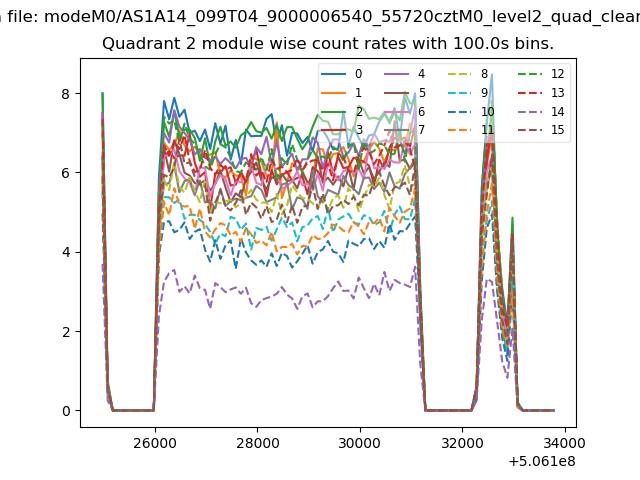
| Module-wise count rates for Quadrant B Data is divided into 100 sec bins |
 |
 |
| Module-wise count rates for Quadrant C Data is divided into 100 sec bins |
 |
 |
| Module-wise count rates for Quadrant D Data is divided into 100 sec bins |
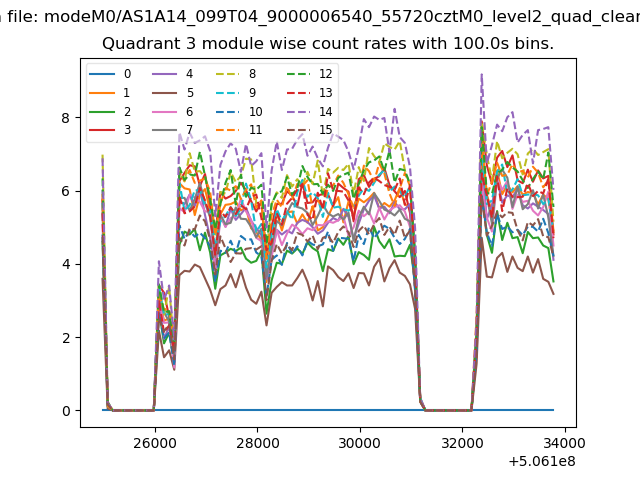 |
 |
| Parameter | Plot |
|---|---|
| CZT HV Monitor | 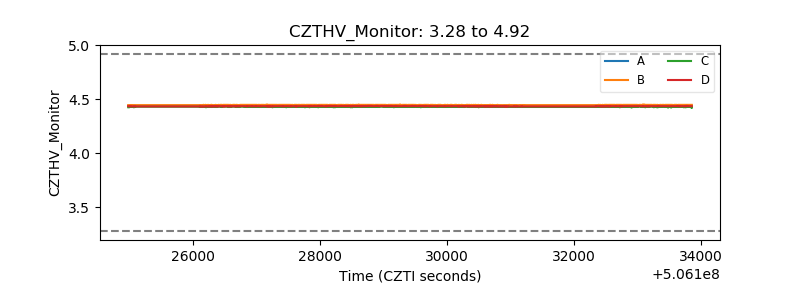 |
| D_VDD | 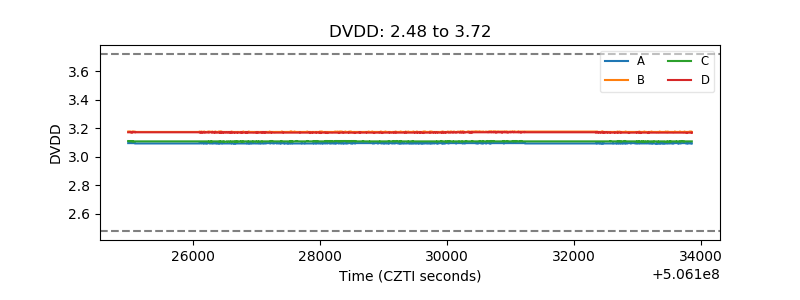 |
| Temperature 1 | 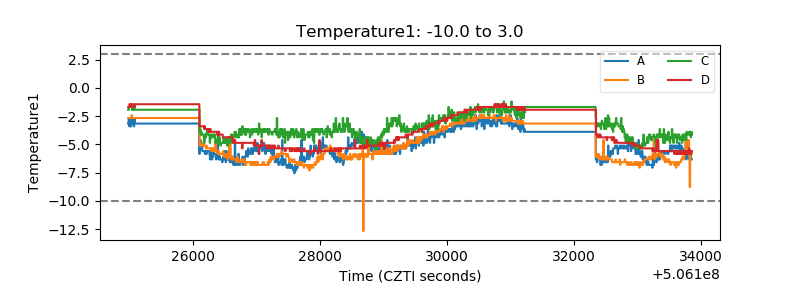 |
| Veto HV Monitor | 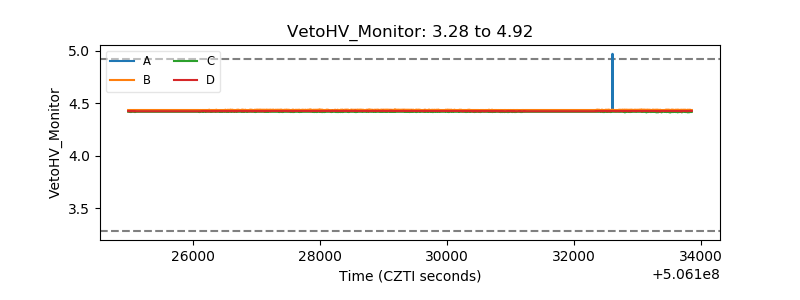 |
| Veto LLD | 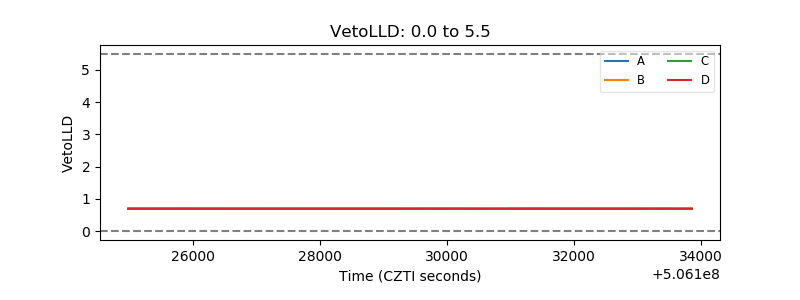 |
| Alpha Counter | 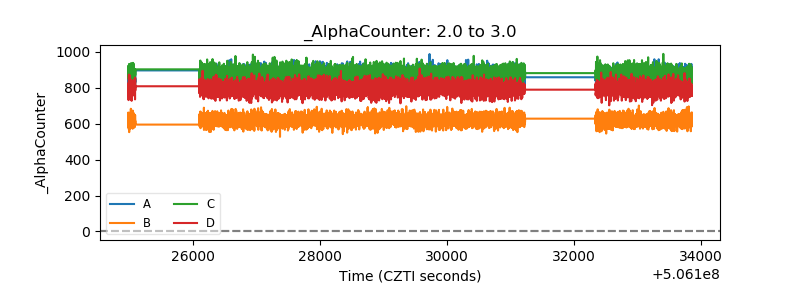 |
| _CPM_Rate | 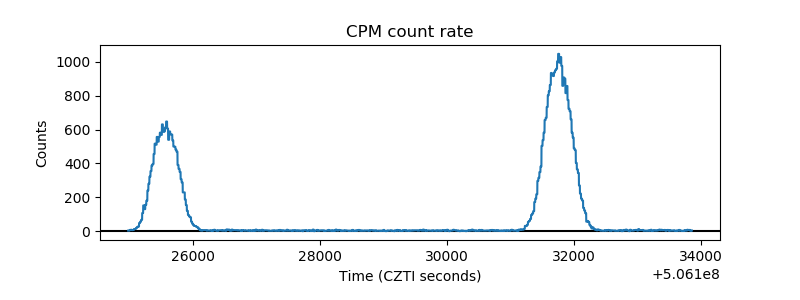 |
| CZT Counter | 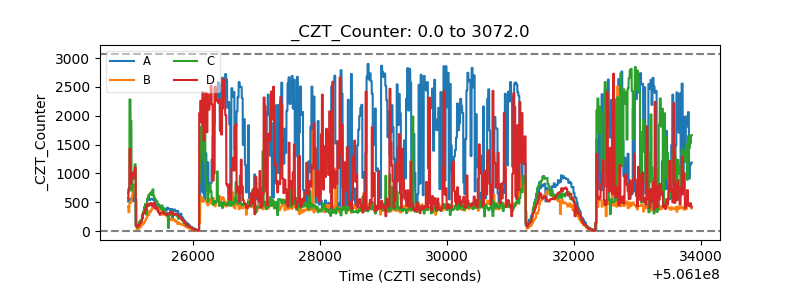 |
| +2.5 Volts monitor |  |
| +5 Volts monitor |  |
| _ROLL_ROT | 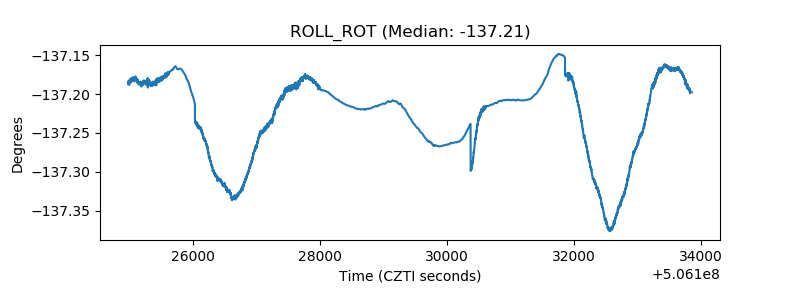 |
| _Roll_DEC | 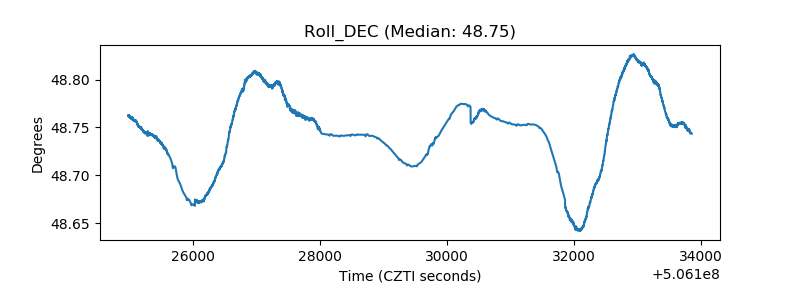 |
| _Roll_RA | 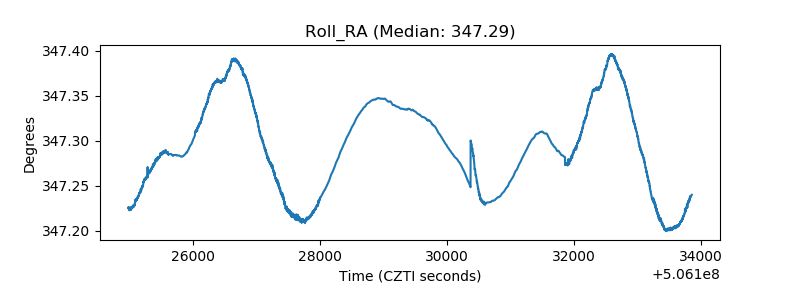 |
| Veto Counter | 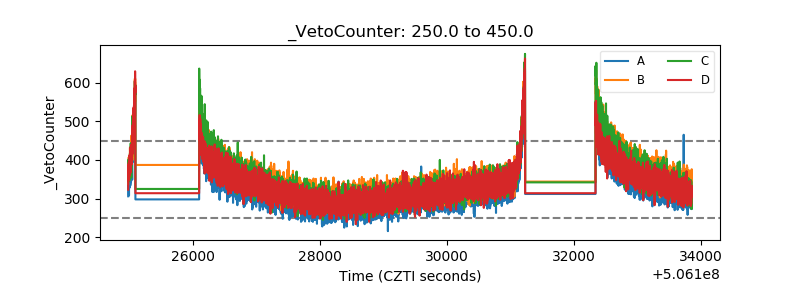 |