| Param | Original file | Final file |
|---|---|---|
| Filename | modeM0/AS1A14_099T04_9000006540_55721cztM0_level2.fits | modeM0/AS1A14_099T04_9000006540_55721cztM0_level2_quad_clean.evt |
| Size (bytes) | 817,467,840 | 77,791,680 |
| Size | 779.6 MB | 74.2 MB |
| Events in quadrant A | 10,082,060 | 414,860 |
| Events in quadrant B | 3,164,231 | 695,430 |
| Events in quadrant C | 11,791,340 | 218,475 |
| Events in quadrant D | 4,713,159 | 568,956 |
| Mode M0 | |||
|---|---|---|---|
| Quadrant | BADHDUFLAG | Total packets | Discarded packets |
| A | 0 | 34473 | 2 |
| B | 0 | 14113 | 2 |
| C | 0 | 39518 | 2 |
| D | 0 | 18708 | 2 |
| Mode M9 | |||
|---|---|---|---|
| Quadrant | BADHDUFLAG | Total packets | Discarded packets |
| A | 0 | 14 | 0 |
| B | 0 | 14 | 0 |
| C | 0 | 15 | 0 |
| D | 0 | 15 | 0 |
| Mode SS | |||
|---|---|---|---|
| Quadrant | BADHDUFLAG | Total packets | Discarded packets |
| A | 0 | 132 | 0 |
| B | 0 | 132 | 0 |
| C | 0 | 132 | 0 |
| D | 0 | 132 | 0 |
| Quadrant | Total seconds | Saturated seconds | Saturation percentage |
|---|---|---|---|
| A | 6564 | 2654 | 40.432663% |
| B | 6564 | 71 | 1.081658% |
| C | 6564 | 4529 | 68.997562% |
| D | 6564 | 338 | 5.149299% |
Noise dominated data is calculated using 1-second bins in cleaned event files. If a bin has >2000 counts, and if more than 50% of those come from <1% of pixels, then it is considered to be noise-dominated and hence unusable.
| Quadrant | # 1 sec bins | Bins with >0 counts | Bins with >2000 counts | High rate bins dominated by noise | Noise dominated (total time) | Noise dominated (detector-on time) | Marked lightcurve |
|---|---|---|---|---|---|---|---|
| A | 7714 | 6565 | 2269 | 2269 | 29.41% | 34.56% | 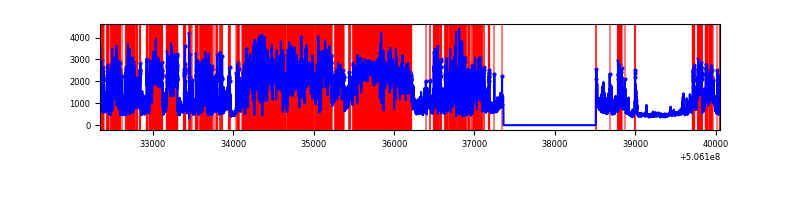 |
| B | 7714 | 6565 | 1 | 1 | 0.01% | 0.02% | 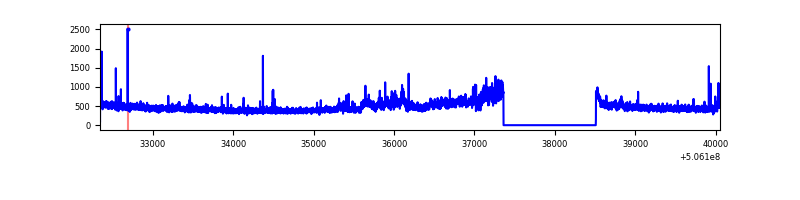 |
| C | 7714 | 6565 | 2928 | 2928 | 37.96% | 44.60% | 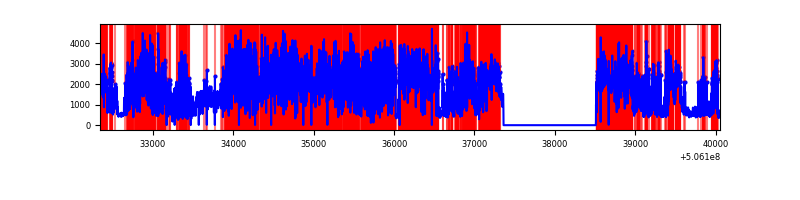 |
| D | 7714 | 6565 | 314 | 314 | 4.07% | 4.78% | 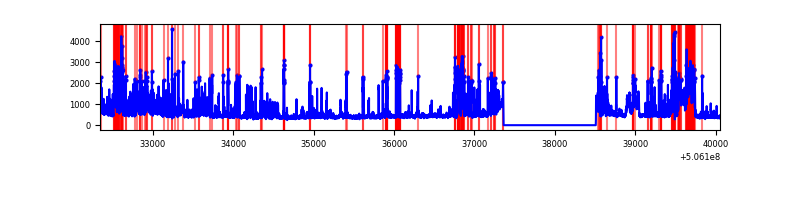 |
Top three noisy pixels from each quadrant. If the there are fewer than three noisy pixels in the level2.evt file, extra rows are filled as -1
| Pixel properties | Quadrant properties | ||||||
|---|---|---|---|---|---|---|---|
| Quadrant | DetID | PixID | Counts | Sigma | Mean | Median | Sigma |
| A | 15 | 32 | 4833262 | 33424.45 | 587 | 574 | 144.6 |
| A | 12 | 115 | 2336142 | 16153.55 | 587 | 574 | 144.6 |
| A | 0 | 8 | 211826 | 1461.09 | 587 | 574 | 144.6 |
| B | 4 | 206 | 308514 | 2026.28 | 709 | 682 | 151.9 |
| B | 0 | 199 | 21473 | 136.86 | 709 | 682 | 151.9 |
| B | 12 | 111 | 18370 | 116.43 | 709 | 682 | 151.9 |
| C | 15 | 199 | 10114709 | 102917.41 | 354 | 350 | 98.3 |
| C | 15 | 177 | 132520 | 1344.88 | 354 | 350 | 98.3 |
| C | 9 | 38 | 57023 | 576.67 | 354 | 350 | 98.3 |
| D | 11 | 129 | 1458919 | 7576.83 | 679 | 649 | 192.5 |
| D | 8 | 245 | 319055 | 1654.36 | 679 | 649 | 192.5 |
| D | 14 | 49 | 103882 | 536.37 | 679 | 649 | 192.5 |
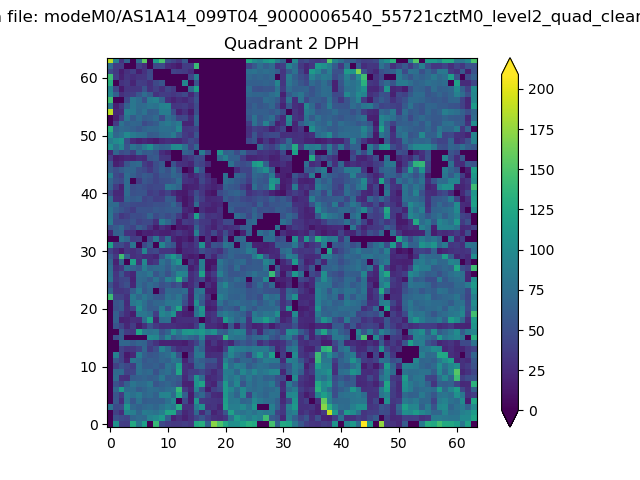
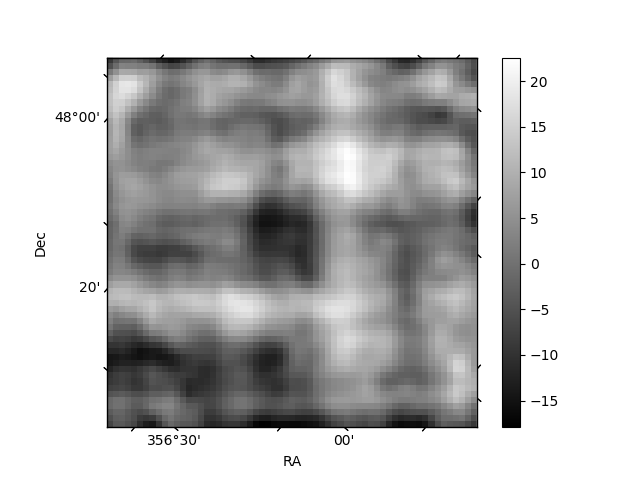
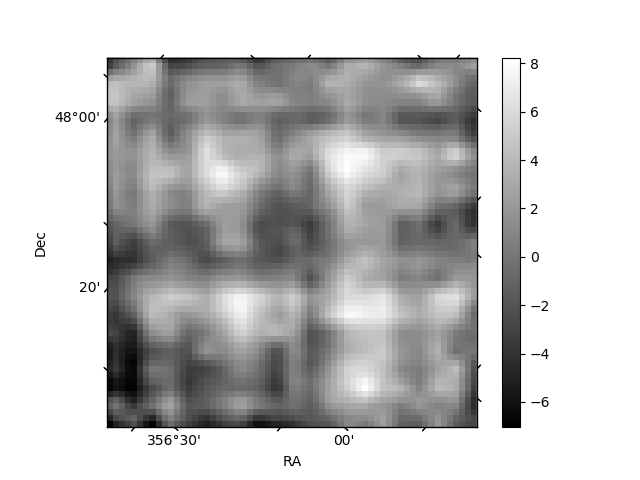
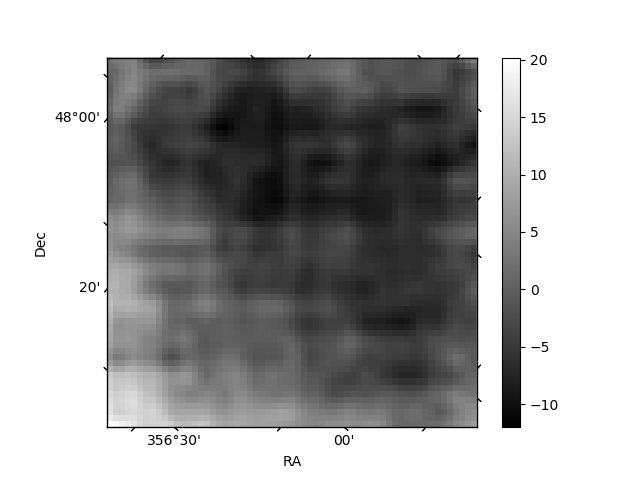
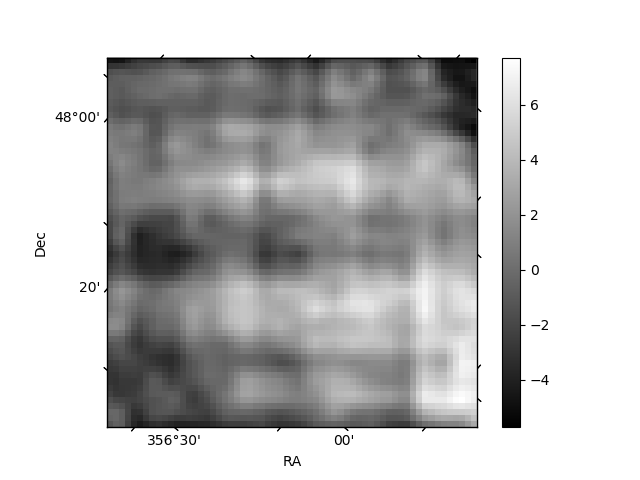
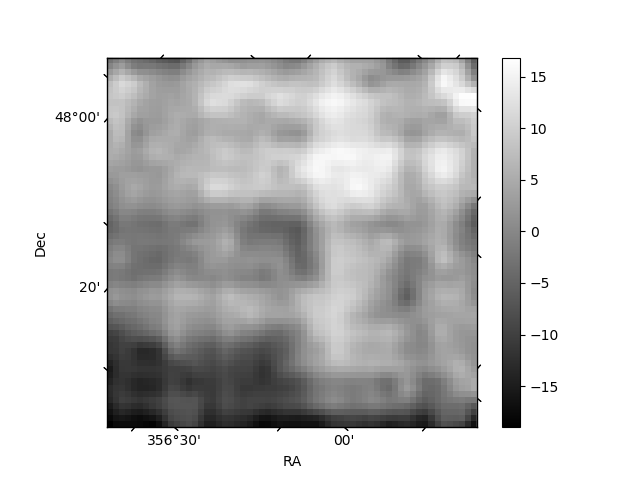
Histogram calculated using DETX and DETY for each event in the final _common_clean file
| Quadrant A | 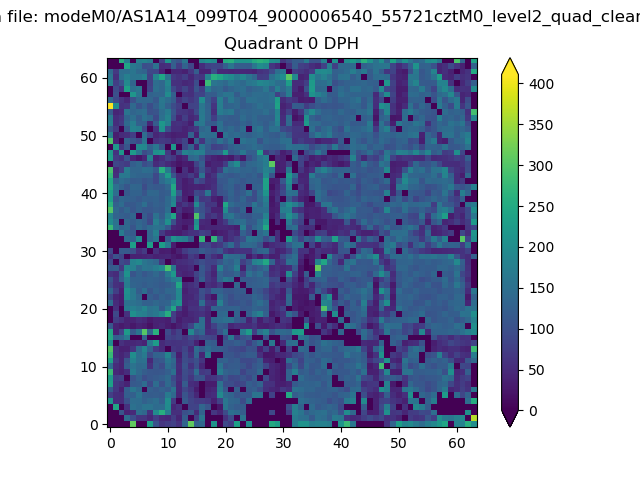 |
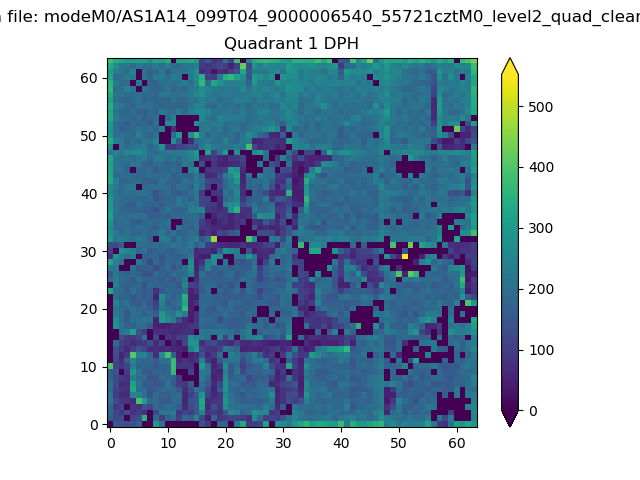 |
Quadrant B |
|---|---|---|---|
| Quadrant D | 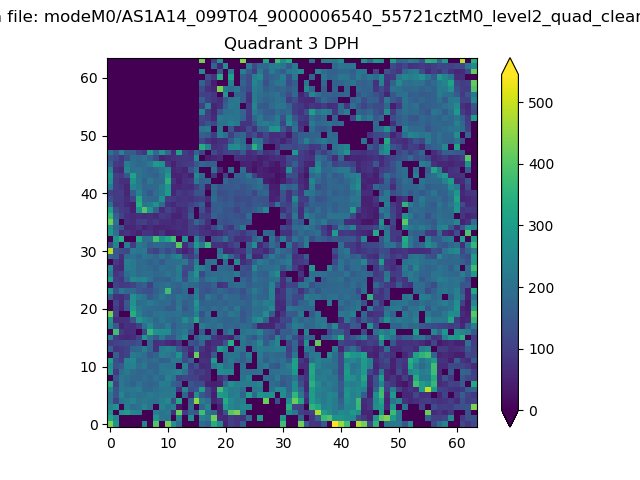 |
 |
Quadrant C |
| Plot type | Count rate plots | Images |
|---|---|---|
| Comparison with Poisson distribution Blue bars denote a histogram of data divided into 1 sec bins. Red curve is a Poisson curve with rate = median count rate of data. |
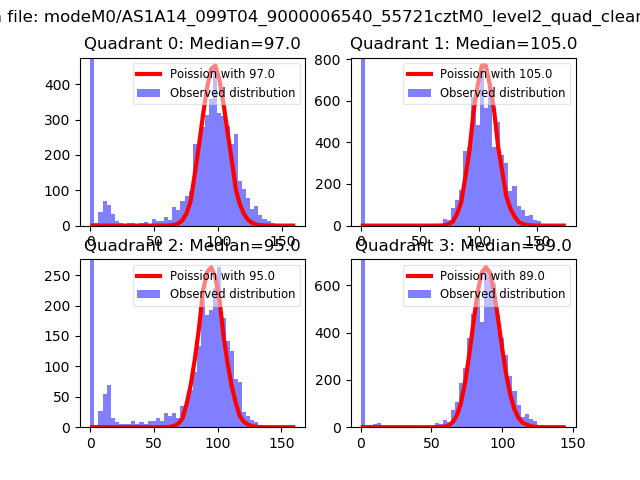 |
 |
| Quadrant-wise count rates Data is divided into 100 sec bins |
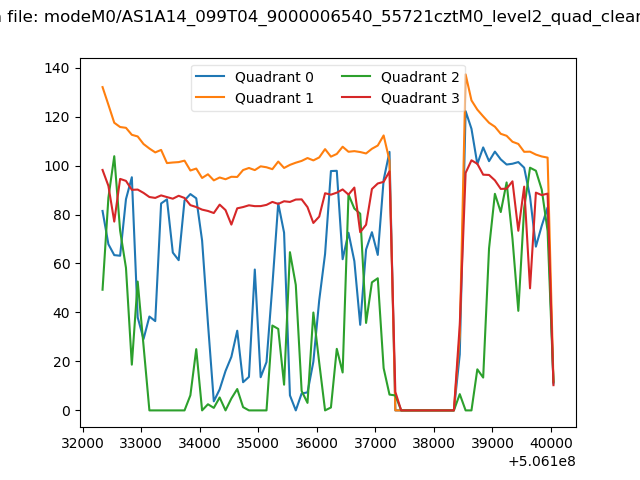 |
|
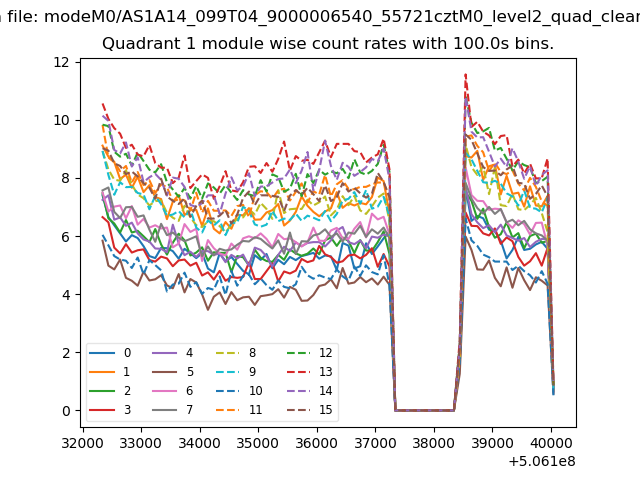
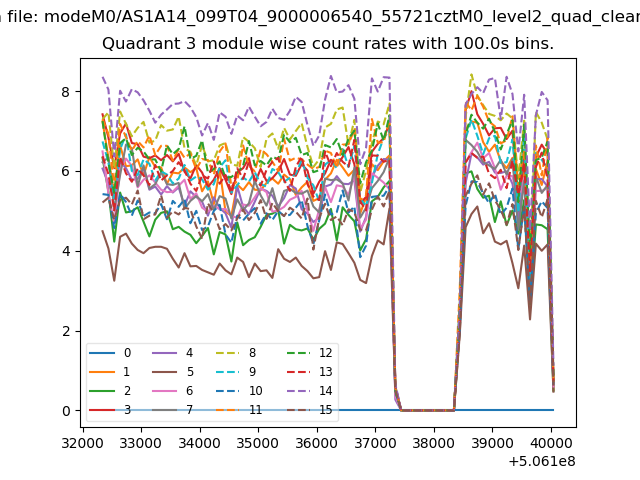
| Module-wise count rates for Quadrant A Data is divided into 100 sec bins |
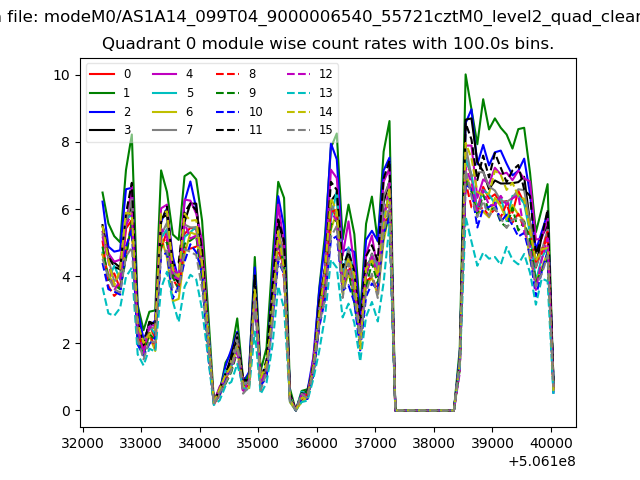 |
 |
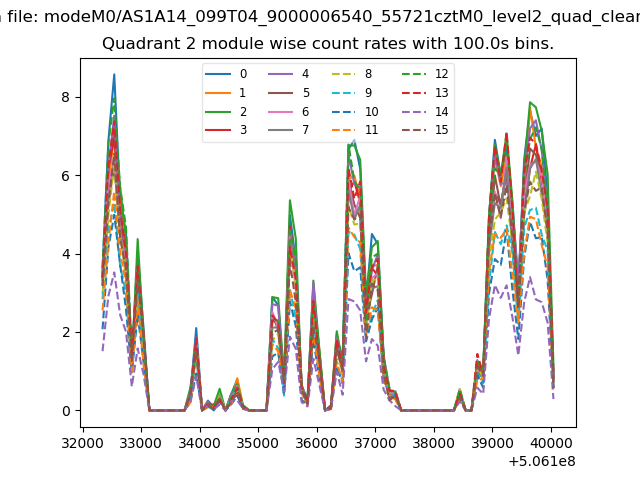
| Module-wise count rates for Quadrant B Data is divided into 100 sec bins |
 |
 |
| Module-wise count rates for Quadrant C Data is divided into 100 sec bins |
 |
 |
| Module-wise count rates for Quadrant D Data is divided into 100 sec bins |
 |
 |
| Parameter | Plot |
|---|---|
| CZT HV Monitor | 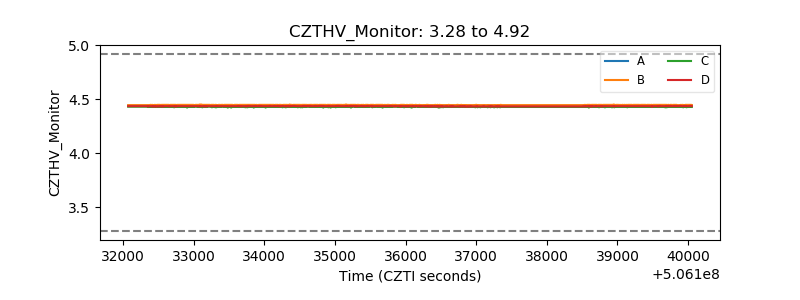 |
| D_VDD | 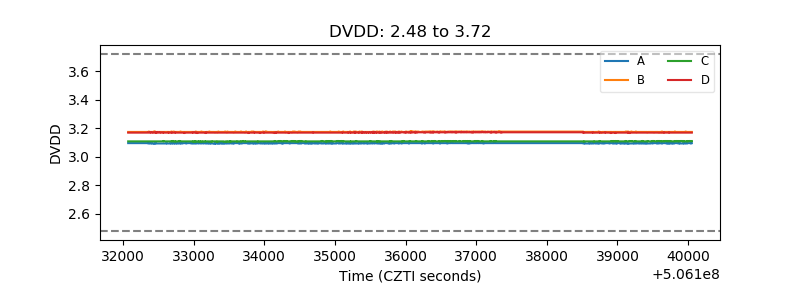 |
| Temperature 1 | 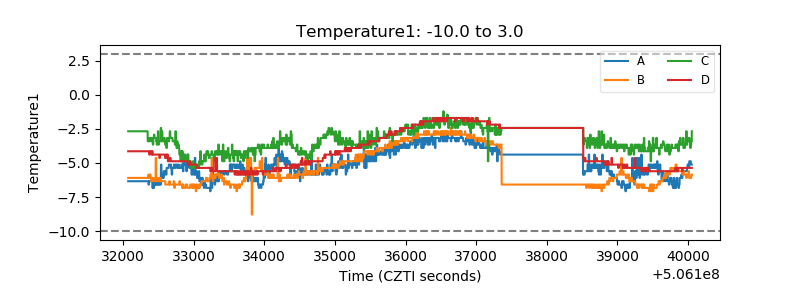 |
| Veto HV Monitor | 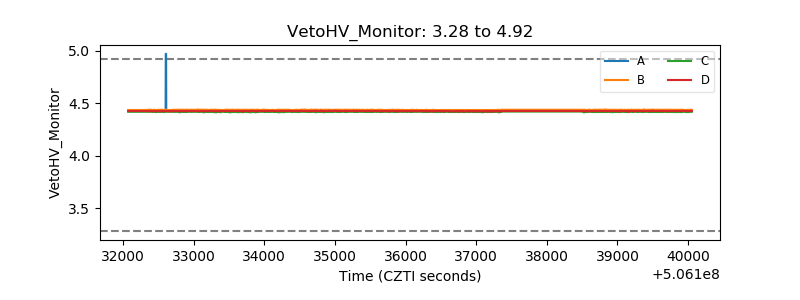 |
| Veto LLD | 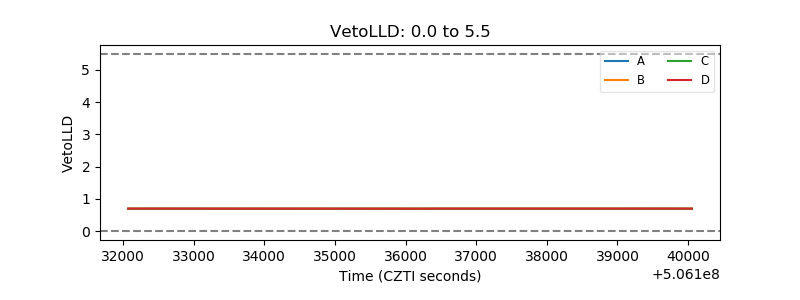 |
| Alpha Counter | 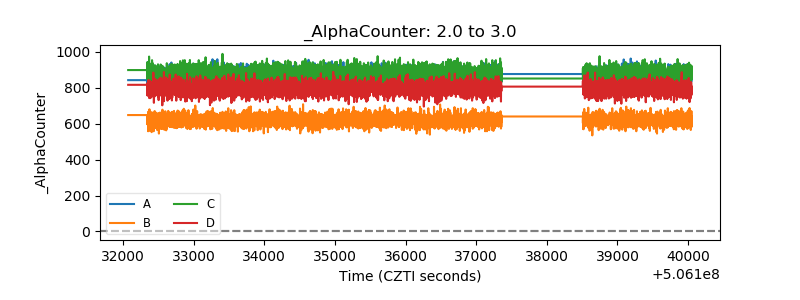 |
| _CPM_Rate | 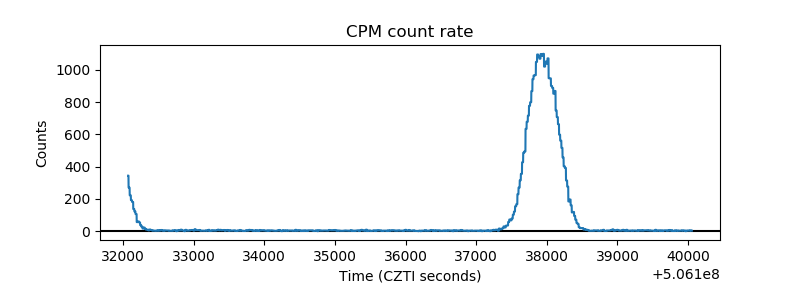 |
| CZT Counter | 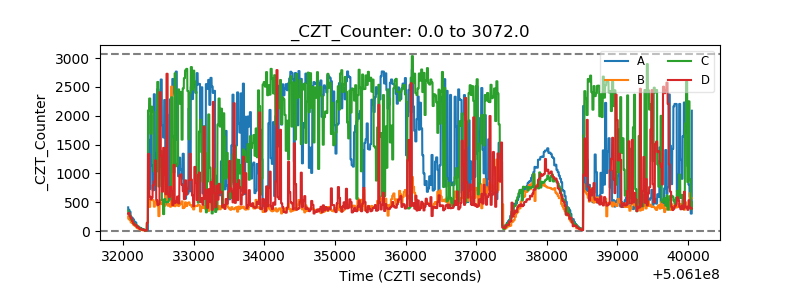 |
| +2.5 Volts monitor |  |
| +5 Volts monitor |  |
| _ROLL_ROT | 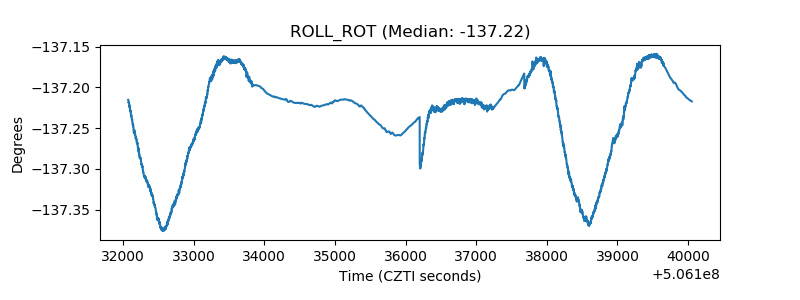 |
| _Roll_DEC | 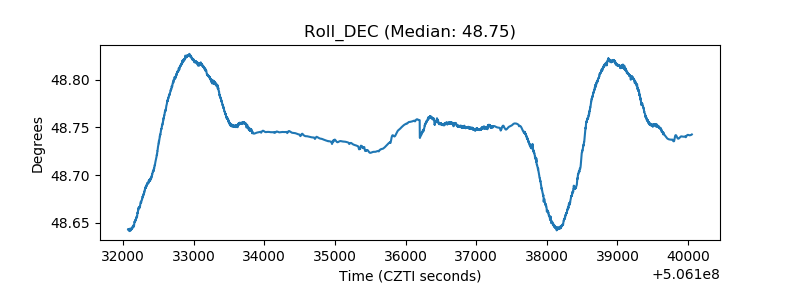 |
| _Roll_RA | 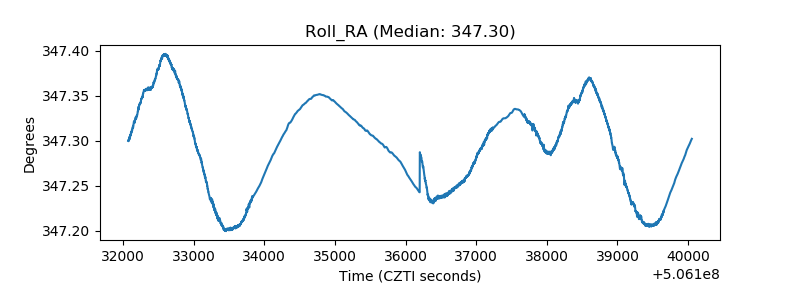 |
| Veto Counter | 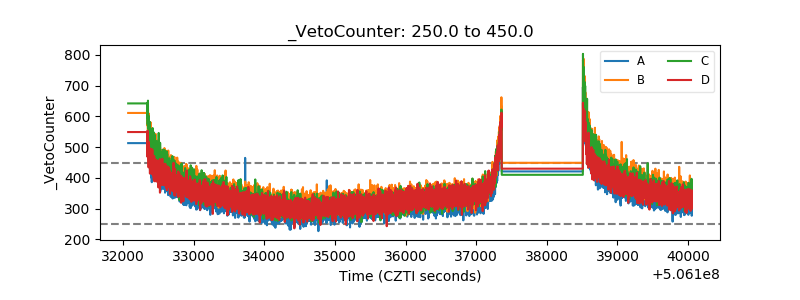 |