| Param | Original file | Final file |
|---|---|---|
| Filename | modeM0/AS1A14_099T04_9000006540_55722cztM0_level2.fits | modeM0/AS1A14_099T04_9000006540_55722cztM0_level2_quad_clean.evt |
| Size (bytes) | 773,467,200 | 79,758,720 |
| Size | 737.6 MB | 76.1 MB |
| Events in quadrant A | 8,475,925 | 506,164 |
| Events in quadrant B | 3,372,137 | 700,893 |
| Events in quadrant C | 9,271,195 | 246,631 |
| Events in quadrant D | 7,003,188 | 504,320 |
| Mode M0 | |||
|---|---|---|---|
| Quadrant | BADHDUFLAG | Total packets | Discarded packets |
| A | 0 | 29629 | 2 |
| B | 0 | 14503 | 2 |
| C | 0 | 32068 | 2 |
| D | 0 | 25394 | 2 |
| Mode M9 | |||
|---|---|---|---|
| Quadrant | BADHDUFLAG | Total packets | Discarded packets |
| A | 0 | 12 | 0 |
| B | 0 | 12 | 0 |
| C | 0 | 12 | 0 |
| D | 0 | 12 | 0 |
| Mode SS | |||
|---|---|---|---|
| Quadrant | BADHDUFLAG | Total packets | Discarded packets |
| A | 0 | 132 | 0 |
| B | 0 | 132 | 0 |
| C | 0 | 132 | 0 |
| D | 0 | 132 | 0 |
| Quadrant | Total seconds | Saturated seconds | Saturation percentage |
|---|---|---|---|
| A | 6554 | 1745 | 26.624962% |
| B | 6555 | 111 | 1.693364% |
| C | 6555 | 4162 | 63.493516% |
| D | 6555 | 1170 | 17.848970% |
Noise dominated data is calculated using 1-second bins in cleaned event files. If a bin has >2000 counts, and if more than 50% of those come from <1% of pixels, then it is considered to be noise-dominated and hence unusable.
| Quadrant | # 1 sec bins | Bins with >0 counts | Bins with >2000 counts | High rate bins dominated by noise | Noise dominated (total time) | Noise dominated (detector-on time) | Marked lightcurve |
|---|---|---|---|---|---|---|---|
| A | 7714 | 6555 | 1603 | 1603 | 20.78% | 24.45% | 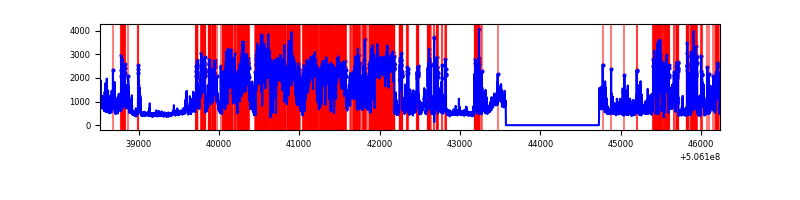 |
| B | 7715 | 6556 | 1 | 1 | 0.01% | 0.02% | 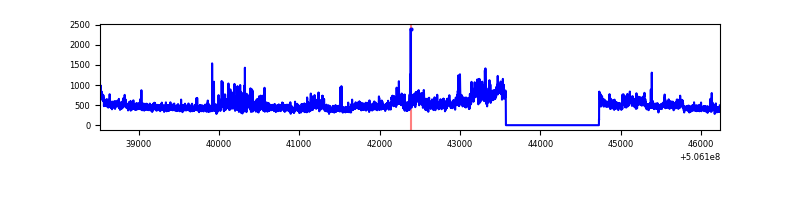 |
| C | 7715 | 6553 | 1900 | 1900 | 24.63% | 28.99% | 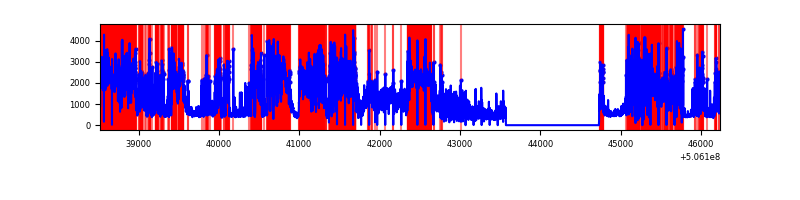 |
| D | 7715 | 6556 | 1053 | 1053 | 13.65% | 16.06% | 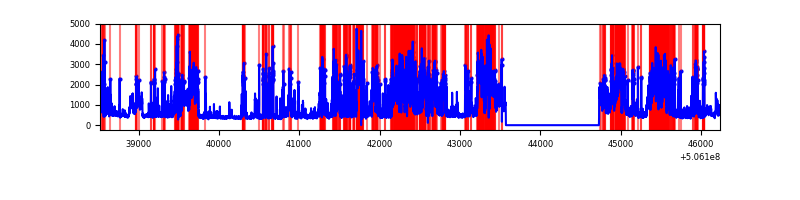 |
Top three noisy pixels from each quadrant. If the there are fewer than three noisy pixels in the level2.evt file, extra rows are filled as -1
| Pixel properties | Quadrant properties | ||||||
|---|---|---|---|---|---|---|---|
| Quadrant | DetID | PixID | Counts | Sigma | Mean | Median | Sigma |
| A | 12 | 115 | 2994860 | 18724.89 | 656 | 642 | 159.9 |
| A | 15 | 32 | 2611105 | 16325.01 | 656 | 642 | 159.9 |
| A | 8 | 192 | 153428 | 955.48 | 656 | 642 | 159.9 |
| B | 4 | 206 | 491779 | 3204.3 | 717 | 690 | 153.3 |
| B | 12 | 111 | 18390 | 115.49 | 717 | 690 | 153.3 |
| B | 11 | 111 | 17676 | 110.83 | 717 | 690 | 153.3 |
| C | 15 | 199 | 7581083 | 79087.36 | 341 | 339 | 95.9 |
| C | 14 | 96 | 81520 | 846.93 | 341 | 339 | 95.9 |
| C | 10 | 22 | 76032 | 789.68 | 341 | 339 | 95.9 |
| D | 11 | 129 | 3794546 | 20969.95 | 643 | 615 | 180.9 |
| D | 8 | 245 | 287900 | 1587.89 | 643 | 615 | 180.9 |
| D | 10 | 181 | 275775 | 1520.87 | 643 | 615 | 180.9 |
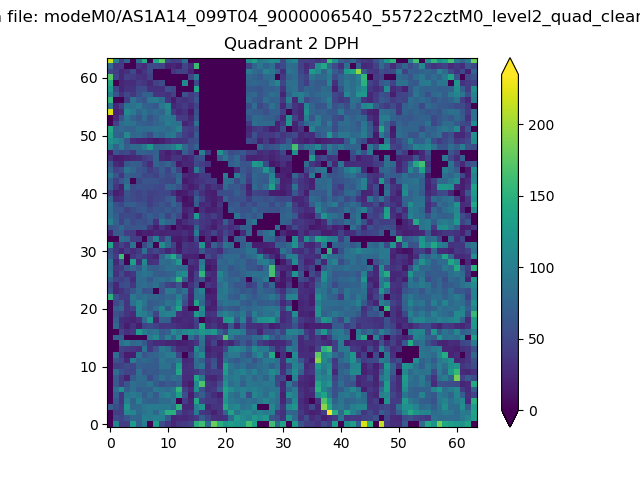
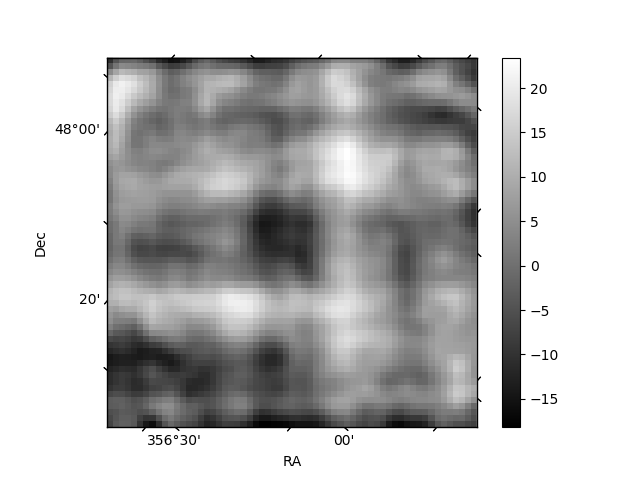
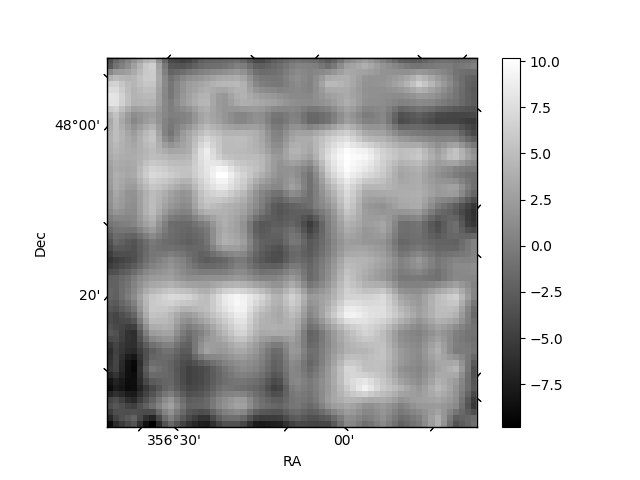
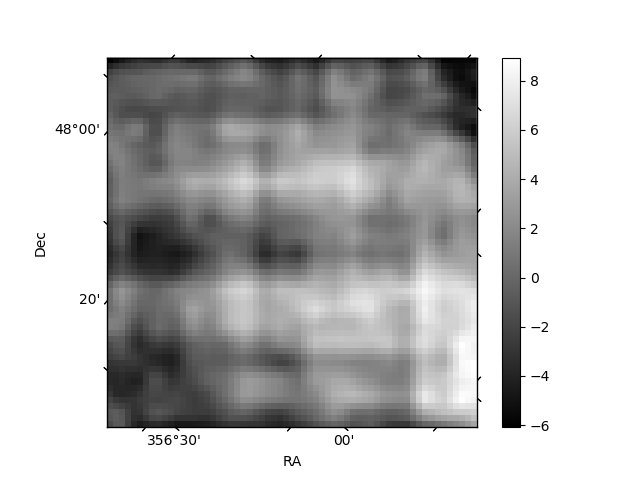
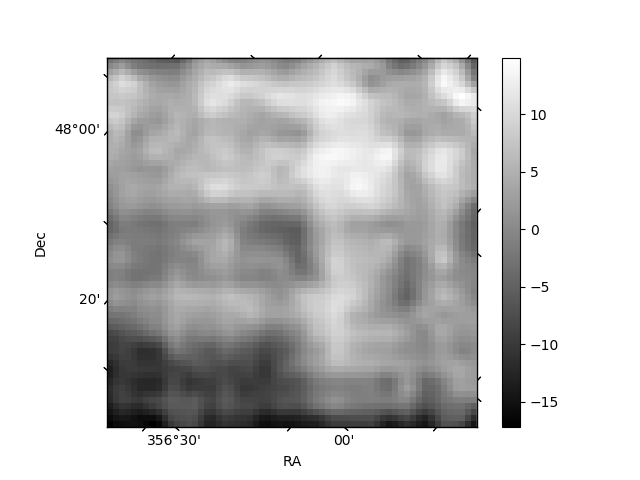
Histogram calculated using DETX and DETY for each event in the final _common_clean file
| Quadrant A | 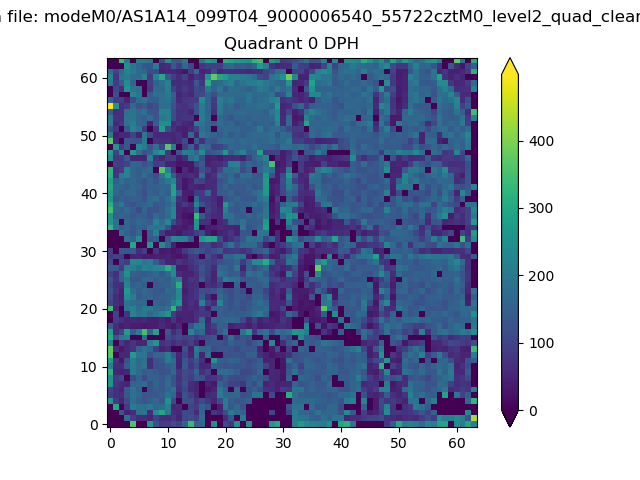 |
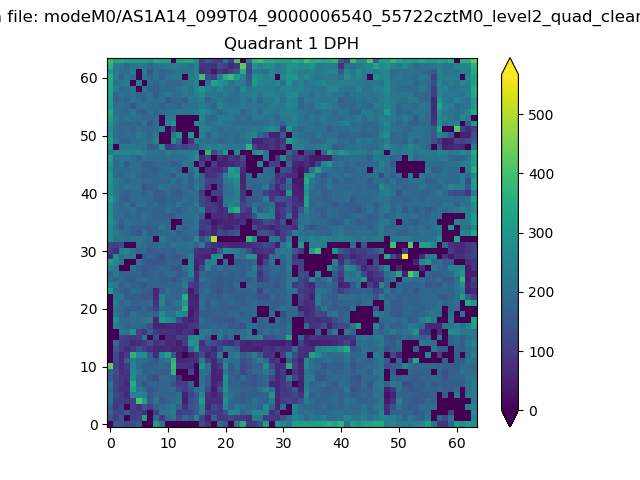 |
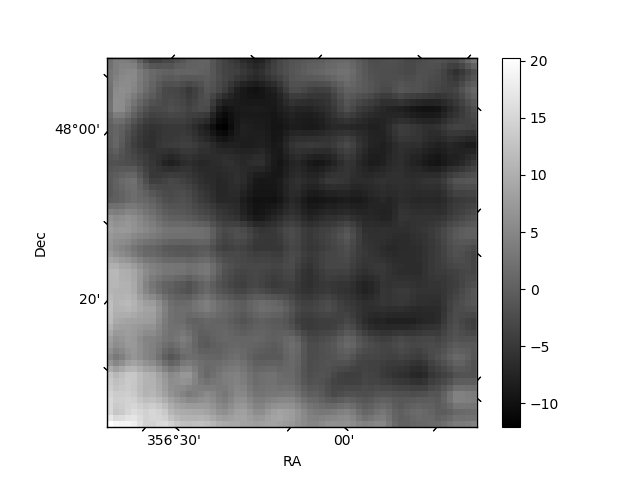
Quadrant B |
|---|---|---|---|
| Quadrant D | 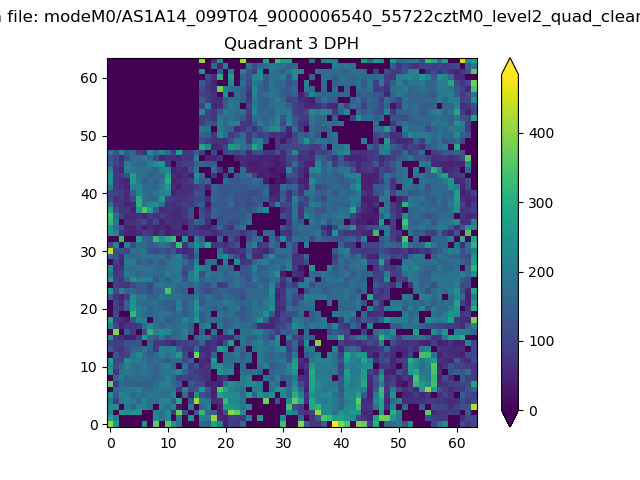 |
 |
Quadrant C |
| Plot type | Count rate plots | Images |
|---|---|---|
| Comparison with Poisson distribution Blue bars denote a histogram of data divided into 1 sec bins. Red curve is a Poisson curve with rate = median count rate of data. |
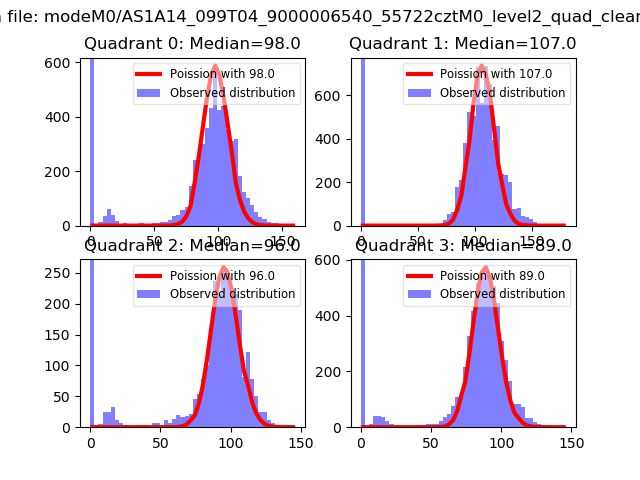 |
 |
| Quadrant-wise count rates Data is divided into 100 sec bins |
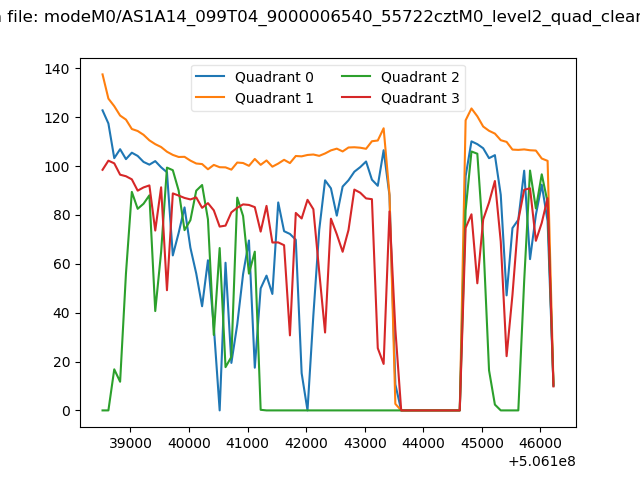 |
|
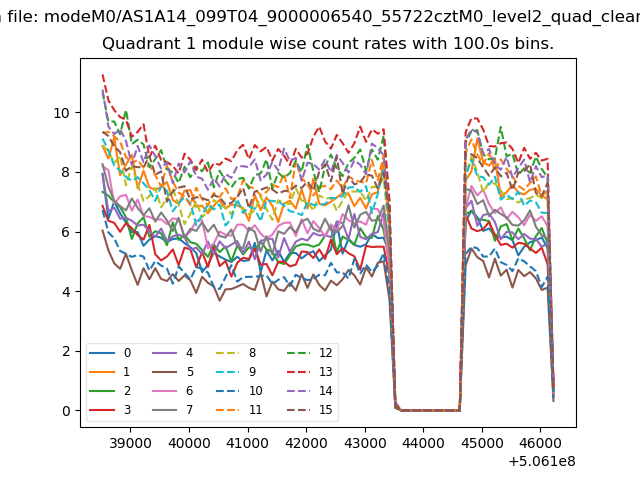
| Module-wise count rates for Quadrant A Data is divided into 100 sec bins |
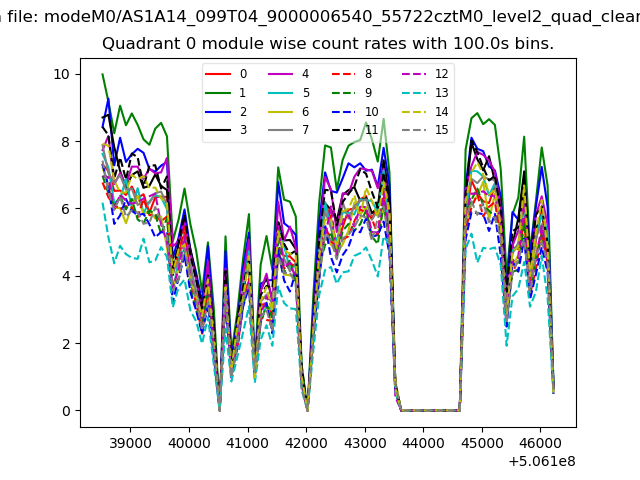 |
 |
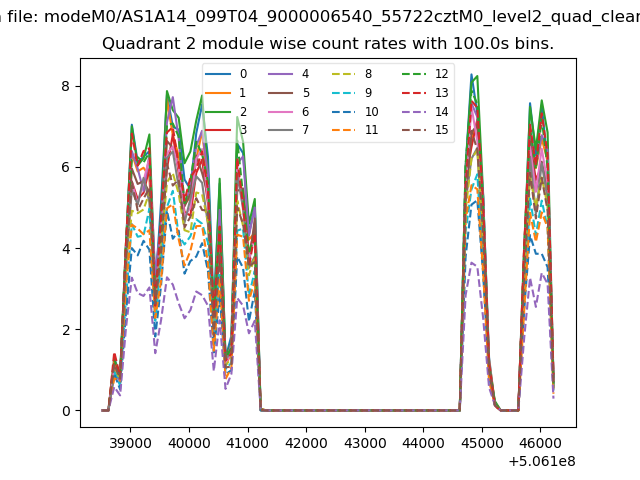
| Module-wise count rates for Quadrant B Data is divided into 100 sec bins |
 |
 |
| Module-wise count rates for Quadrant C Data is divided into 100 sec bins |
 |
 |
| Module-wise count rates for Quadrant D Data is divided into 100 sec bins |
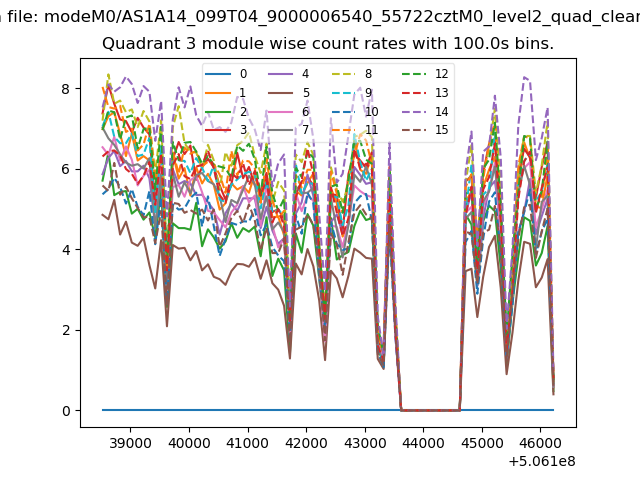 |
 |
| Parameter | Plot |
|---|---|
| CZT HV Monitor | 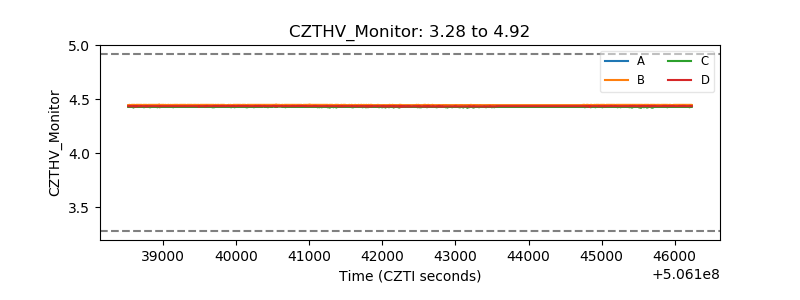 |
| D_VDD | 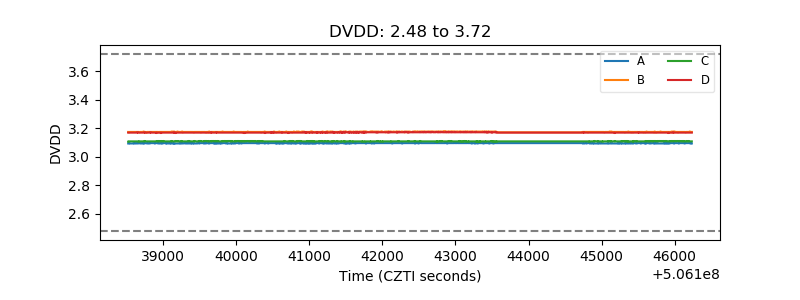 |
| Temperature 1 | 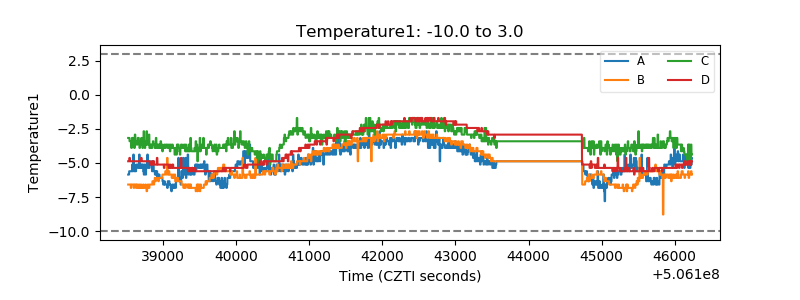 |
| Veto HV Monitor | 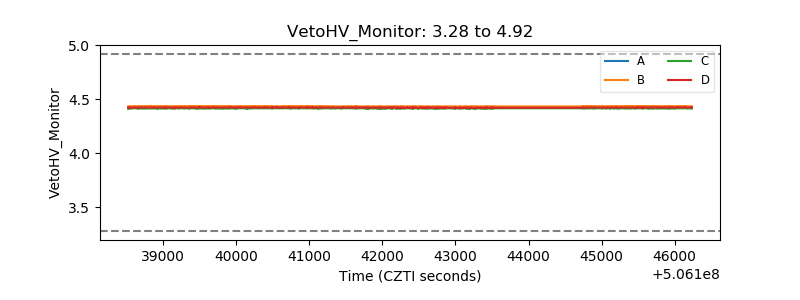 |
| Veto LLD | 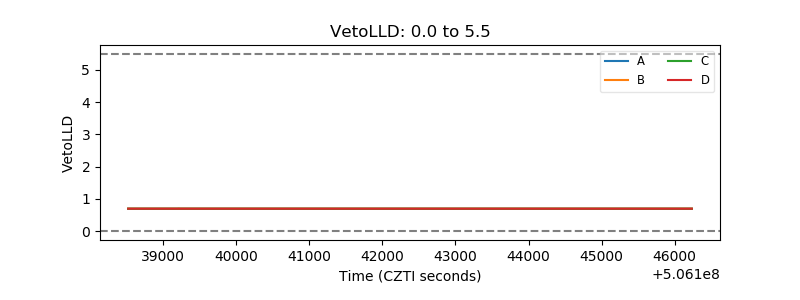 |
| Alpha Counter | 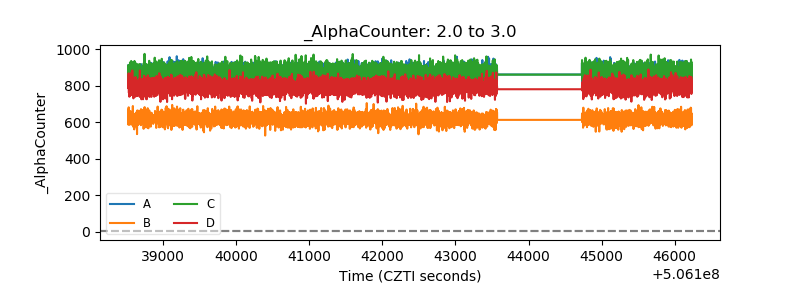 |
| _CPM_Rate | 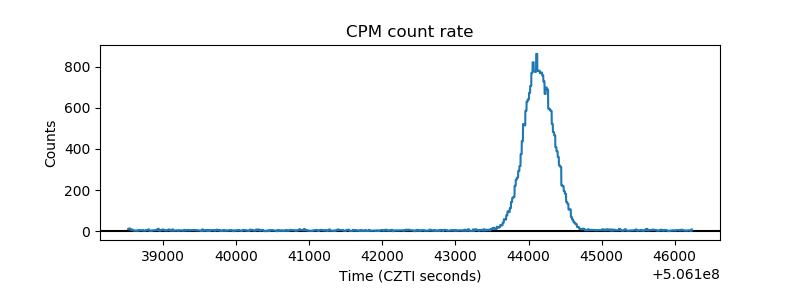 |
| CZT Counter | 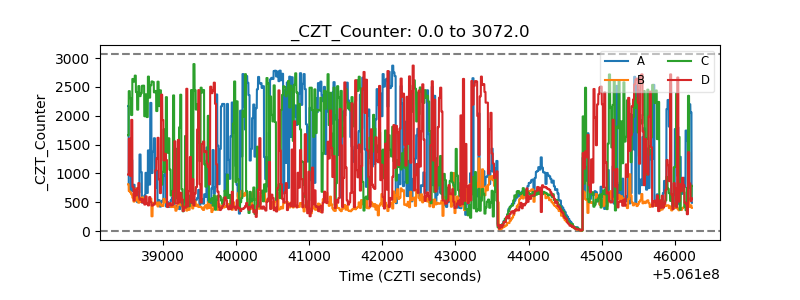 |
| +2.5 Volts monitor |  |
| +5 Volts monitor |  |
| _ROLL_ROT | 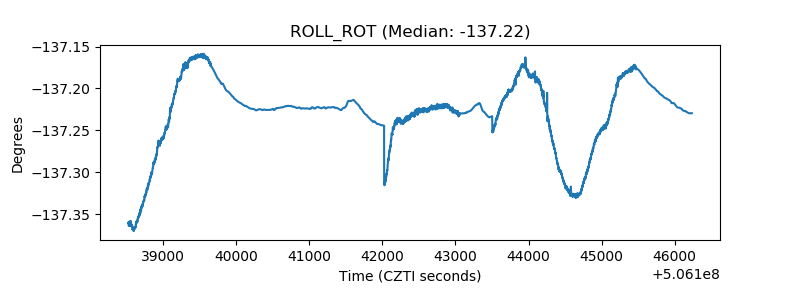 |
| _Roll_DEC | 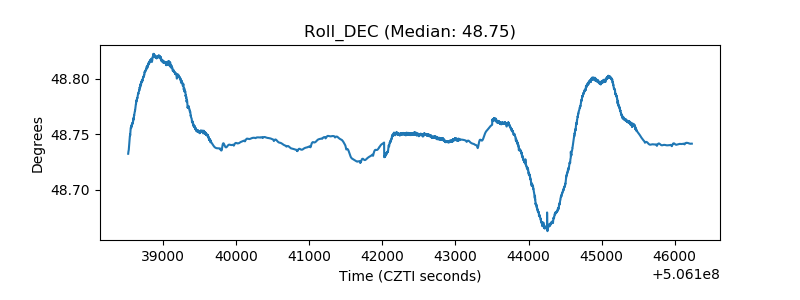 |
| _Roll_RA | 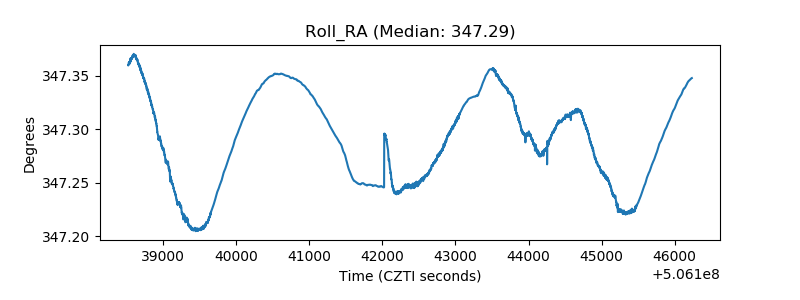 |
| Veto Counter | 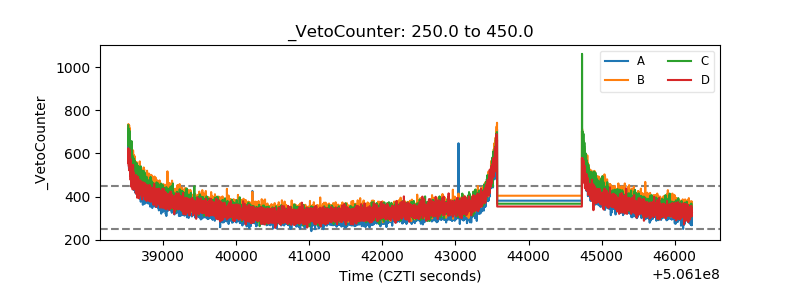 |