| Param | Original file | Final file |
|---|---|---|
| Filename | modeM0/AS1A14_099T04_9000006540_55724cztM0_level2.fits | modeM0/AS1A14_099T04_9000006540_55724cztM0_level2_quad_clean.evt |
| Size (bytes) | 659,272,320 | 80,784,000 |
| Size | 628.7 MB | 77.0 MB |
| Events in quadrant A | 7,635,514 | 485,960 |
| Events in quadrant B | 2,626,175 | 626,921 |
| Events in quadrant C | 4,850,766 | 525,973 |
| Events in quadrant D | 8,810,261 | 373,518 |
| Mode M0 | |||
|---|---|---|---|
| Quadrant | BADHDUFLAG | Total packets | Discarded packets |
| A | 0 | 27013 | 1 |
| B | 0 | 12737 | 1 |
| C | 0 | 18828 | 1 |
| D | 0 | 30499 | 1 |
| Mode M9 | |||
|---|---|---|---|
| Quadrant | BADHDUFLAG | Total packets | Discarded packets |
| A | 0 | 9 | 0 |
| B | 0 | 9 | 0 |
| C | 0 | 9 | 0 |
| D | 0 | 9 | 0 |
| Mode SS | |||
|---|---|---|---|
| Quadrant | BADHDUFLAG | Total packets | Discarded packets |
| A | 0 | 126 | 0 |
| B | 0 | 126 | 0 |
| C | 0 | 126 | 0 |
| D | 0 | 126 | 0 |
| Quadrant | Total seconds | Saturated seconds | Saturation percentage |
|---|---|---|---|
| A | 6211 | 1272 | 20.479794% |
| B | 6211 | 109 | 1.754951% |
| C | 6212 | 606 | 9.755312% |
| D | 6212 | 2101 | 33.821636% |
Noise dominated data is calculated using 1-second bins in cleaned event files. If a bin has >2000 counts, and if more than 50% of those come from <1% of pixels, then it is considered to be noise-dominated and hence unusable.
| Quadrant | # 1 sec bins | Bins with >0 counts | Bins with >2000 counts | High rate bins dominated by noise | Noise dominated (total time) | Noise dominated (detector-on time) | Marked lightcurve |
|---|---|---|---|---|---|---|---|
| A | 7141 | 6212 | 993 | 993 | 13.91% | 15.99% | 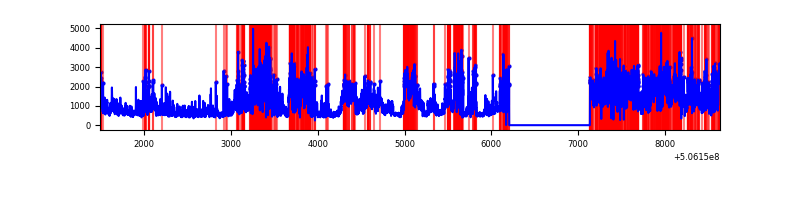 |
| B | 7141 | 6212 | 3 | 3 | 0.04% | 0.05% | 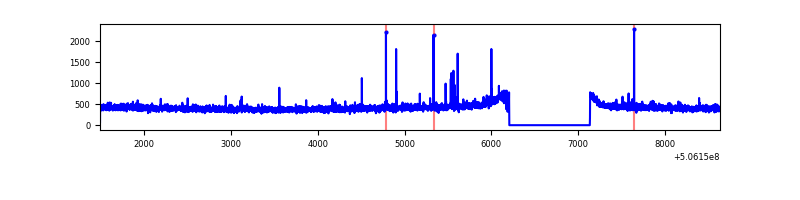 |
| C | 7142 | 6212 | 452 | 452 | 6.33% | 7.28% | 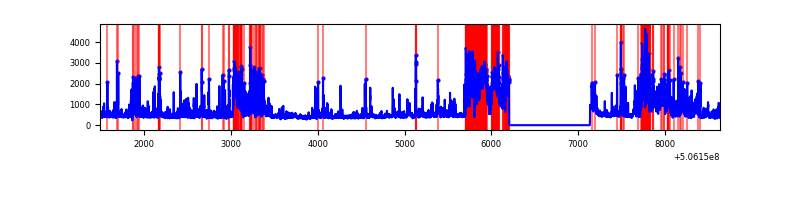 |
| D | 7142 | 6213 | 1770 | 1770 | 24.78% | 28.49% | 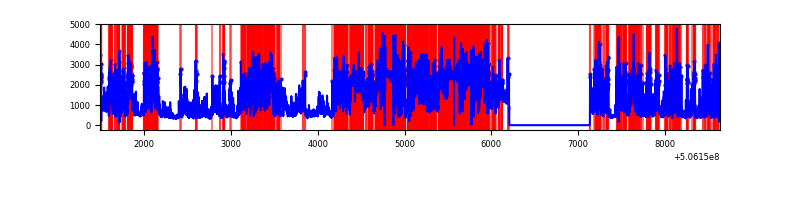 |
Top three noisy pixels from each quadrant. If the there are fewer than three noisy pixels in the level2.evt file, extra rows are filled as -1
| Pixel properties | Quadrant properties | ||||||
|---|---|---|---|---|---|---|---|
| Quadrant | DetID | PixID | Counts | Sigma | Mean | Median | Sigma |
| A | 15 | 32 | 4432418 | 30154.35 | 604 | 590 | 147.0 |
| A | 7 | 64 | 269885 | 1832.3 | 604 | 590 | 147.0 |
| A | 0 | 8 | 257119 | 1745.43 | 604 | 590 | 147.0 |
| B | 12 | 111 | 17311 | 118.97 | 652 | 629 | 140.2 |
| B | 11 | 111 | 16064 | 110.08 | 652 | 629 | 140.2 |
| B | 14 | 111 | 15803 | 108.22 | 652 | 629 | 140.2 |
| C | 15 | 199 | 1215133 | 7267.82 | 609 | 603 | 167.1 |
| C | 13 | 3 | 626727 | 3746.76 | 609 | 603 | 167.1 |
| C | 14 | 96 | 281430 | 1680.48 | 609 | 603 | 167.1 |
| D | 11 | 129 | 6519966 | 43995.43 | 524 | 500 | 148.2 |
| D | 8 | 245 | 125791 | 845.5 | 524 | 500 | 148.2 |
| D | 7 | 129 | 36441 | 242.54 | 524 | 500 | 148.2 |
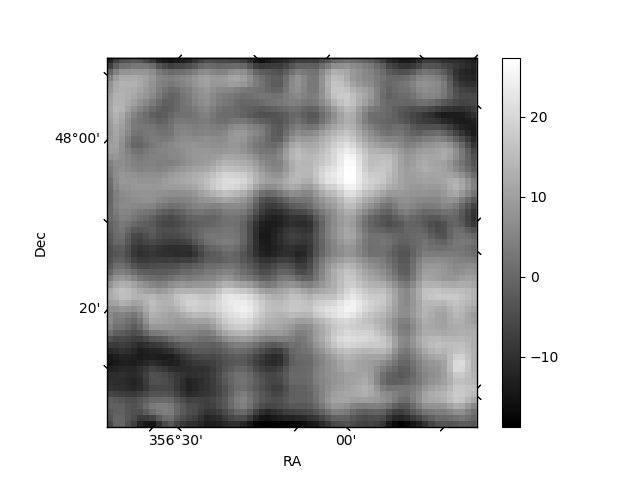
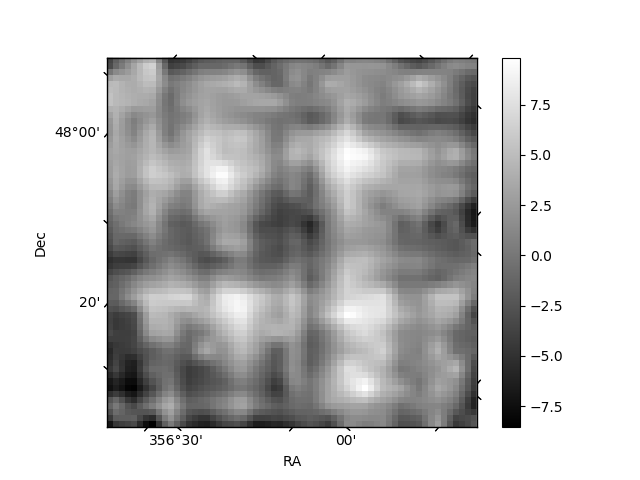
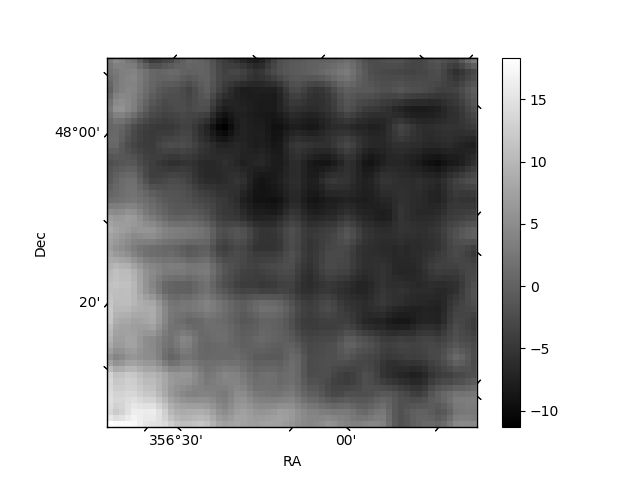
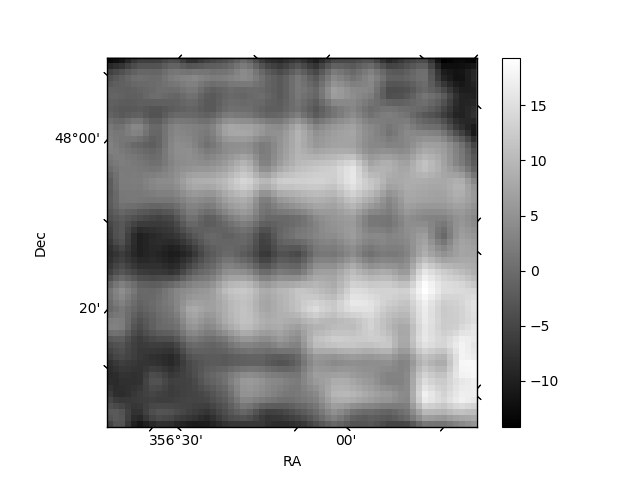
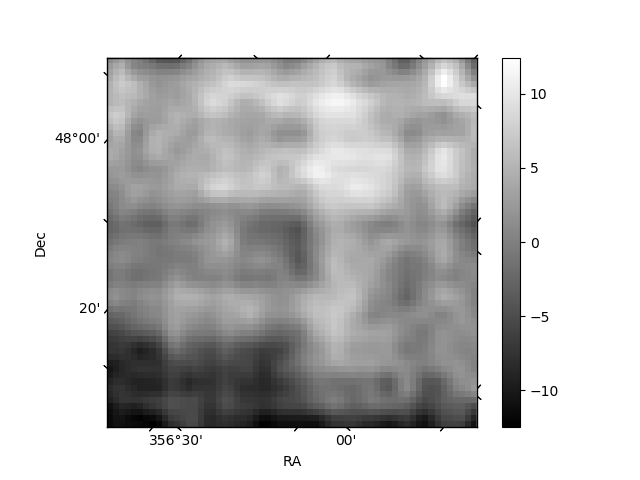
Histogram calculated using DETX and DETY for each event in the final _common_clean file
| Quadrant A | 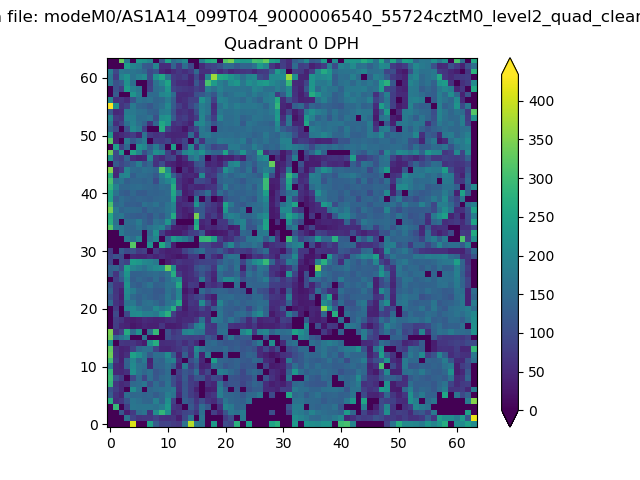 |
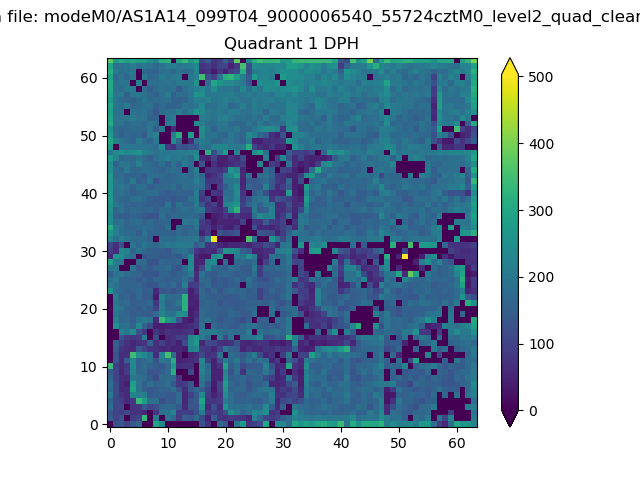 |
Quadrant B |
|---|---|---|---|
| Quadrant D | 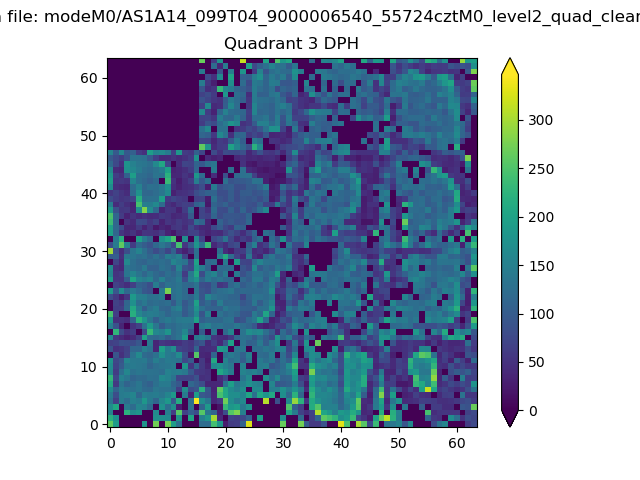 |
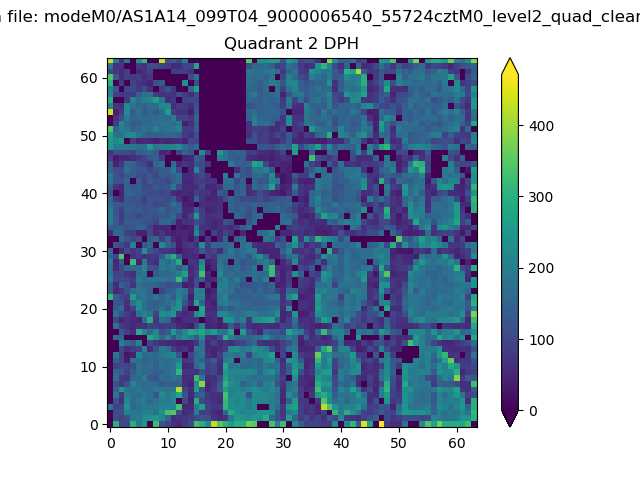 |
Quadrant C |
| Plot type | Count rate plots | Images |
|---|---|---|
| Comparison with Poisson distribution Blue bars denote a histogram of data divided into 1 sec bins. Red curve is a Poisson curve with rate = median count rate of data. |
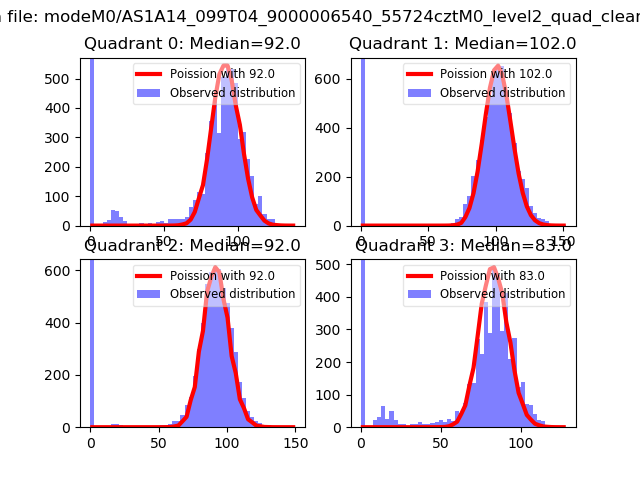 |
 |
| Quadrant-wise count rates Data is divided into 100 sec bins |
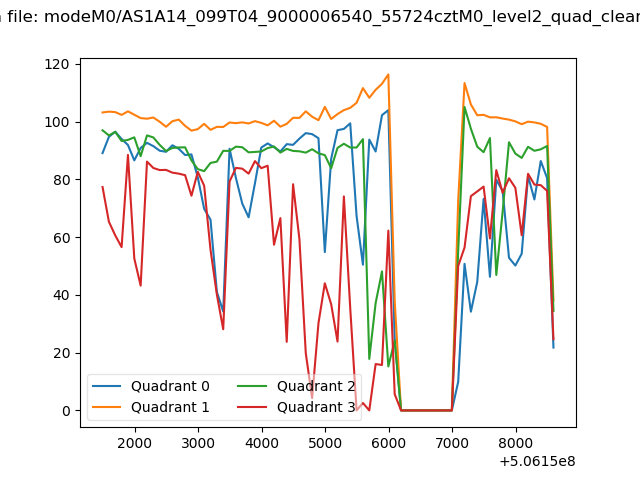 |
|
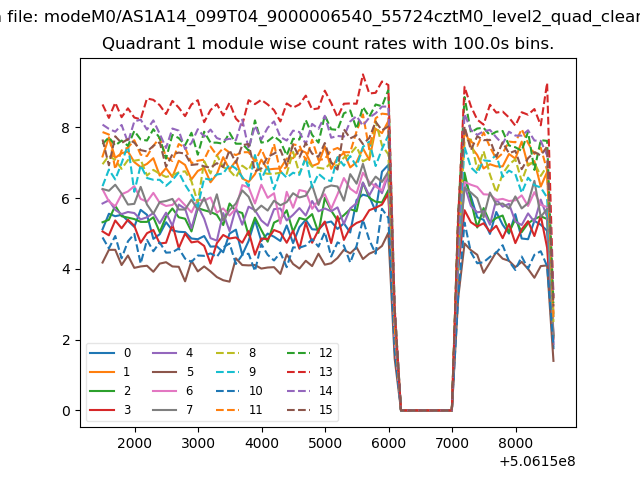
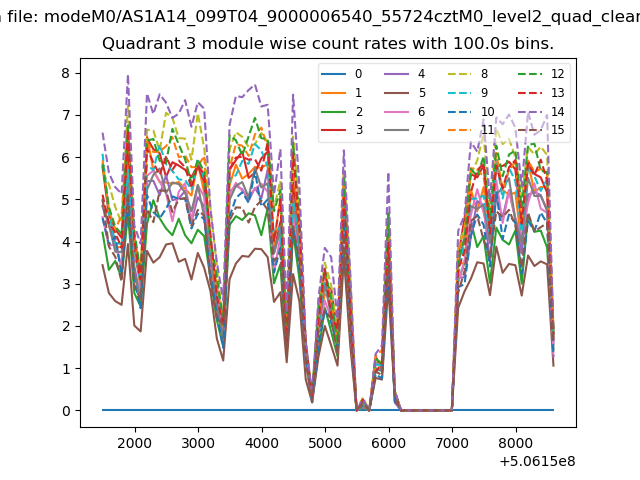
| Module-wise count rates for Quadrant A Data is divided into 100 sec bins |
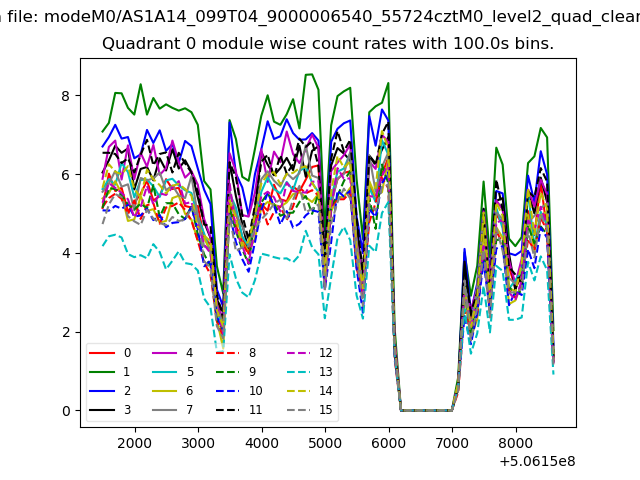 |
 |
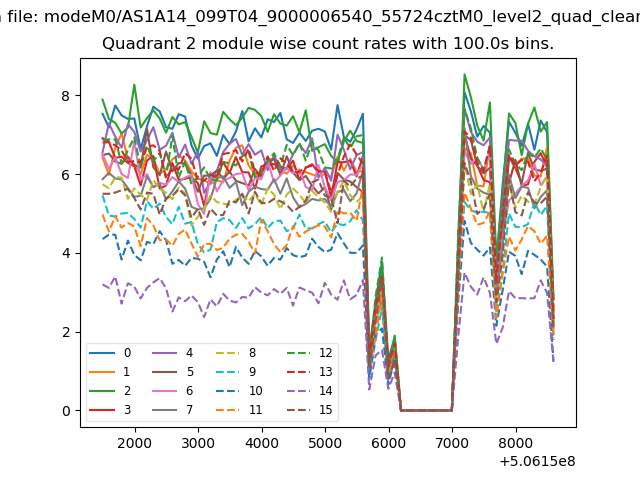
| Module-wise count rates for Quadrant B Data is divided into 100 sec bins |
 |
 |
| Module-wise count rates for Quadrant C Data is divided into 100 sec bins |
 |
 |
| Module-wise count rates for Quadrant D Data is divided into 100 sec bins |
 |
 |
| Parameter | Plot |
|---|---|
| CZT HV Monitor | 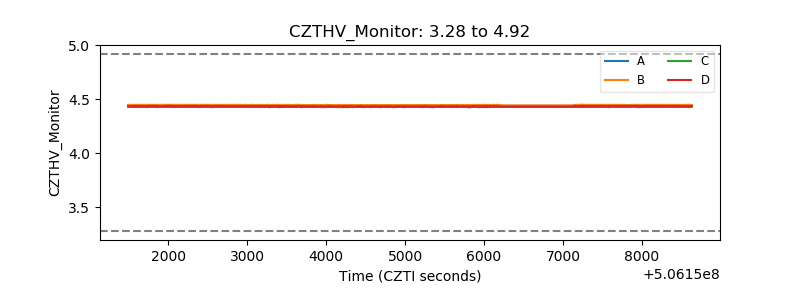 |
| D_VDD | 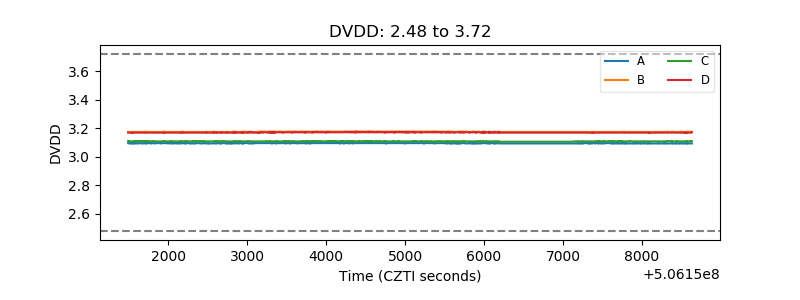 |
| Temperature 1 | 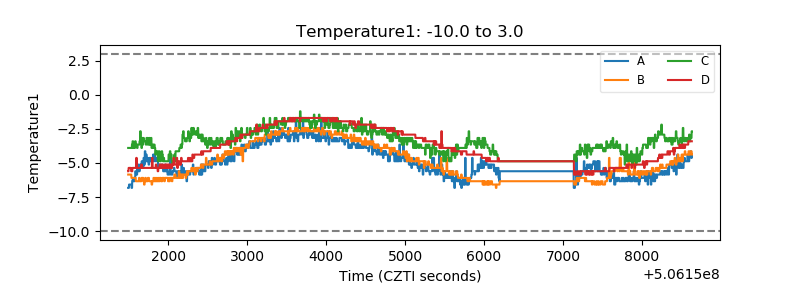 |
| Veto HV Monitor | 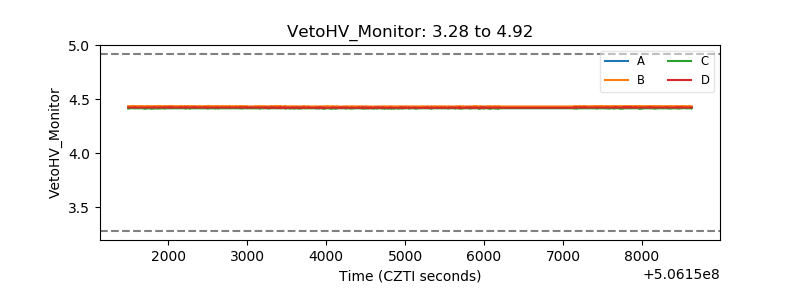 |
| Veto LLD | 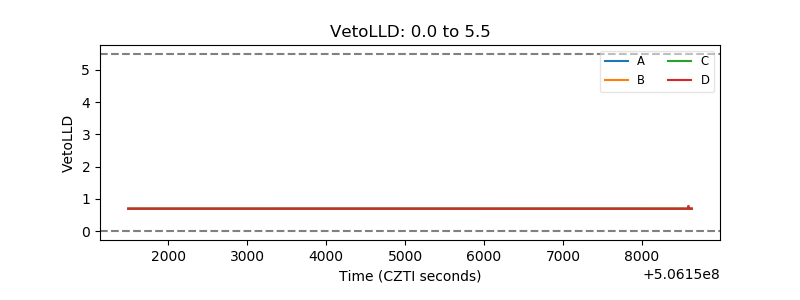 |
| Alpha Counter | 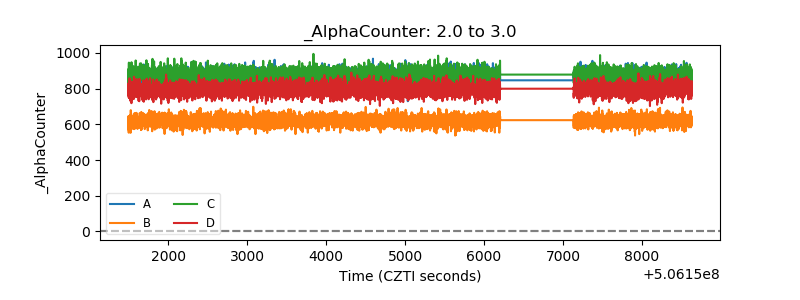 |
| _CPM_Rate | 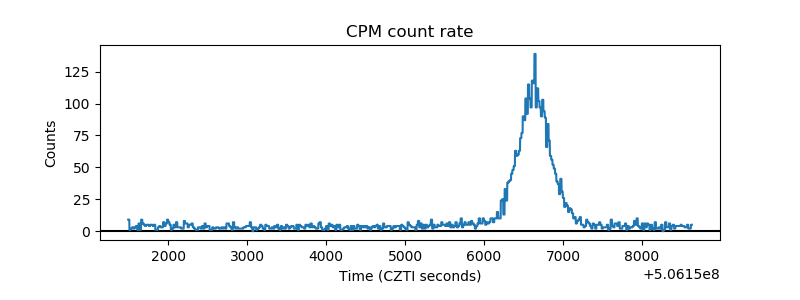 |
| CZT Counter | 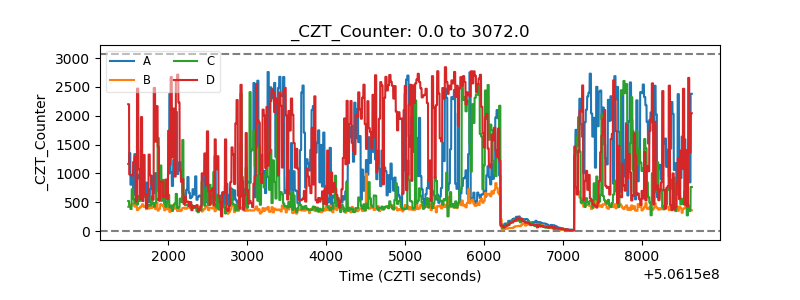 |
| +2.5 Volts monitor | 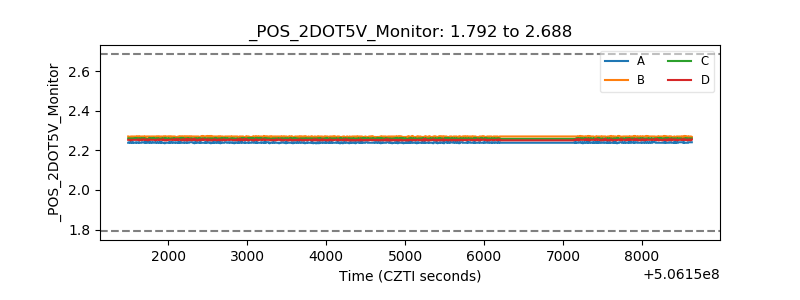 |
| +5 Volts monitor | 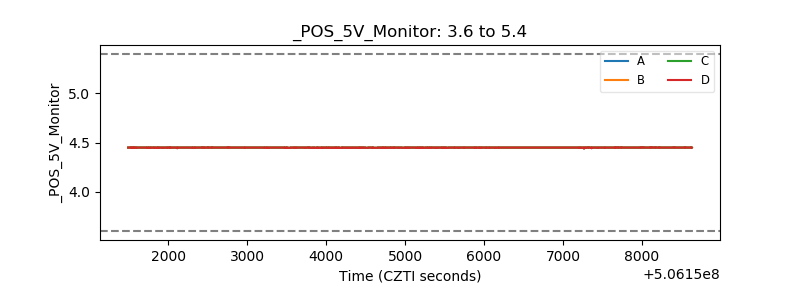 |
| _ROLL_ROT | 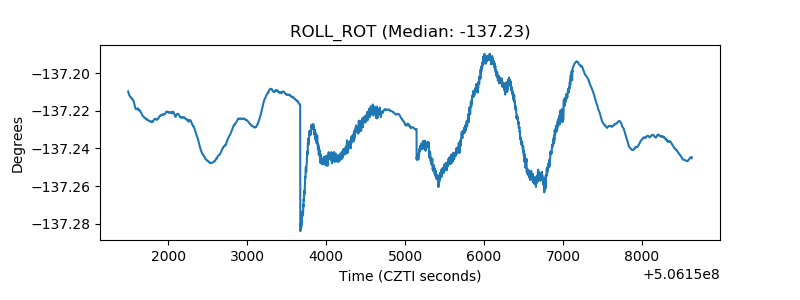 |
| _Roll_DEC | 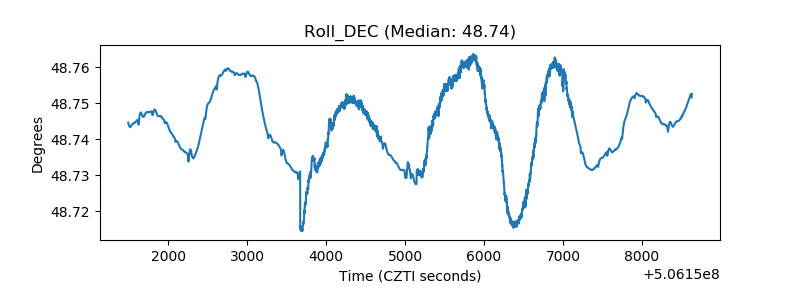 |
| _Roll_RA | 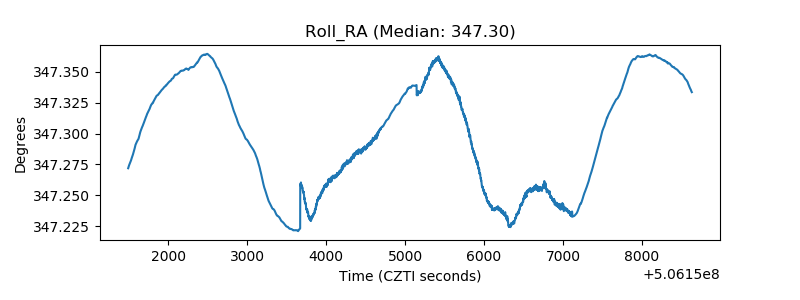 |
| Veto Counter | 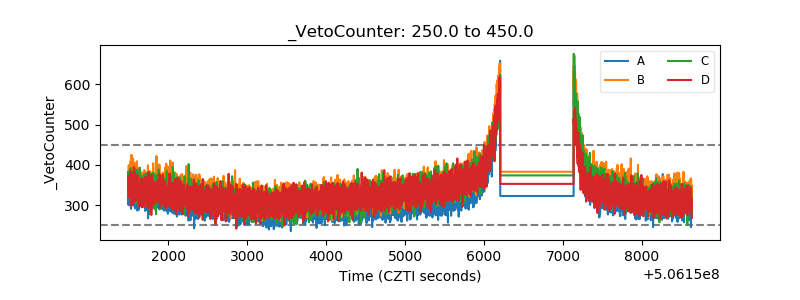 |