| Param | Original file | Final file |
|---|---|---|
| Filename | modeM0/AS1A14_099T04_9000006540_55725cztM0_level2.fits | modeM0/AS1A14_099T04_9000006540_55725cztM0_level2_quad_clean.evt |
| Size (bytes) | 860,906,880 | 88,326,720 |
| Size | 821.0 MB | 84.2 MB |
| Events in quadrant A | 11,840,213 | 404,448 |
| Events in quadrant B | 3,280,441 | 723,640 |
| Events in quadrant C | 7,311,031 | 559,344 |
| Events in quadrant D | 8,878,222 | 484,380 |
| Mode M0 | |||
|---|---|---|---|
| Quadrant | BADHDUFLAG | Total packets | Discarded packets |
| A | 0 | 40137 | 1 |
| B | 0 | 15168 | 1 |
| C | 0 | 26746 | 1 |
| D | 0 | 31408 | 2 |
| Mode M9 | |||
|---|---|---|---|
| Quadrant | BADHDUFLAG | Total packets | Discarded packets |
| A | 0 | 4 | 0 |
| B | 0 | 4 | 0 |
| C | 0 | 4 | 0 |
| D | 0 | 4 | 0 |
| Mode SS | |||
|---|---|---|---|
| Quadrant | BADHDUFLAG | Total packets | Discarded packets |
| A | 0 | 148 | 0 |
| B | 0 | 148 | 0 |
| C | 0 | 148 | 0 |
| D | 0 | 148 | 0 |
| Quadrant | Total seconds | Saturated seconds | Saturation percentage |
|---|---|---|---|
| A | 7207 | 3310 | 45.927570% |
| B | 7207 | 140 | 1.942556% |
| C | 7208 | 1306 | 18.118757% |
| D | 7207 | 1847 | 25.627862% |
Noise dominated data is calculated using 1-second bins in cleaned event files. If a bin has >2000 counts, and if more than 50% of those come from <1% of pixels, then it is considered to be noise-dominated and hence unusable.
| Quadrant | # 1 sec bins | Bins with >0 counts | Bins with >2000 counts | High rate bins dominated by noise | Noise dominated (total time) | Noise dominated (detector-on time) | Marked lightcurve |
|---|---|---|---|---|---|---|---|
| A | 7672 | 7208 | 2732 | 2732 | 35.61% | 37.90% | 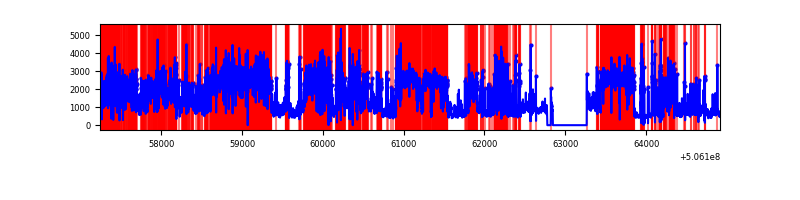 |
| B | 7672 | 7209 | 6 | 6 | 0.08% | 0.08% | 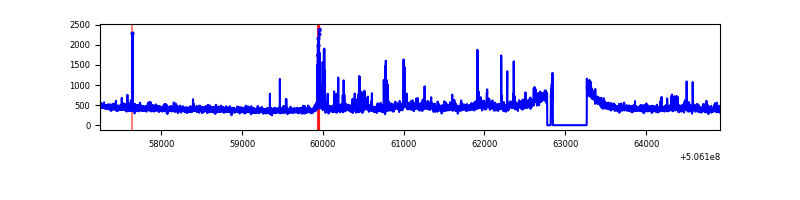 |
| C | 7673 | 7210 | 1139 | 1139 | 14.84% | 15.80% | 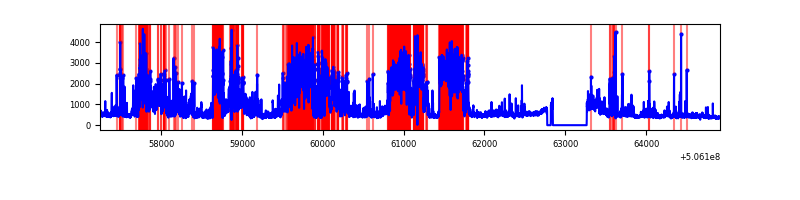 |
| D | 7672 | 7207 | 1530 | 1530 | 19.94% | 21.23% | 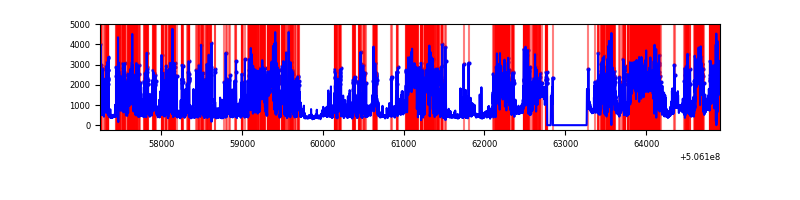 |
Top three noisy pixels from each quadrant. If the there are fewer than three noisy pixels in the level2.evt file, extra rows are filled as -1
| Pixel properties | Quadrant properties | ||||||
|---|---|---|---|---|---|---|---|
| Quadrant | DetID | PixID | Counts | Sigma | Mean | Median | Sigma |
| A | 15 | 32 | 5270189 | 35234.83 | 614 | 598 | 149.6 |
| A | 12 | 115 | 2901421 | 19396.19 | 614 | 598 | 149.6 |
| A | 4 | 249 | 776616 | 5188.8 | 614 | 598 | 149.6 |
| B | 4 | 206 | 190276 | 1165.47 | 758 | 731 | 162.6 |
| B | 0 | 199 | 54848 | 332.75 | 758 | 731 | 162.6 |
| B | 12 | 111 | 20317 | 120.43 | 758 | 731 | 162.6 |
| C | 15 | 199 | 3828678 | 20342.1 | 682 | 674 | 188.2 |
| C | 14 | 96 | 390094 | 2069.39 | 682 | 674 | 188.2 |
| C | 13 | 3 | 174359 | 922.97 | 682 | 674 | 188.2 |
| D | 11 | 129 | 5921170 | 31483.83 | 665 | 635 | 188.1 |
| D | 10 | 181 | 106427 | 562.57 | 665 | 635 | 188.1 |
| D | 7 | 129 | 88010 | 464.64 | 665 | 635 | 188.1 |
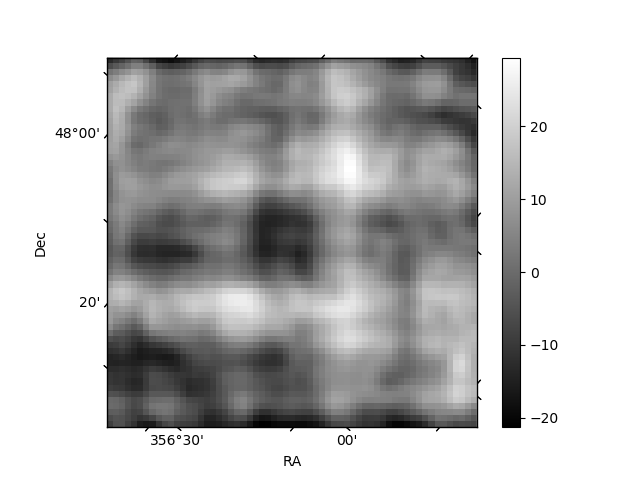
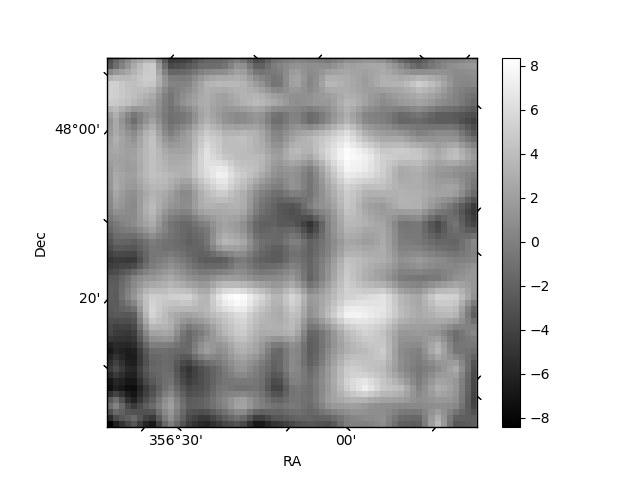
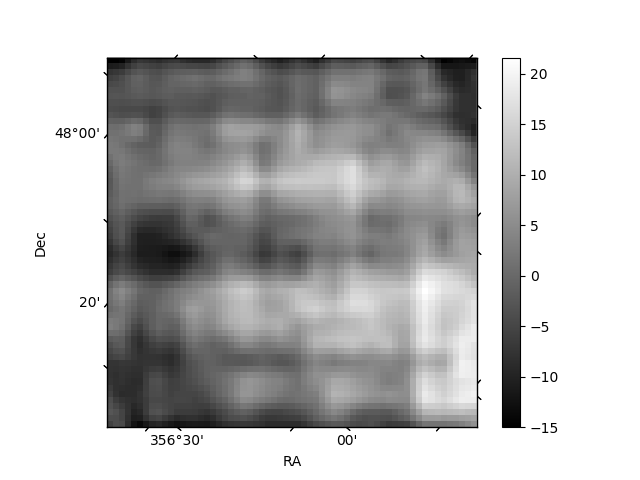
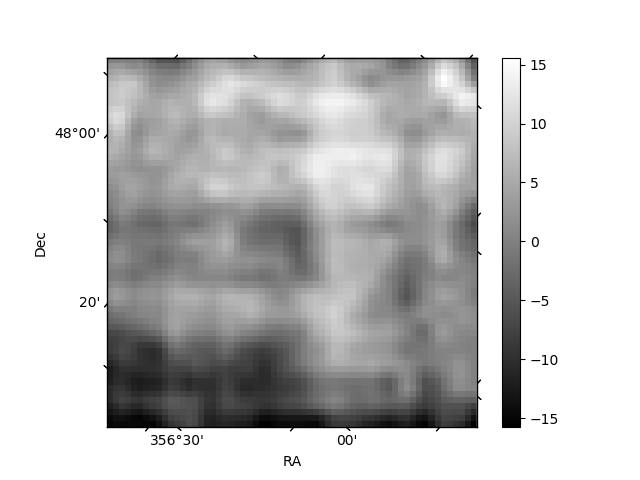
Histogram calculated using DETX and DETY for each event in the final _common_clean file
| Quadrant A | 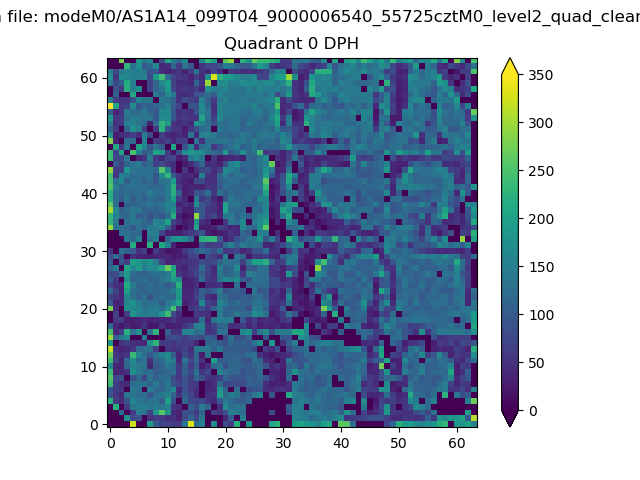 |
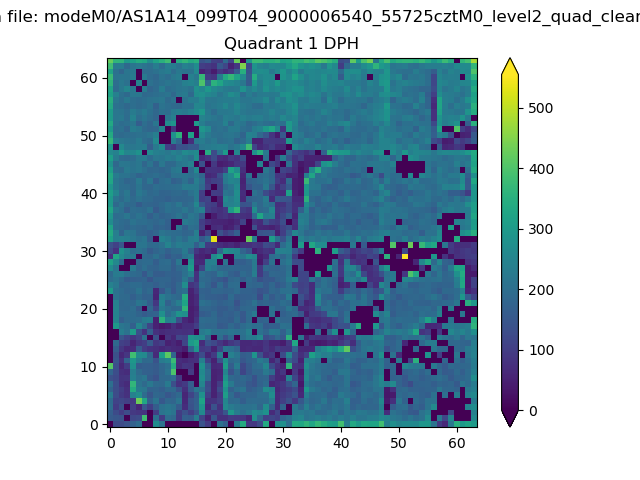 |
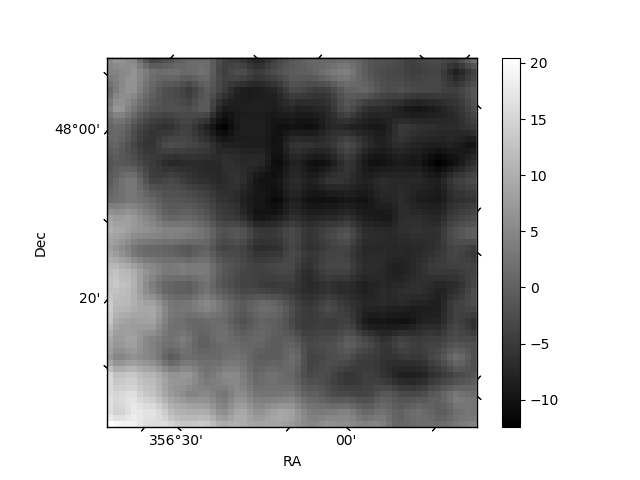
Quadrant B |
|---|---|---|---|
| Quadrant D | 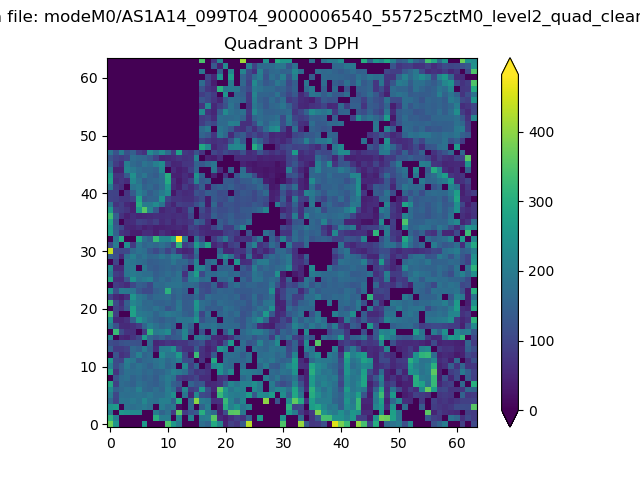 |
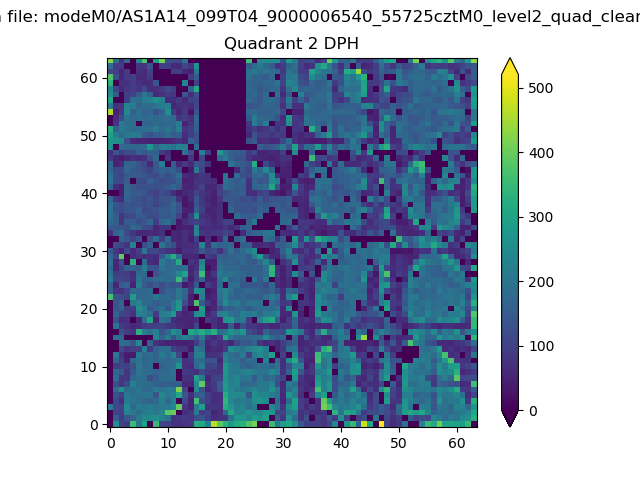 |
Quadrant C |
| Plot type | Count rate plots | Images |
|---|---|---|
| Comparison with Poisson distribution Blue bars denote a histogram of data divided into 1 sec bins. Red curve is a Poisson curve with rate = median count rate of data. |
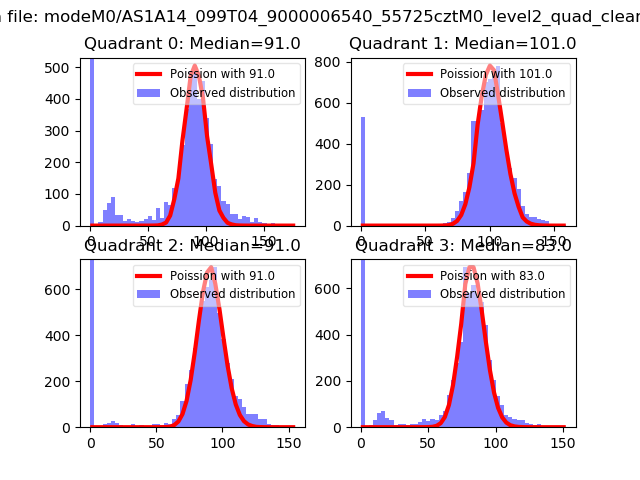 |
 |
| Quadrant-wise count rates Data is divided into 100 sec bins |
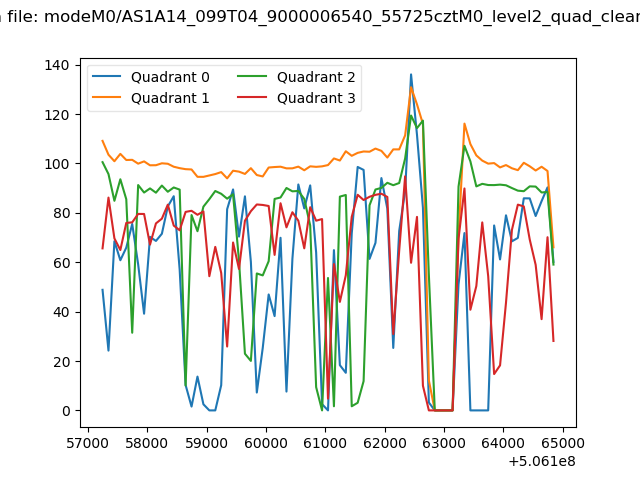 |
|
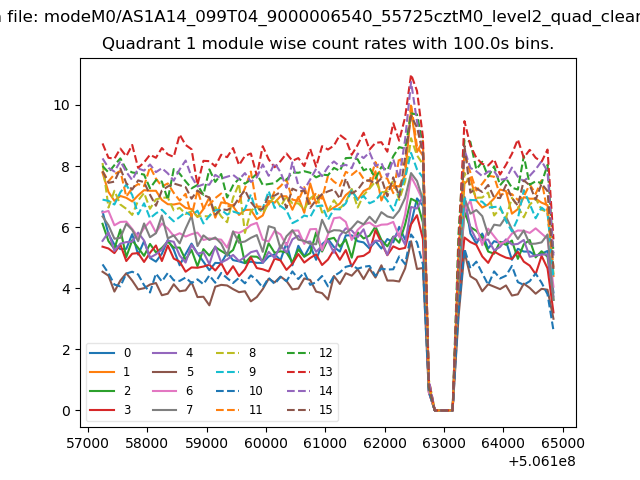
| Module-wise count rates for Quadrant A Data is divided into 100 sec bins |
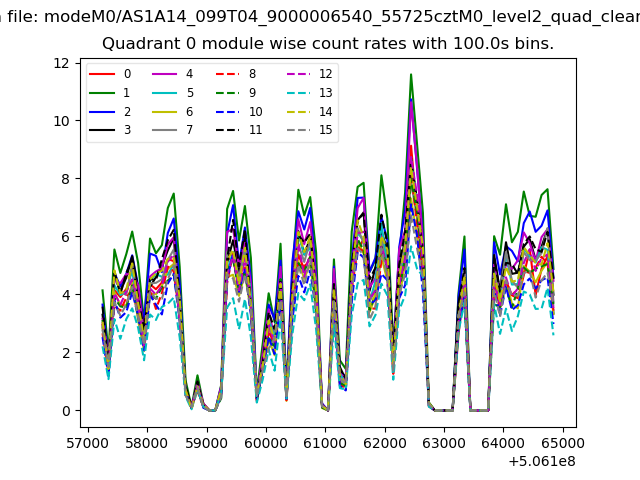 |
 |
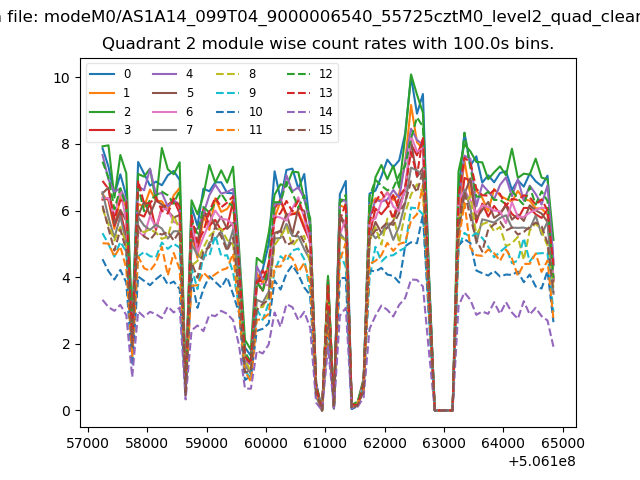
| Module-wise count rates for Quadrant B Data is divided into 100 sec bins |
 |
 |
| Module-wise count rates for Quadrant C Data is divided into 100 sec bins |
 |
 |
| Module-wise count rates for Quadrant D Data is divided into 100 sec bins |
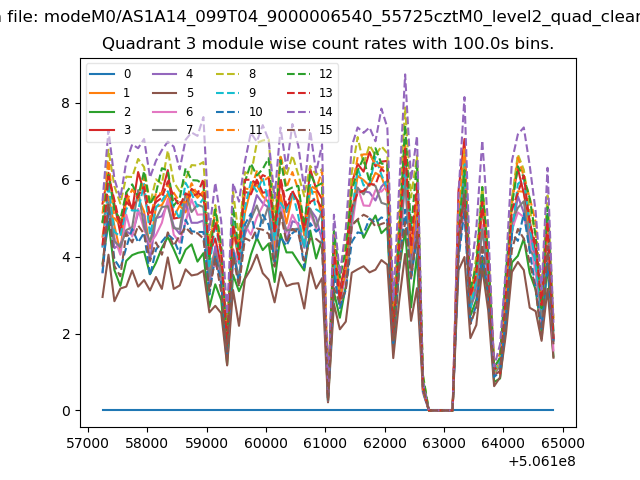 |
 |
| Parameter | Plot |
|---|---|
| CZT HV Monitor | 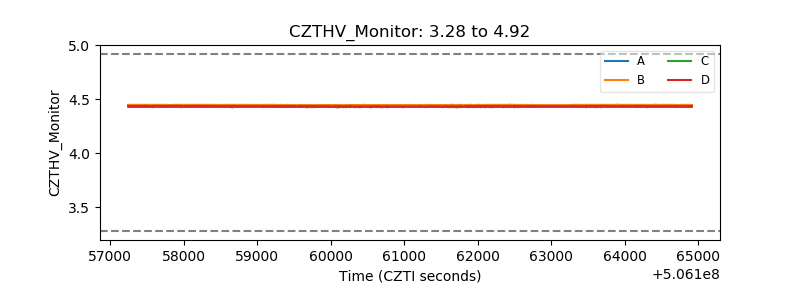 |
| D_VDD | 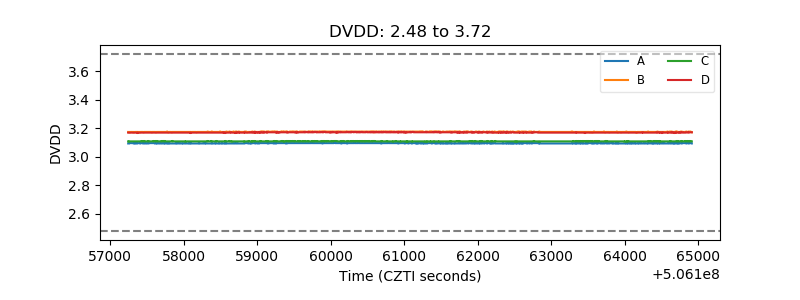 |
| Temperature 1 | 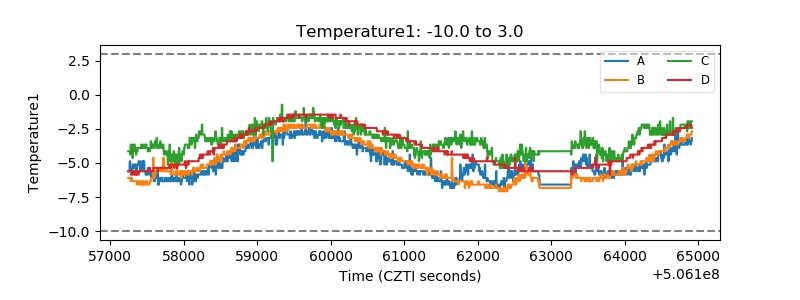 |
| Veto HV Monitor | 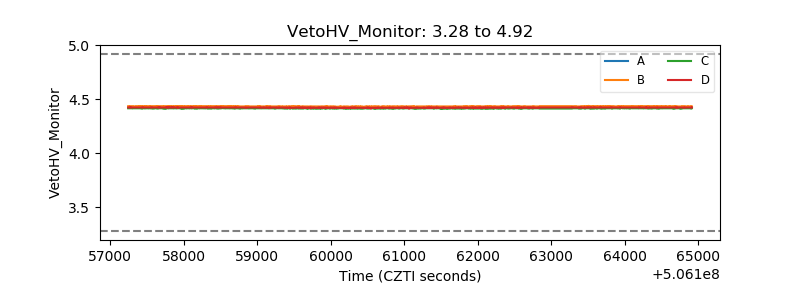 |
| Veto LLD | 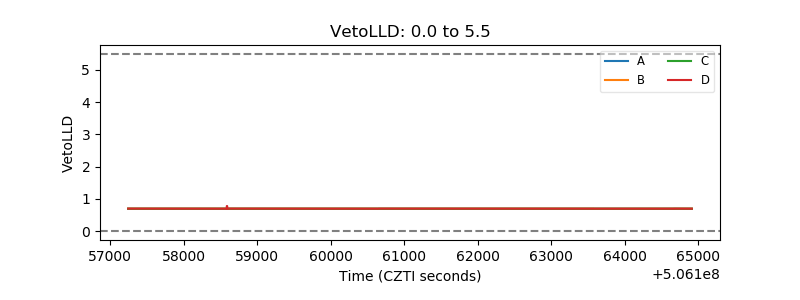 |
| Alpha Counter | 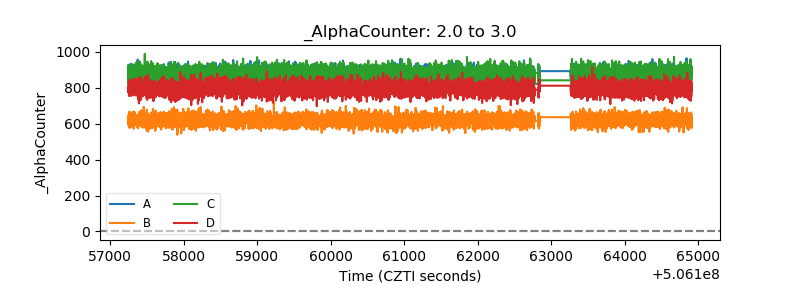 |
| _CPM_Rate | 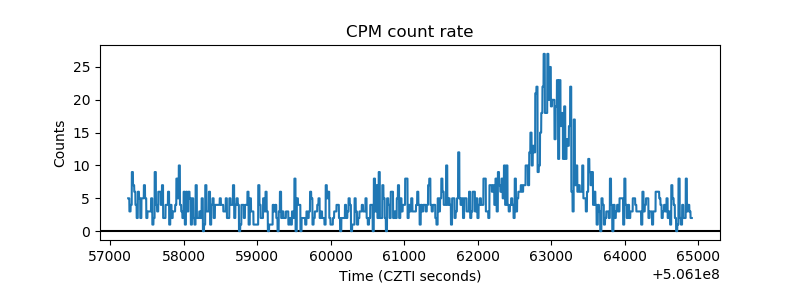 |
| CZT Counter | 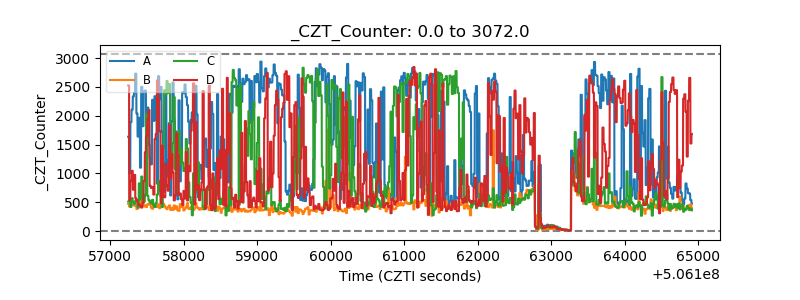 |
| +2.5 Volts monitor | 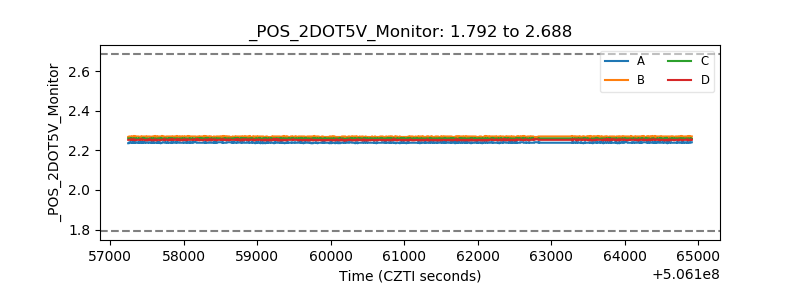 |
| +5 Volts monitor | 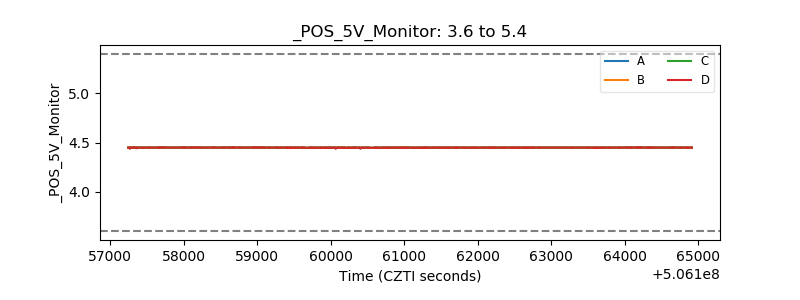 |
| _ROLL_ROT | 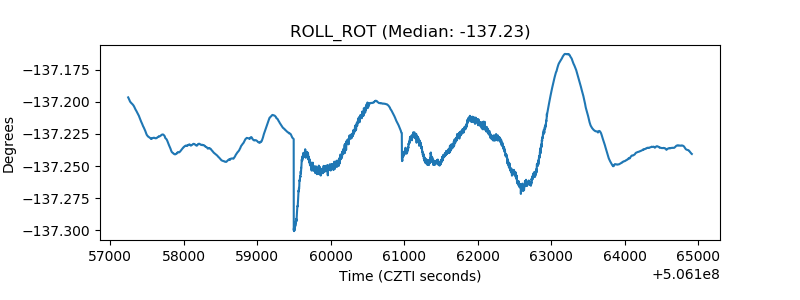 |
| _Roll_DEC | 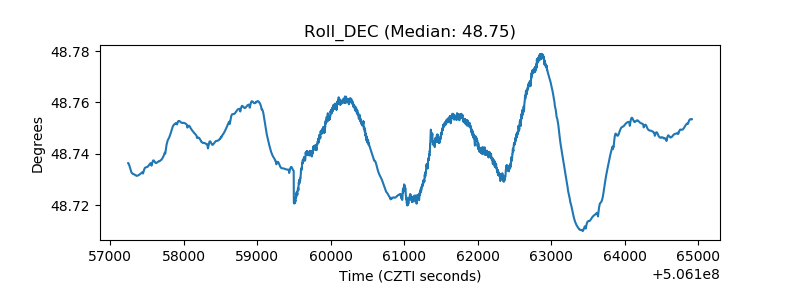 |
| _Roll_RA | 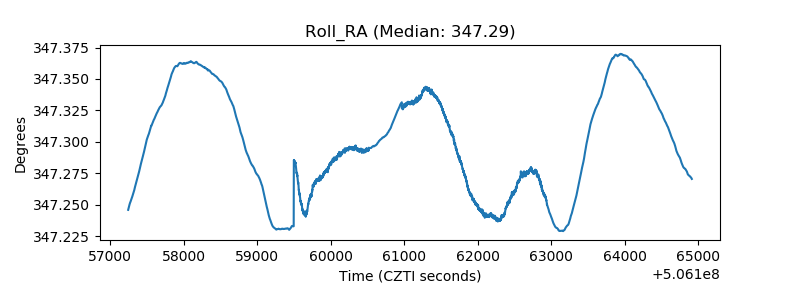 |
| Veto Counter | 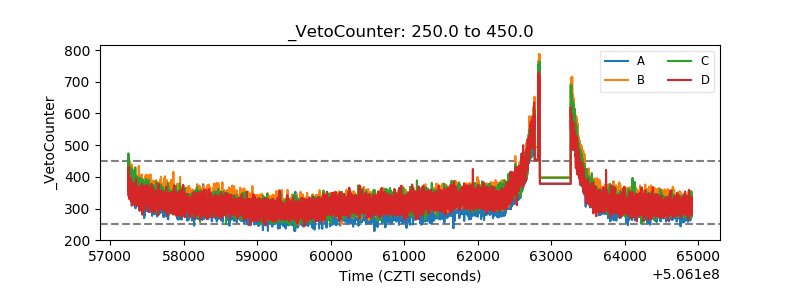 |