| Param | Original file | Final file |
|---|---|---|
| Filename | modeM0/AS1A14_099T04_9000006540_55726cztM0_level2.fits | modeM0/AS1A14_099T04_9000006540_55726cztM0_level2_quad_clean.evt |
| Size (bytes) | 1,047,139,200 | 77,063,040 |
| Size | 998.6 MB | 73.5 MB |
| Events in quadrant A | 8,373,390 | 547,983 |
| Events in quadrant B | 3,241,919 | 717,672 |
| Events in quadrant C | 13,830,958 | 262,706 |
| Events in quadrant D | 12,763,289 | 306,990 |
| Mode M0 | |||
|---|---|---|---|
| Quadrant | BADHDUFLAG | Total packets | Discarded packets |
| A | 0 | 29778 | 0 |
| B | 0 | 14879 | 0 |
| C | 0 | 46077 | 4 |
| D | 0 | 42851 | 0 |
| Mode SS | |||
|---|---|---|---|
| Quadrant | BADHDUFLAG | Total packets | Discarded packets |
| A | 0 | 142 | 0 |
| B | 0 | 142 | 0 |
| C | 0 | 142 | 0 |
| D | 0 | 142 | 0 |
| Quadrant | Total seconds | Saturated seconds | Saturation percentage |
|---|---|---|---|
| A | 7148 | 1510 | 21.124790% |
| B | 7149 | 34 | 0.475591% |
| C | 7148 | 4533 | 63.416340% |
| D | 7148 | 3813 | 53.343593% |
Noise dominated data is calculated using 1-second bins in cleaned event files. If a bin has >2000 counts, and if more than 50% of those come from <1% of pixels, then it is considered to be noise-dominated and hence unusable.
| Quadrant | # 1 sec bins | Bins with >0 counts | Bins with >2000 counts | High rate bins dominated by noise | Noise dominated (total time) | Noise dominated (detector-on time) | Marked lightcurve |
|---|---|---|---|---|---|---|---|
| A | 7148 | 7148 | 1169 | 1169 | 16.35% | 16.35% | 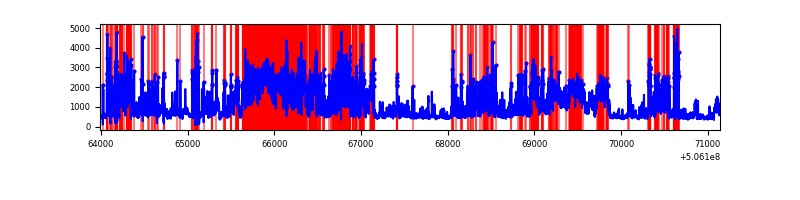 |
| B | 7149 | 7149 | 0 | 0 | 0.00% | 0.00% | 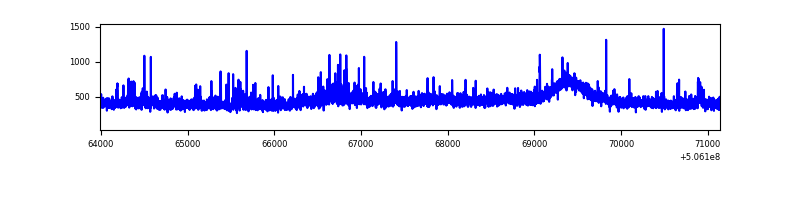 |
| C | 7148 | 7148 | 4180 | 4180 | 58.48% | 58.48% | 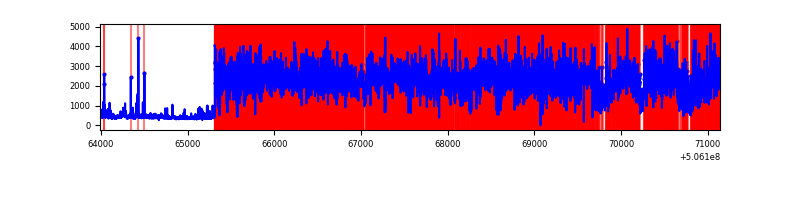 |
| D | 7148 | 7147 | 3210 | 3210 | 44.91% | 44.91% | 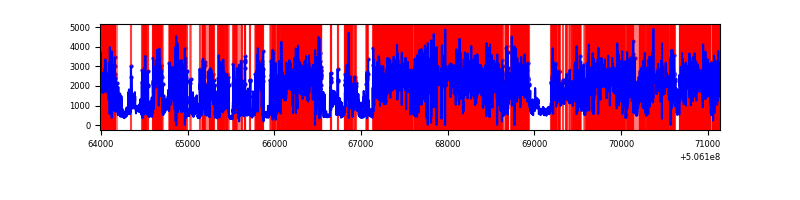 |
Top three noisy pixels from each quadrant. If the there are fewer than three noisy pixels in the level2.evt file, extra rows are filled as -1
| Pixel properties | Quadrant properties | ||||||
|---|---|---|---|---|---|---|---|
| Quadrant | DetID | PixID | Counts | Sigma | Mean | Median | Sigma |
| A | 15 | 32 | 2504131 | 14578.14 | 699 | 681 | 171.7 |
| A | 12 | 115 | 2008589 | 11692.49 | 699 | 681 | 171.7 |
| A | 7 | 64 | 378992 | 2202.99 | 699 | 681 | 171.7 |
| B | 4 | 206 | 169295 | 1046.78 | 751 | 722 | 161.0 |
| B | 0 | 199 | 67079 | 412.05 | 751 | 722 | 161.0 |
| B | 12 | 111 | 20076 | 120.18 | 751 | 722 | 161.0 |
| C | 9 | 38 | 10519584 | 72836.0 | 521 | 514 | 144.4 |
| C | 15 | 199 | 536607 | 3712.01 | 521 | 514 | 144.4 |
| C | 14 | 96 | 196762 | 1358.86 | 521 | 514 | 144.4 |
| D | 11 | 129 | 10143781 | 68854.04 | 525 | 501 | 147.3 |
| D | 8 | 245 | 330310 | 2238.79 | 525 | 501 | 147.3 |
| D | 3 | 12 | 94810 | 640.18 | 525 | 501 | 147.3 |
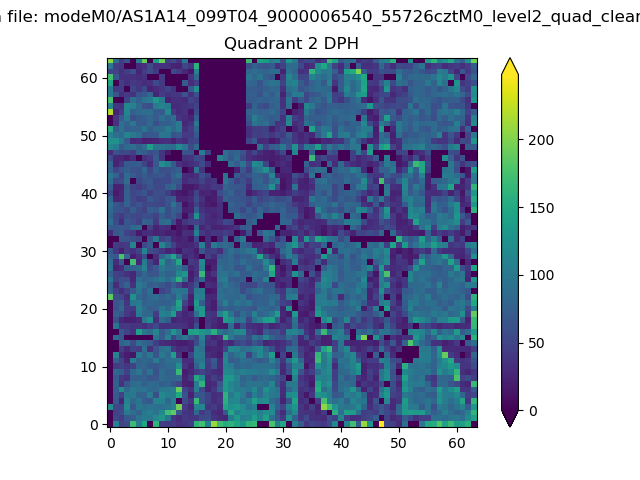
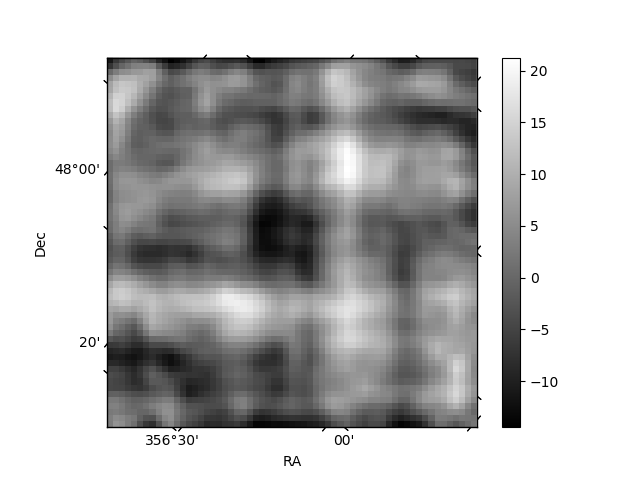
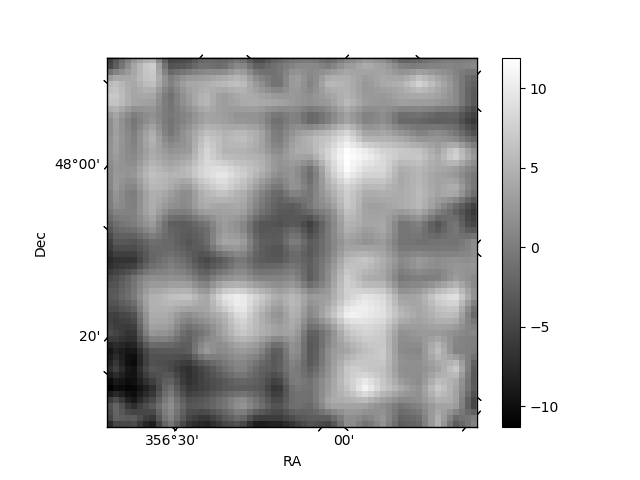
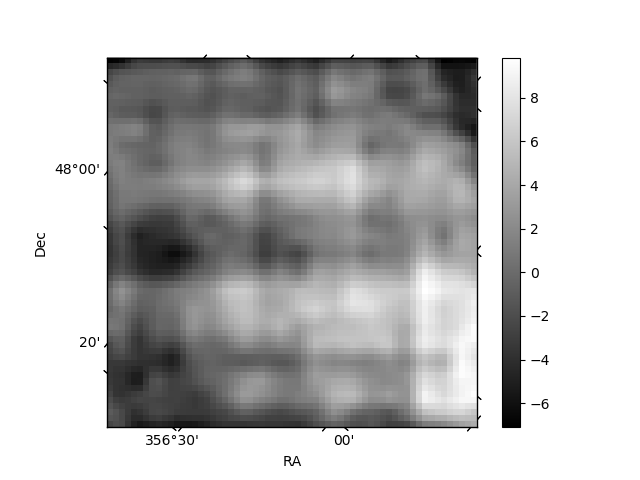
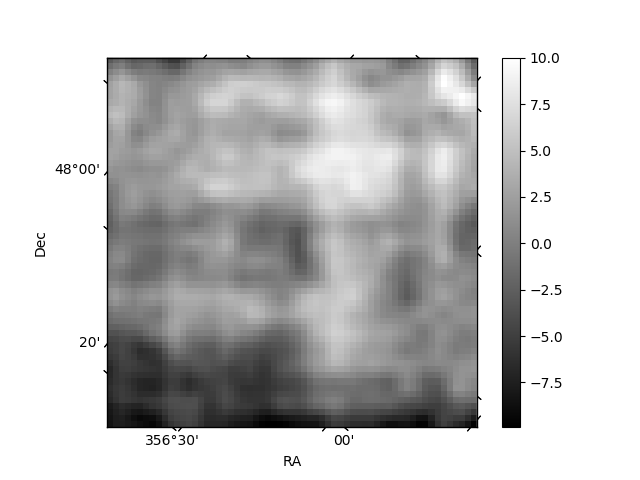
Histogram calculated using DETX and DETY for each event in the final _common_clean file
| Quadrant A | 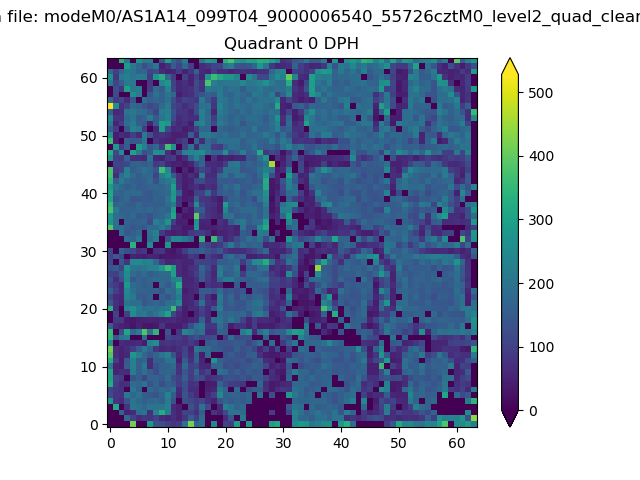 |
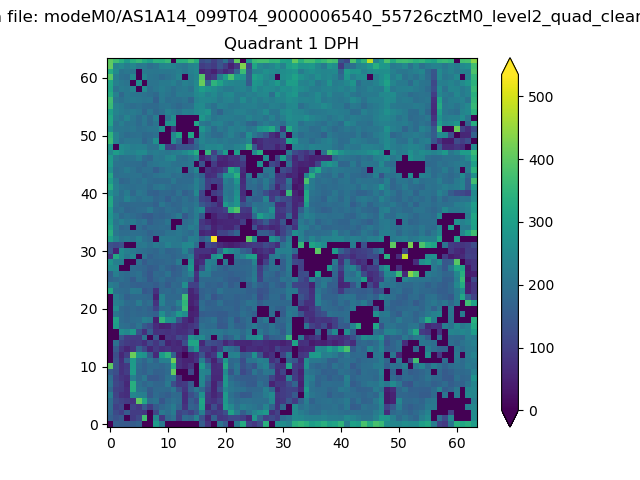 |
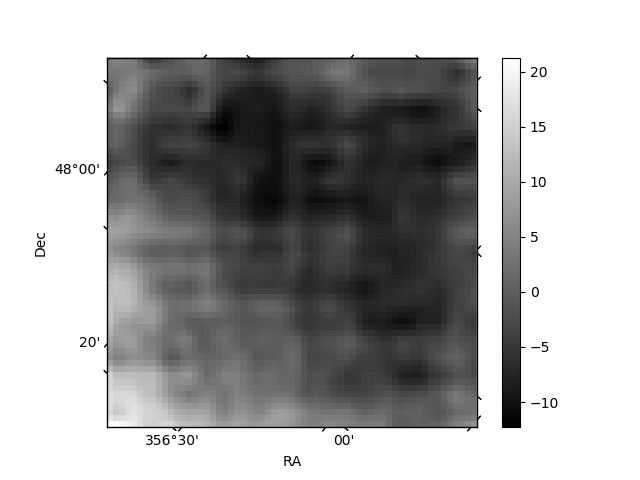
Quadrant B |
|---|---|---|---|
| Quadrant D | 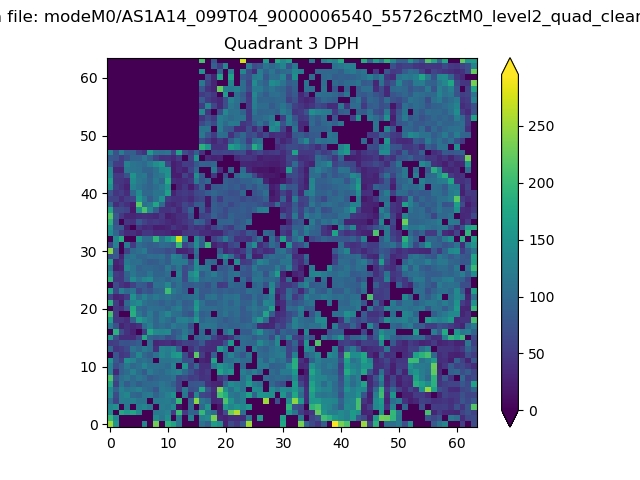 |
 |
Quadrant C |
| Plot type | Count rate plots | Images |
|---|---|---|
| Comparison with Poisson distribution Blue bars denote a histogram of data divided into 1 sec bins. Red curve is a Poisson curve with rate = median count rate of data. |
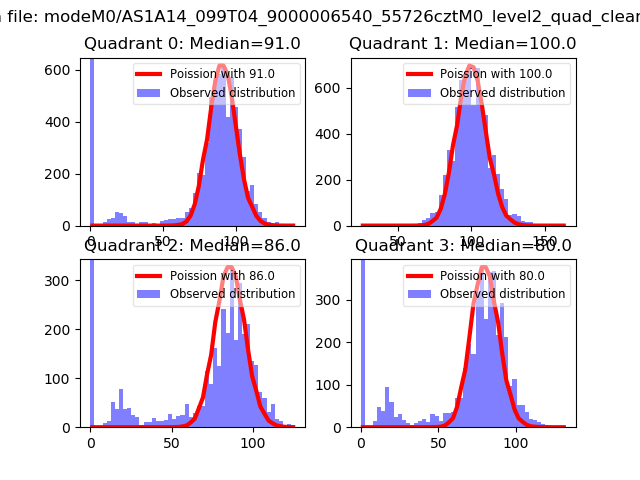 |
 |
| Quadrant-wise count rates Data is divided into 100 sec bins |
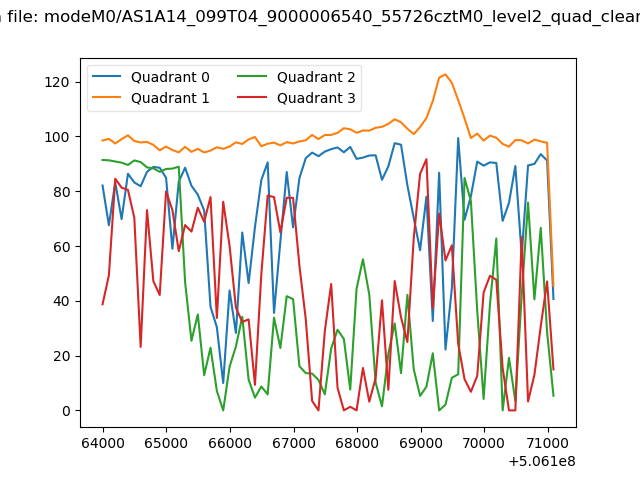 |
|
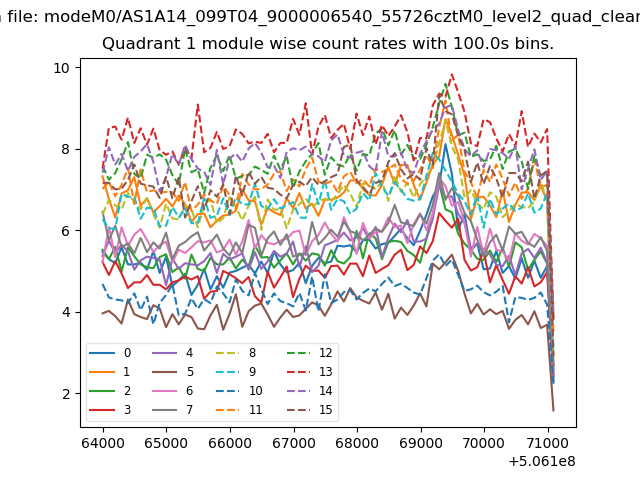
| Module-wise count rates for Quadrant A Data is divided into 100 sec bins |
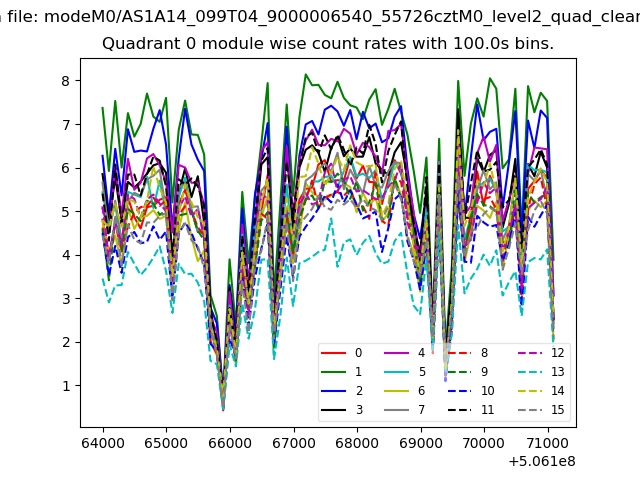 |
 |
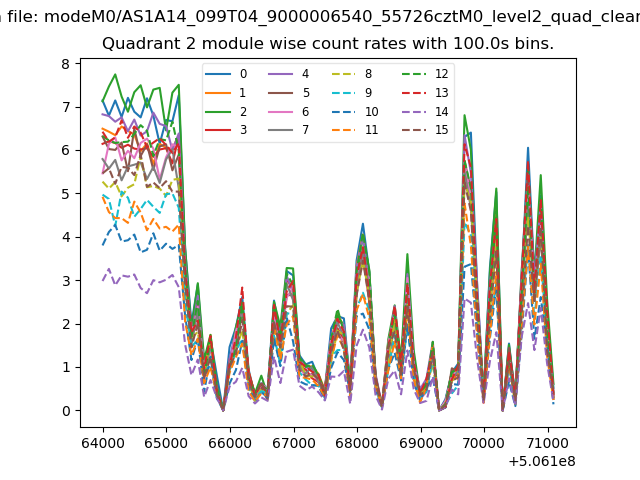
| Module-wise count rates for Quadrant B Data is divided into 100 sec bins |
 |
 |
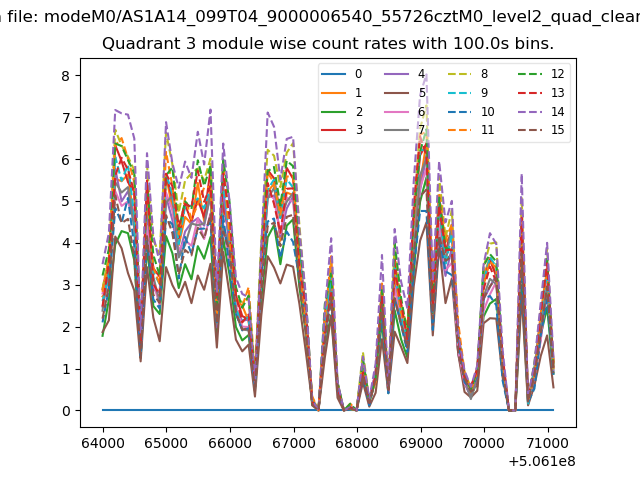
| Module-wise count rates for Quadrant C Data is divided into 100 sec bins |
 |
 |
| Module-wise count rates for Quadrant D Data is divided into 100 sec bins |
 |
 |
| Parameter | Plot |
|---|---|
| CZT HV Monitor | 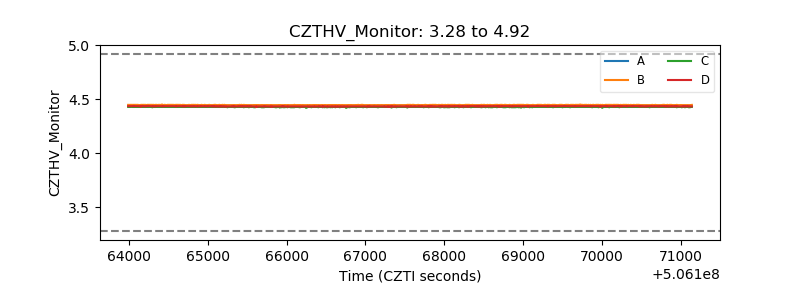 |
| D_VDD | 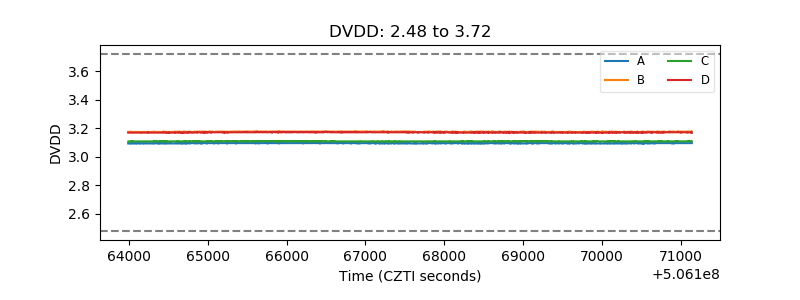 |
| Temperature 1 | 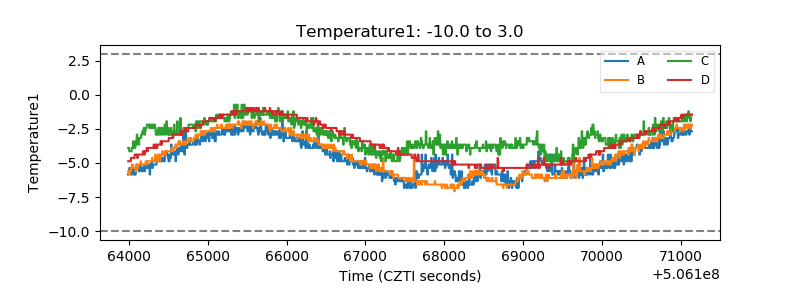 |
| Veto HV Monitor | 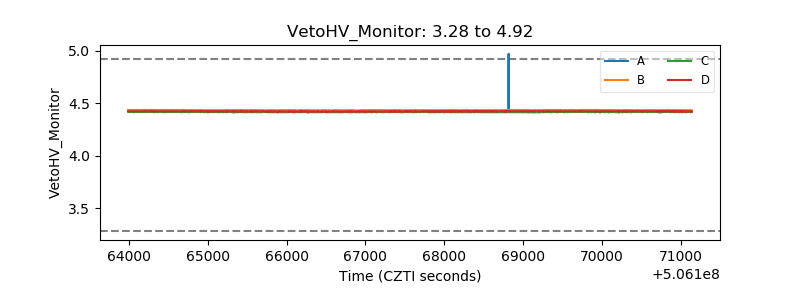 |
| Veto LLD | 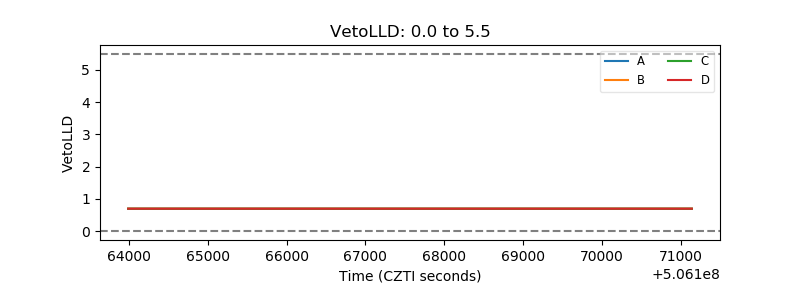 |
| Alpha Counter | 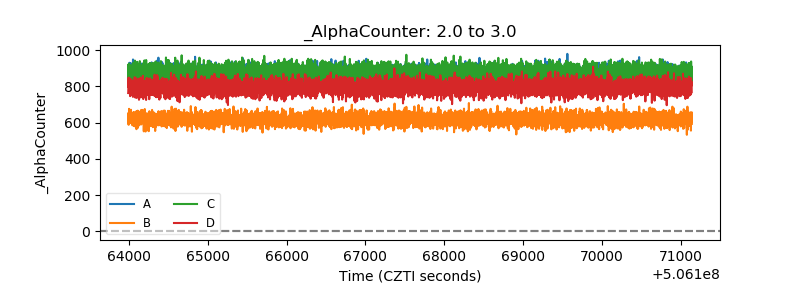 |
| _CPM_Rate | 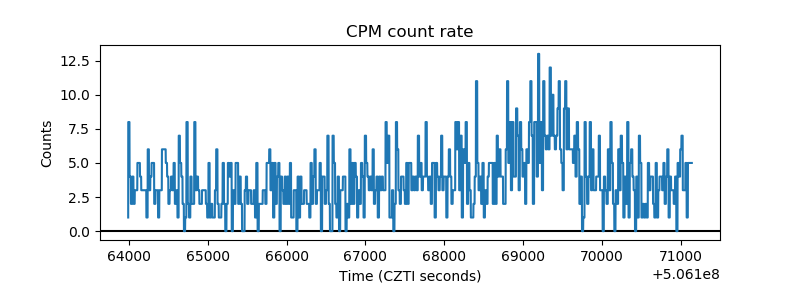 |
| CZT Counter | 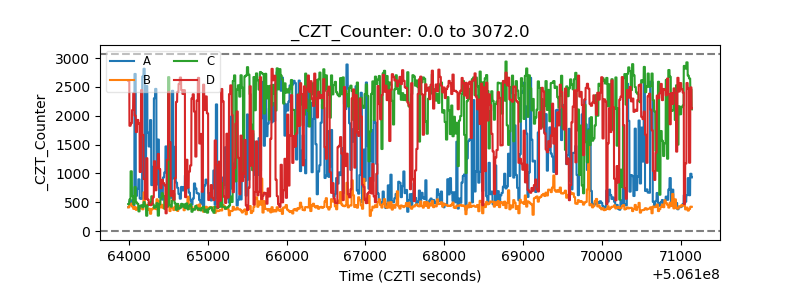 |
| +2.5 Volts monitor |  |
| +5 Volts monitor |  |
| _ROLL_ROT | 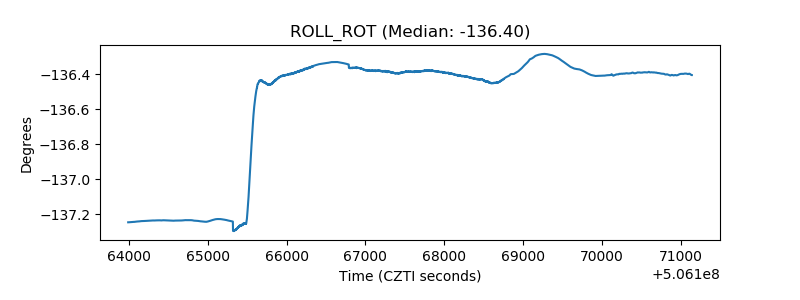 |
| _Roll_DEC | 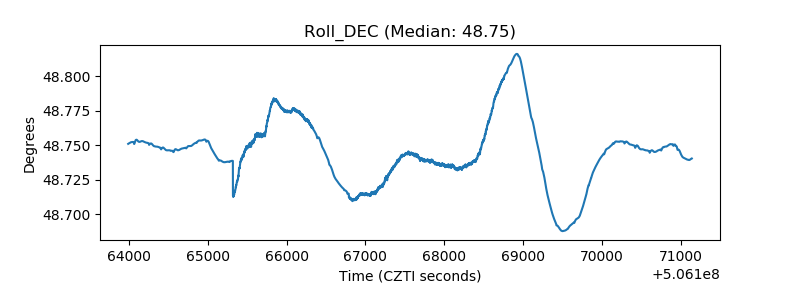 |
| _Roll_RA | 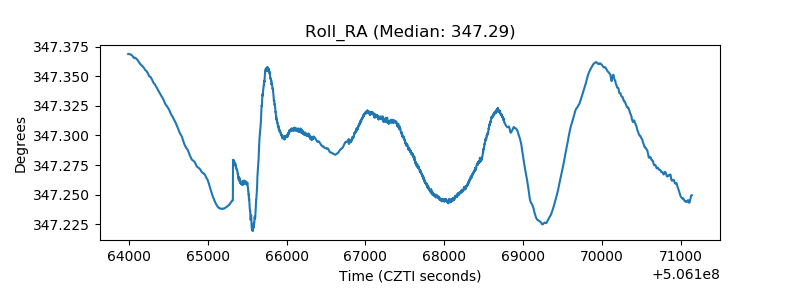 |
| Veto Counter | 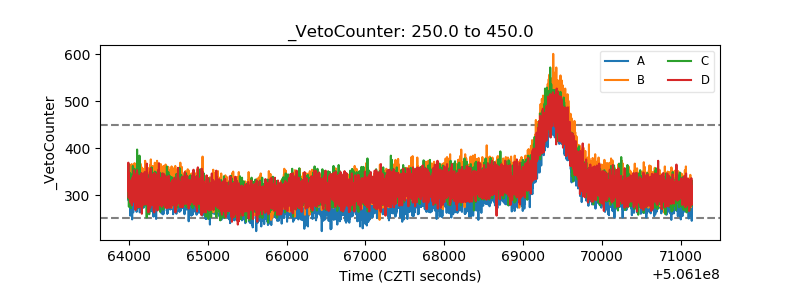 |