| Param | Original file | Final file |
|---|---|---|
| Filename | modeM0/AS1A14_099T04_9000006540_55727cztM0_level2.fits | modeM0/AS1A14_099T04_9000006540_55727cztM0_level2_quad_clean.evt |
| Size (bytes) | 991,252,800 | 79,678,080 |
| Size | 945.3 MB | 76.0 MB |
| Events in quadrant A | 9,749,437 | 447,274 |
| Events in quadrant B | 3,077,795 | 714,917 |
| Events in quadrant C | 10,453,958 | 422,937 |
| Events in quadrant D | 12,855,279 | 325,629 |
| Mode M0 | |||
|---|---|---|---|
| Quadrant | BADHDUFLAG | Total packets | Discarded packets |
| A | 0 | 33896 | 0 |
| B | 0 | 14691 | 0 |
| C | 0 | 36113 | 0 |
| D | 0 | 43186 | 0 |
| Mode SS | |||
|---|---|---|---|
| Quadrant | BADHDUFLAG | Total packets | Discarded packets |
| A | 0 | 144 | 0 |
| B | 0 | 144 | 0 |
| C | 0 | 144 | 0 |
| D | 0 | 144 | 0 |
| Quadrant | Total seconds | Saturated seconds | Saturation percentage |
|---|---|---|---|
| A | 7197 | 2532 | 35.181326% |
| B | 7198 | 12 | 0.166713% |
| C | 7198 | 2679 | 37.218672% |
| D | 7198 | 3605 | 50.083356% |
Noise dominated data is calculated using 1-second bins in cleaned event files. If a bin has >2000 counts, and if more than 50% of those come from <1% of pixels, then it is considered to be noise-dominated and hence unusable.
| Quadrant | # 1 sec bins | Bins with >0 counts | Bins with >2000 counts | High rate bins dominated by noise | Noise dominated (total time) | Noise dominated (detector-on time) | Marked lightcurve |
|---|---|---|---|---|---|---|---|
| A | 7197 | 7195 | 1989 | 1989 | 27.64% | 27.64% | 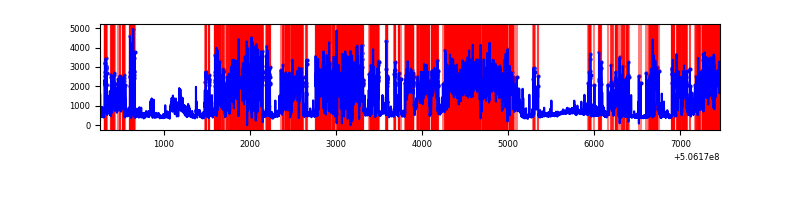 |
| B | 7198 | 7198 | 1 | 1 | 0.01% | 0.01% | 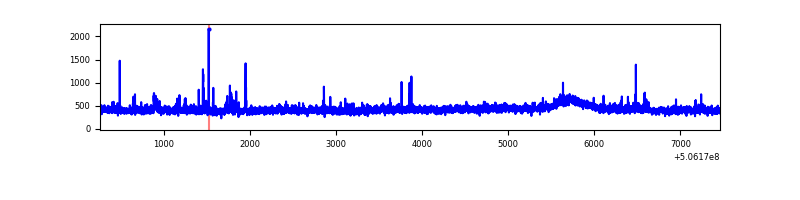 |
| C | 7198 | 7197 | 2415 | 2415 | 33.55% | 33.56% | 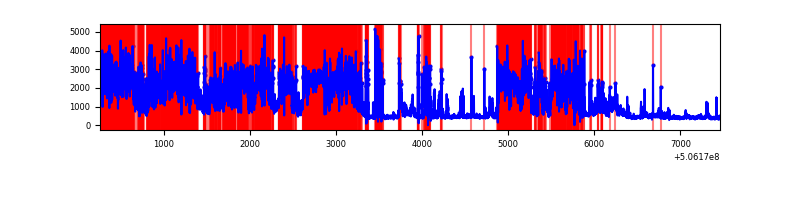 |
| D | 7198 | 7198 | 3203 | 3203 | 44.50% | 44.50% | 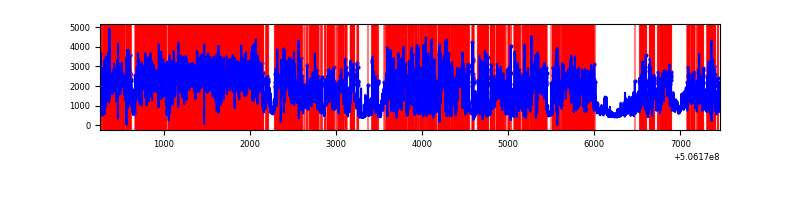 |
Top three noisy pixels from each quadrant. If the there are fewer than three noisy pixels in the level2.evt file, extra rows are filled as -1
| Pixel properties | Quadrant properties | ||||||
|---|---|---|---|---|---|---|---|
| Quadrant | DetID | PixID | Counts | Sigma | Mean | Median | Sigma |
| A | 15 | 32 | 6261813 | 40276.96 | 625 | 610 | 155.5 |
| A | 0 | 8 | 374497 | 2405.13 | 625 | 610 | 155.5 |
| A | 12 | 115 | 201256 | 1290.71 | 625 | 610 | 155.5 |
| B | 0 | 199 | 57900 | 354.66 | 742 | 715 | 161.2 |
| B | 4 | 206 | 52462 | 320.94 | 742 | 715 | 161.2 |
| B | 12 | 111 | 19806 | 118.4 | 742 | 715 | 161.2 |
| C | 9 | 38 | 4330786 | 26364.82 | 598 | 593 | 164.2 |
| C | 15 | 199 | 2671698 | 16263.29 | 598 | 593 | 164.2 |
| C | 14 | 96 | 377417 | 2294.33 | 598 | 593 | 164.2 |
| D | 11 | 129 | 10443658 | 66439.55 | 550 | 527 | 157.2 |
| D | 10 | 181 | 68233 | 430.75 | 550 | 527 | 157.2 |
| D | 8 | 245 | 67405 | 425.48 | 550 | 527 | 157.2 |
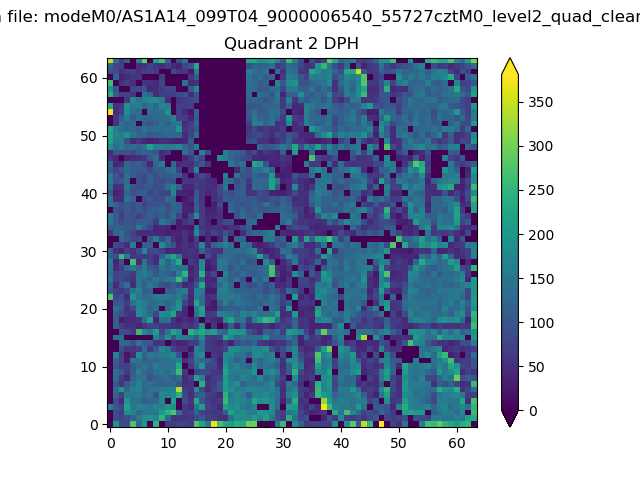
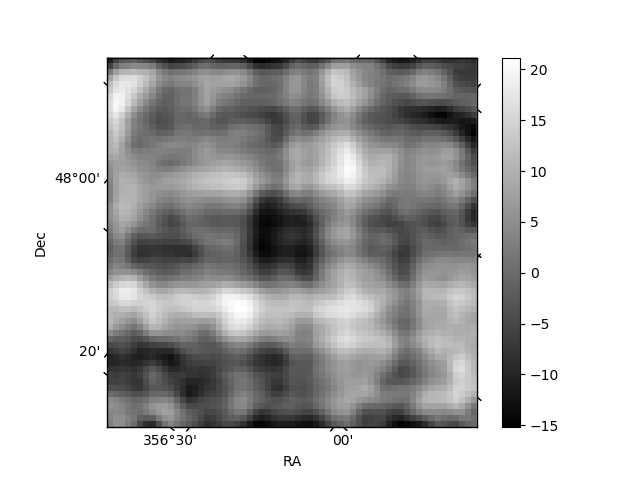
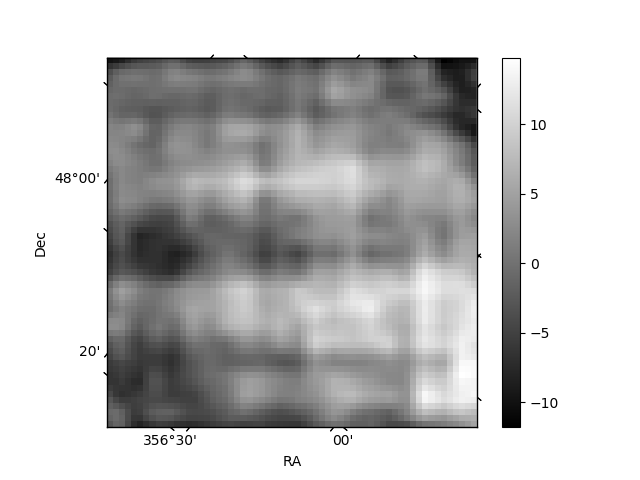
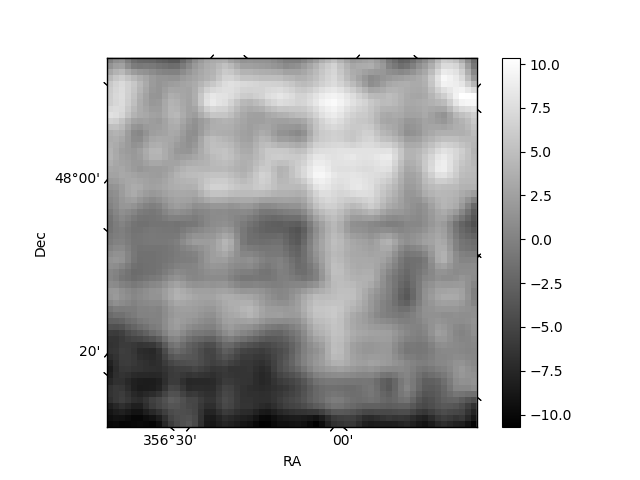
Histogram calculated using DETX and DETY for each event in the final _common_clean file
| Quadrant A | 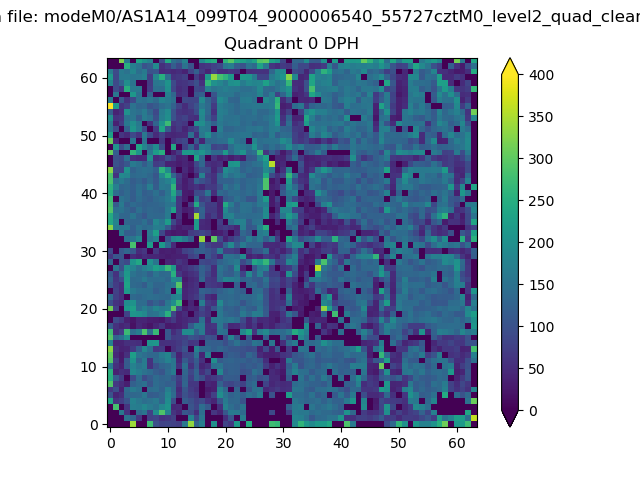 |
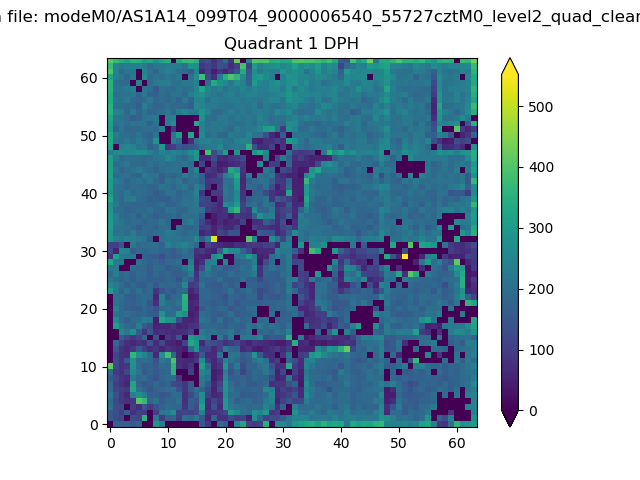 |
Quadrant B |
|---|---|---|---|
| Quadrant D | 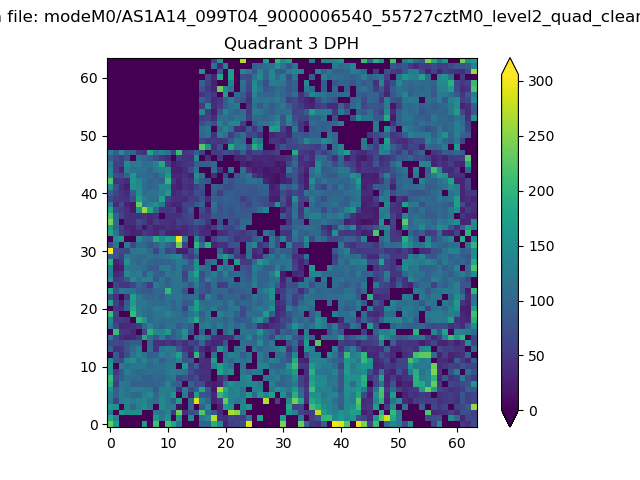 |
 |
Quadrant C |
| Plot type | Count rate plots | Images |
|---|---|---|
| Comparison with Poisson distribution Blue bars denote a histogram of data divided into 1 sec bins. Red curve is a Poisson curve with rate = median count rate of data. |
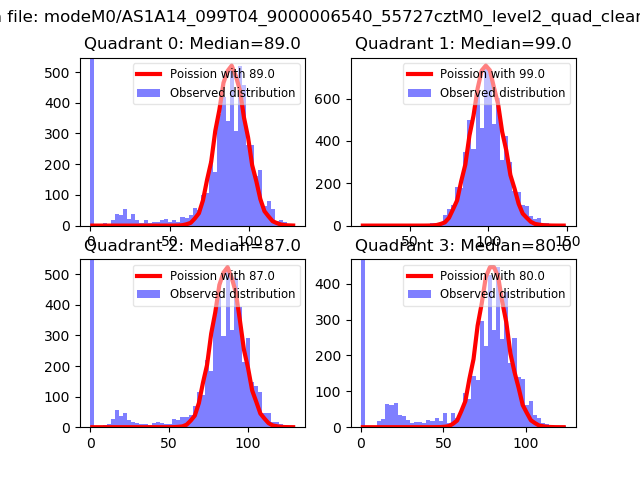 |
 |
| Quadrant-wise count rates Data is divided into 100 sec bins |
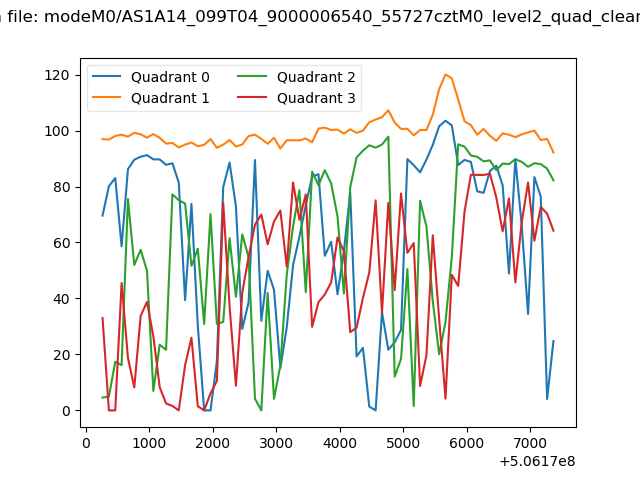 |
|
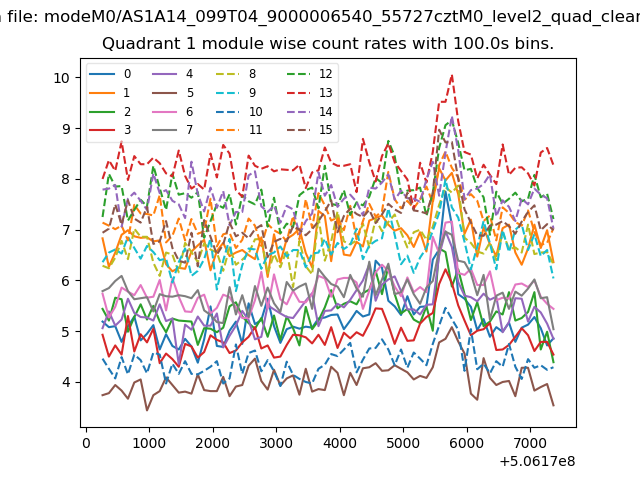
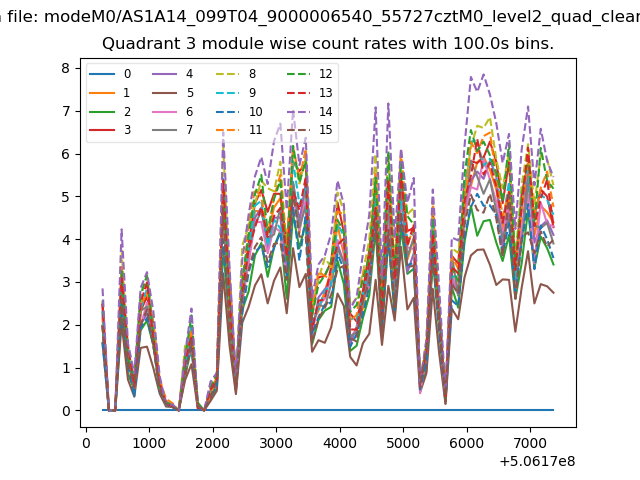
| Module-wise count rates for Quadrant A Data is divided into 100 sec bins |
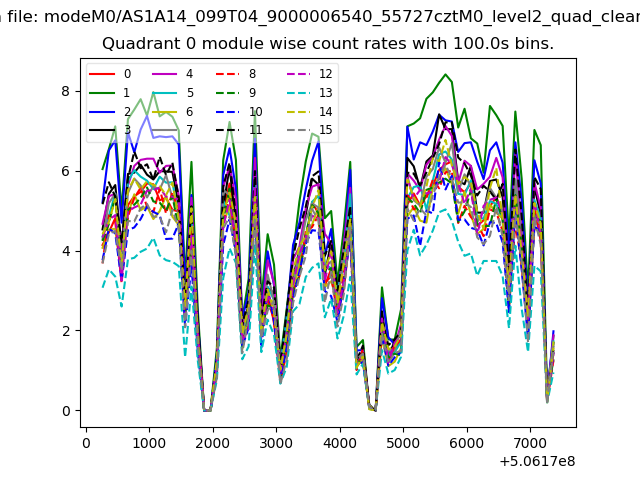 |
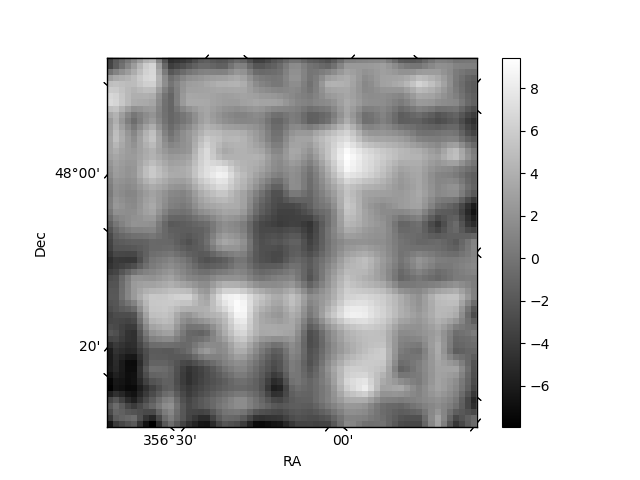 |
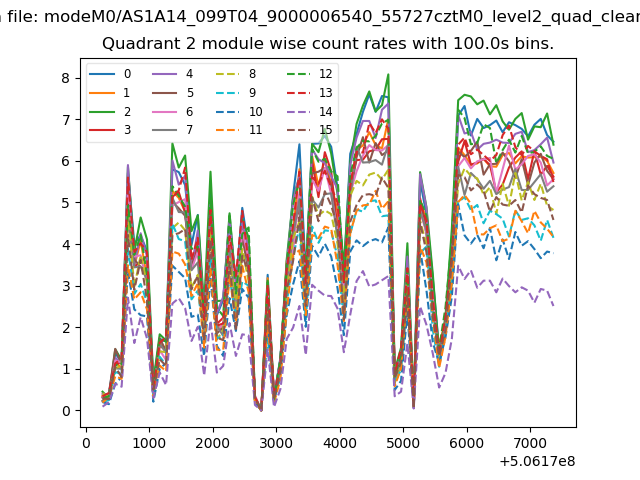
| Module-wise count rates for Quadrant B Data is divided into 100 sec bins |
 |
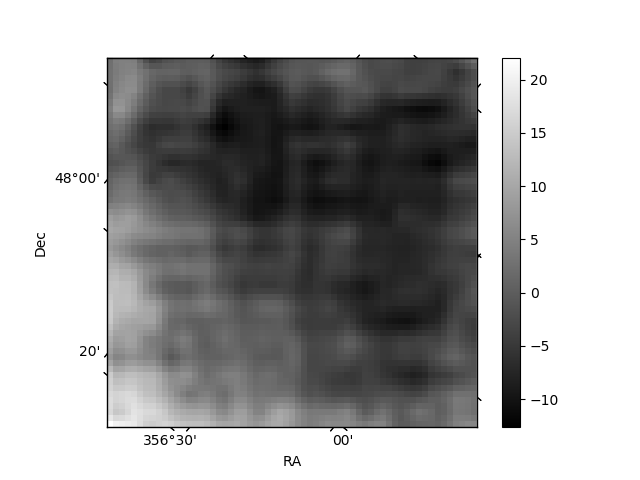 |
| Module-wise count rates for Quadrant C Data is divided into 100 sec bins |
 |
 |
| Module-wise count rates for Quadrant D Data is divided into 100 sec bins |
 |
 |
| Parameter | Plot |
|---|---|
| CZT HV Monitor | 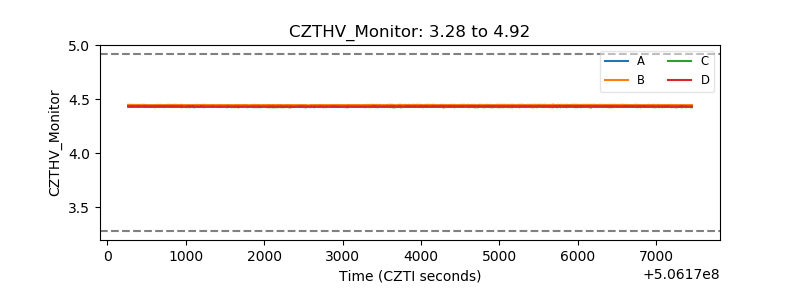 |
| D_VDD | 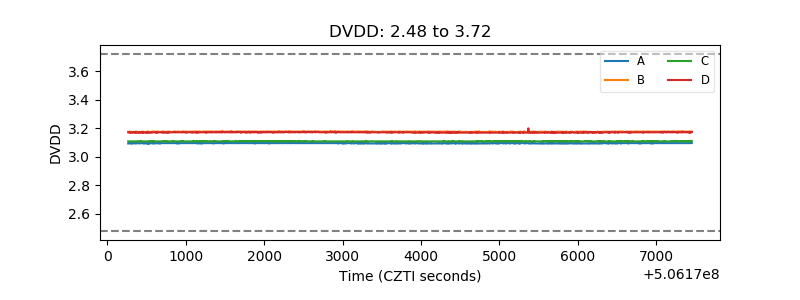 |
| Temperature 1 | 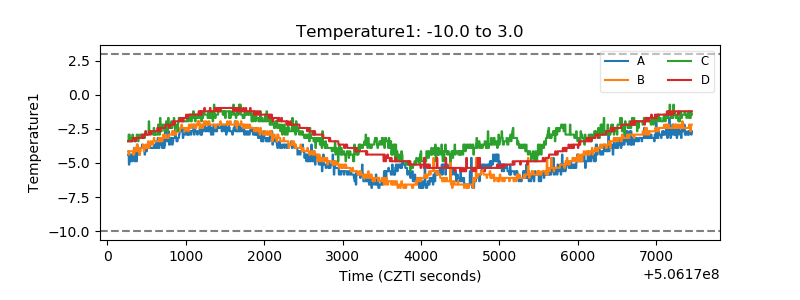 |
| Veto HV Monitor | 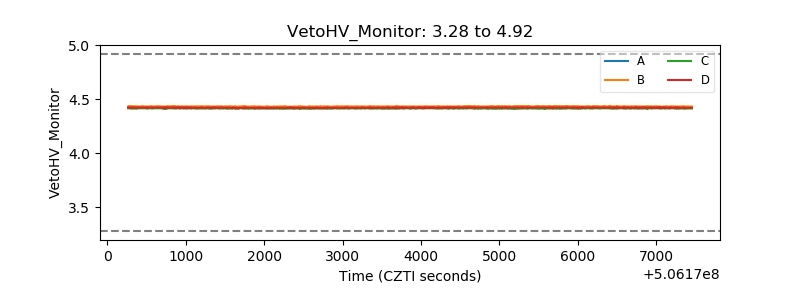 |
| Veto LLD | 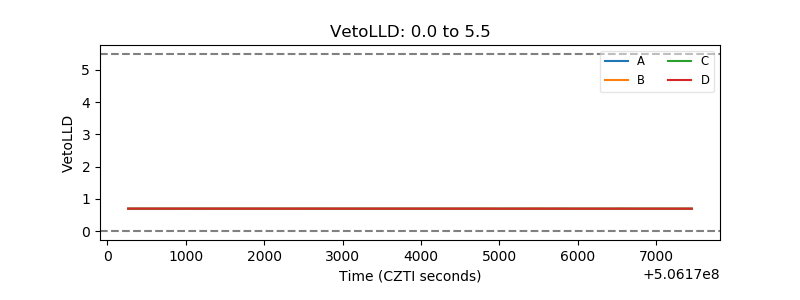 |
| Alpha Counter | 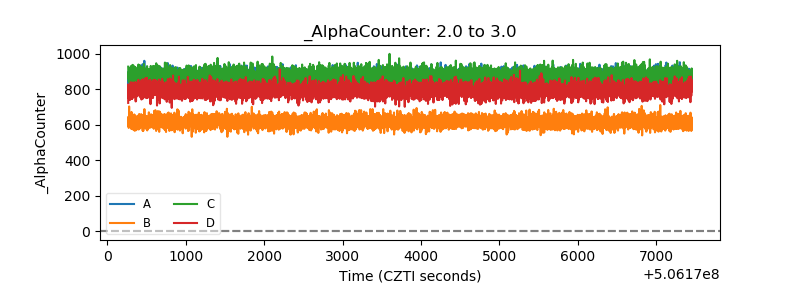 |
| _CPM_Rate | 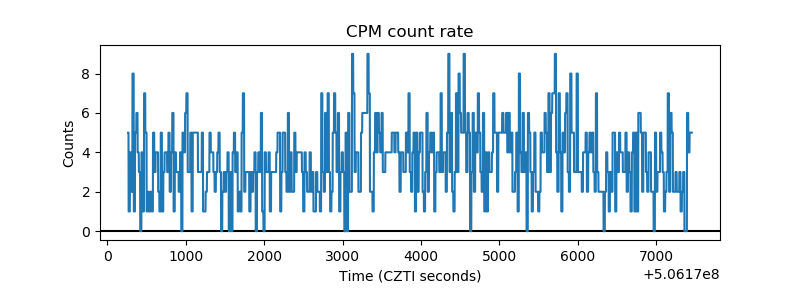 |
| CZT Counter | 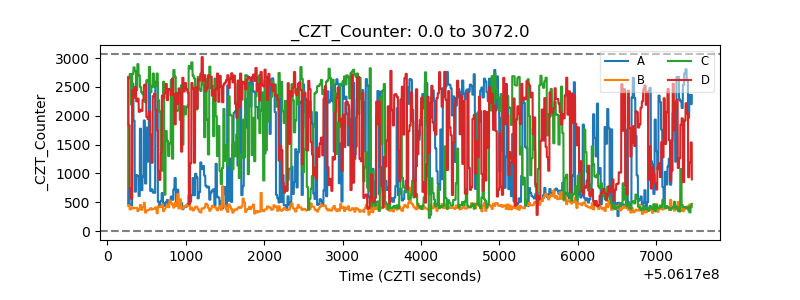 |
| +2.5 Volts monitor | 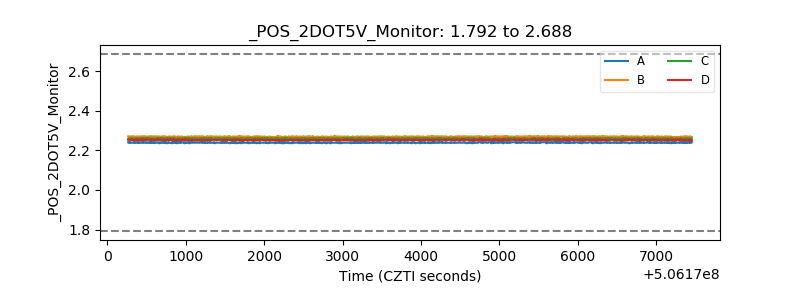 |
| +5 Volts monitor | 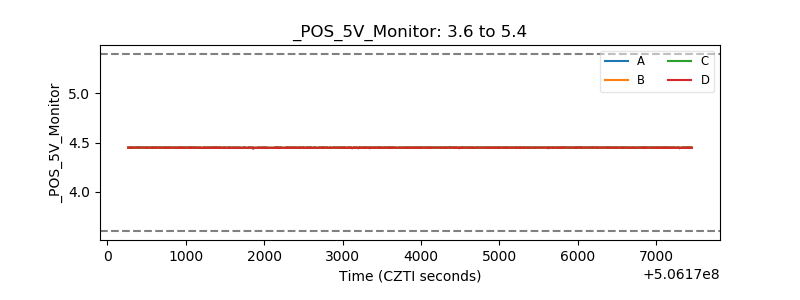 |
| _ROLL_ROT | 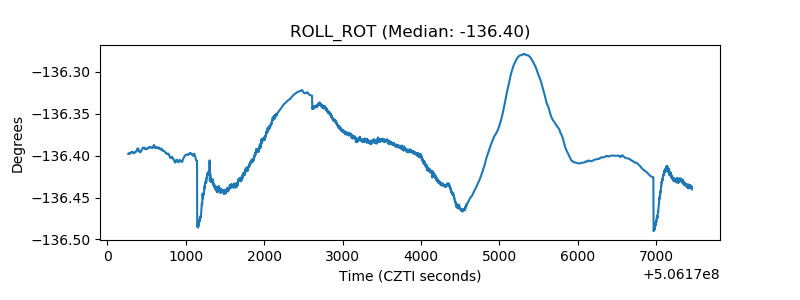 |
| _Roll_DEC | 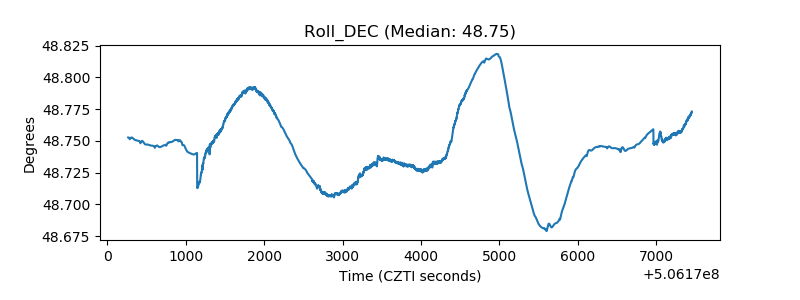 |
| _Roll_RA | 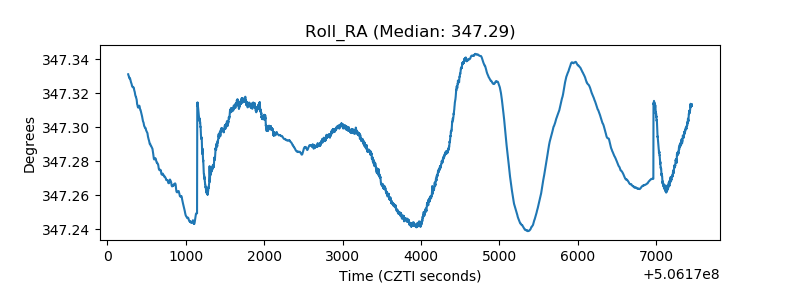 |
| Veto Counter | 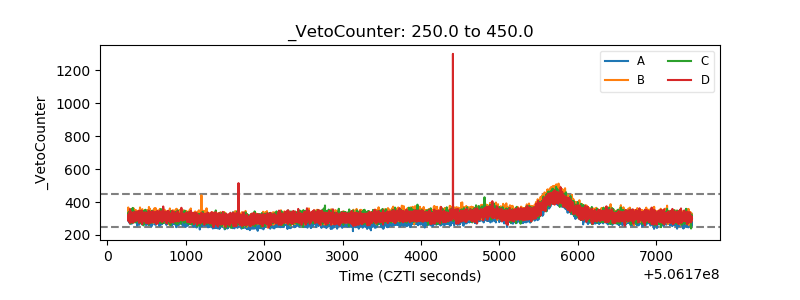 |