| Param | Original file | Final file |
|---|---|---|
| Filename | modeM0/AS1A14_099T04_9000006540_55728cztM0_level2.fits | modeM0/AS1A14_099T04_9000006540_55728cztM0_level2_quad_clean.evt |
| Size (bytes) | 1,025,196,480 | 77,463,360 |
| Size | 977.7 MB | 73.9 MB |
| Events in quadrant A | 7,948,838 | 526,303 |
| Events in quadrant B | 4,525,169 | 709,045 |
| Events in quadrant C | 13,060,754 | 231,122 |
| Events in quadrant D | 11,851,170 | 371,422 |
| Mode M0 | |||
|---|---|---|---|
| Quadrant | BADHDUFLAG | Total packets | Discarded packets |
| A | 0 | 28581 | 0 |
| B | 0 | 18794 | 0 |
| C | 0 | 43880 | 7 |
| D | 0 | 40250 | 0 |
| Mode SS | |||
|---|---|---|---|
| Quadrant | BADHDUFLAG | Total packets | Discarded packets |
| A | 0 | 146 | 0 |
| B | 0 | 146 | 0 |
| C | 0 | 146 | 0 |
| D | 0 | 146 | 0 |
| Quadrant | Total seconds | Saturated seconds | Saturation percentage |
|---|---|---|---|
| A | 7284 | 1748 | 23.997803% |
| B | 7284 | 281 | 3.857770% |
| C | 7283 | 4853 | 66.634629% |
| D | 7283 | 3073 | 42.194151% |
Noise dominated data is calculated using 1-second bins in cleaned event files. If a bin has >2000 counts, and if more than 50% of those come from <1% of pixels, then it is considered to be noise-dominated and hence unusable.
| Quadrant | # 1 sec bins | Bins with >0 counts | Bins with >2000 counts | High rate bins dominated by noise | Noise dominated (total time) | Noise dominated (detector-on time) | Marked lightcurve |
|---|---|---|---|---|---|---|---|
| A | 7284 | 7283 | 1227 | 1227 | 16.85% | 16.85% | 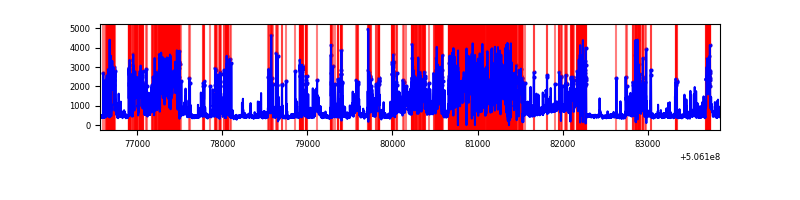 |
| B | 7284 | 7284 | 213 | 213 | 2.92% | 2.92% | 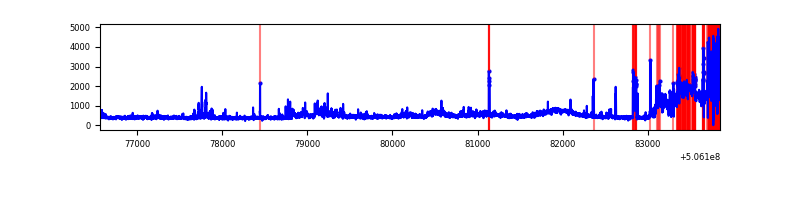 |
| C | 7283 | 7282 | 3535 | 3535 | 48.54% | 48.54% | 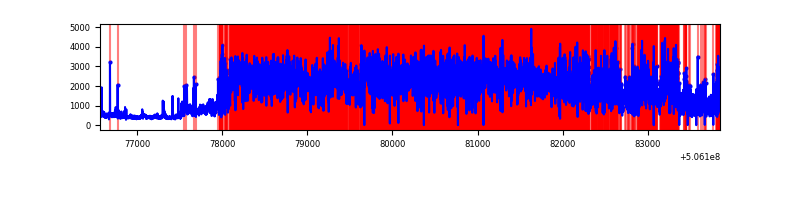 |
| D | 7282 | 7282 | 2970 | 2970 | 40.79% | 40.79% | 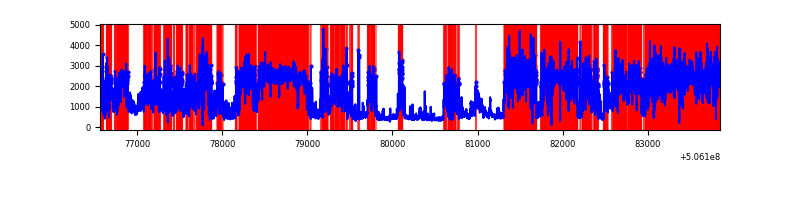 |
Top three noisy pixels from each quadrant. If the there are fewer than three noisy pixels in the level2.evt file, extra rows are filled as -1
| Pixel properties | Quadrant properties | ||||||
|---|---|---|---|---|---|---|---|
| Quadrant | DetID | PixID | Counts | Sigma | Mean | Median | Sigma |
| A | 15 | 32 | 4361964 | 26604.61 | 658 | 642 | 163.9 |
| A | 4 | 249 | 513705 | 3129.75 | 658 | 642 | 163.9 |
| A | 8 | 192 | 185034 | 1124.81 | 658 | 642 | 163.9 |
| B | 4 | 206 | 1412281 | 8768.49 | 747 | 720 | 161.0 |
| B | 5 | 172 | 63593 | 390.56 | 747 | 720 | 161.0 |
| B | 10 | 247 | 27230 | 164.68 | 747 | 720 | 161.0 |
| C | 9 | 38 | 6432643 | 50475.63 | 466 | 463 | 127.4 |
| C | 15 | 199 | 4429486 | 34756.14 | 466 | 463 | 127.4 |
| C | 14 | 96 | 163690 | 1280.9 | 466 | 463 | 127.4 |
| D | 11 | 129 | 8796302 | 52418.79 | 591 | 566 | 167.8 |
| D | 10 | 181 | 471353 | 2805.69 | 591 | 566 | 167.8 |
| D | 7 | 129 | 69626 | 411.57 | 591 | 566 | 167.8 |
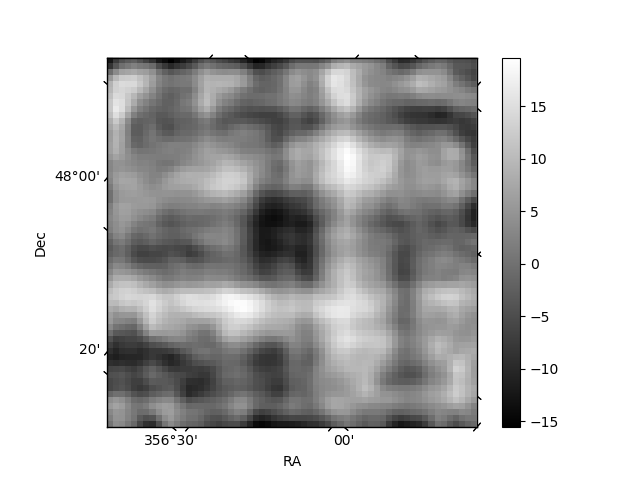
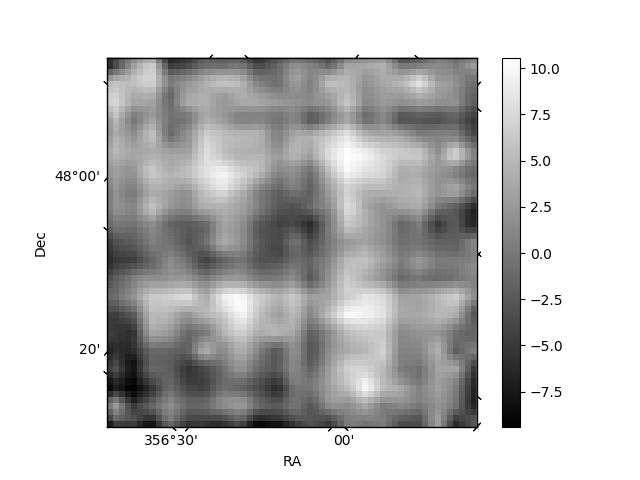
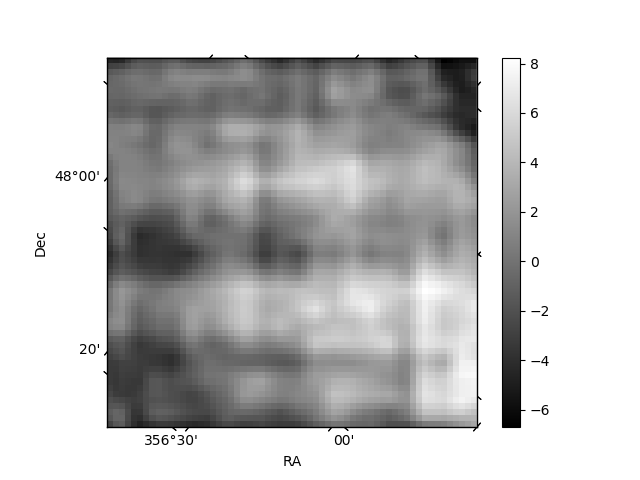
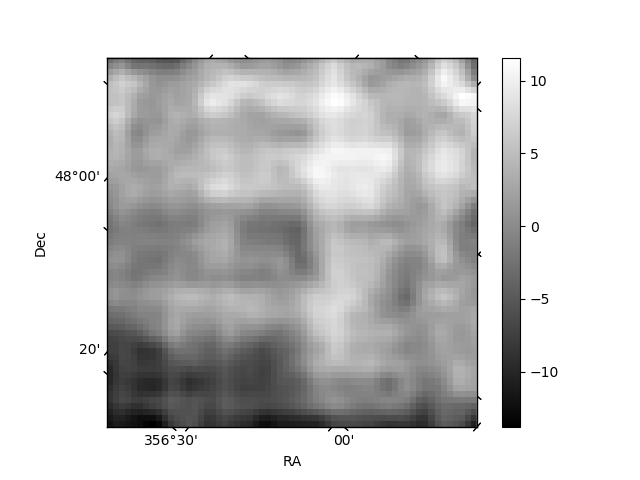
Histogram calculated using DETX and DETY for each event in the final _common_clean file
| Quadrant A | 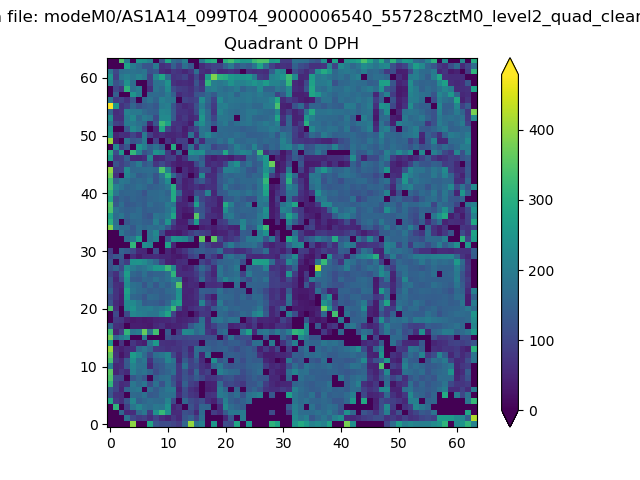 |
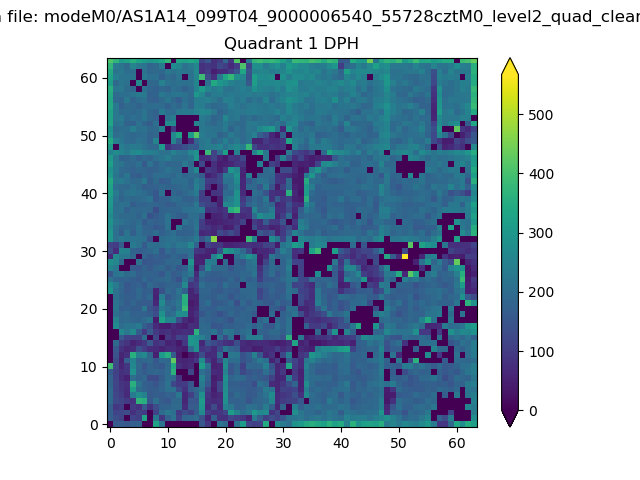 |
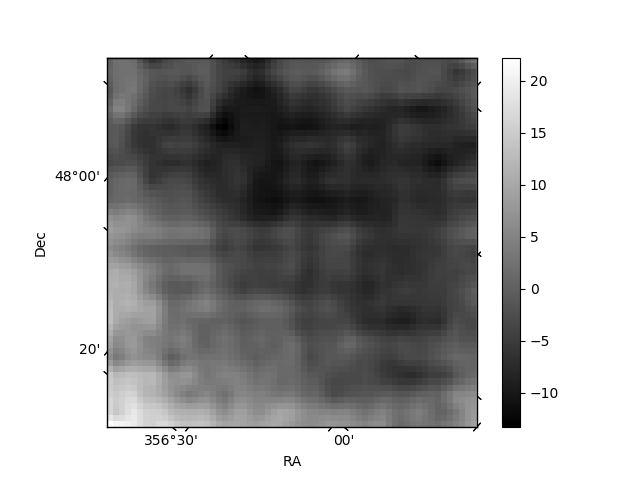
Quadrant B |
|---|---|---|---|
| Quadrant D | 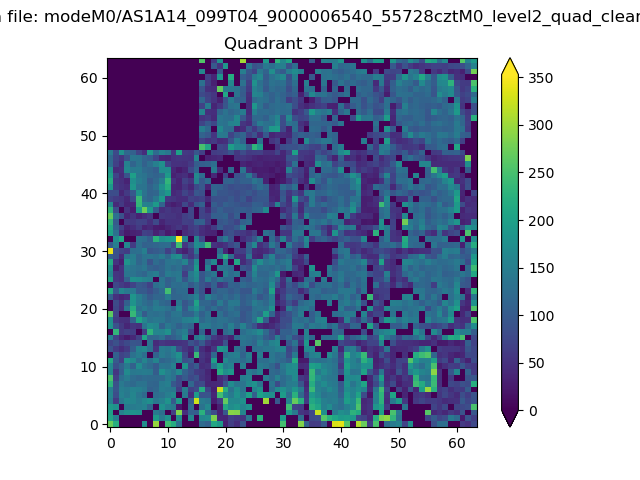 |
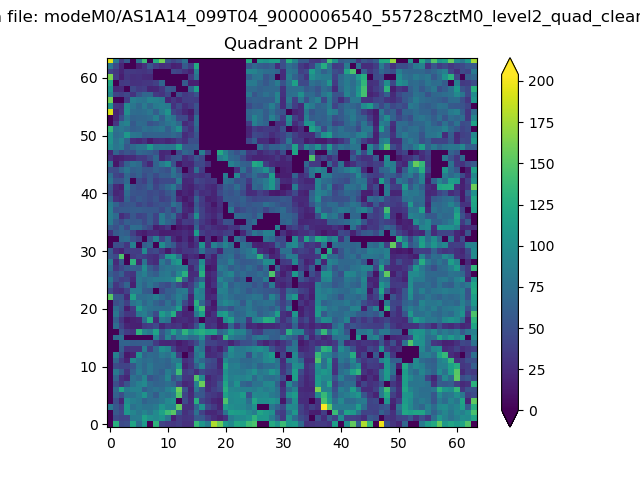 |
Quadrant C |
| Plot type | Count rate plots | Images |
|---|---|---|
| Comparison with Poisson distribution Blue bars denote a histogram of data divided into 1 sec bins. Red curve is a Poisson curve with rate = median count rate of data. |
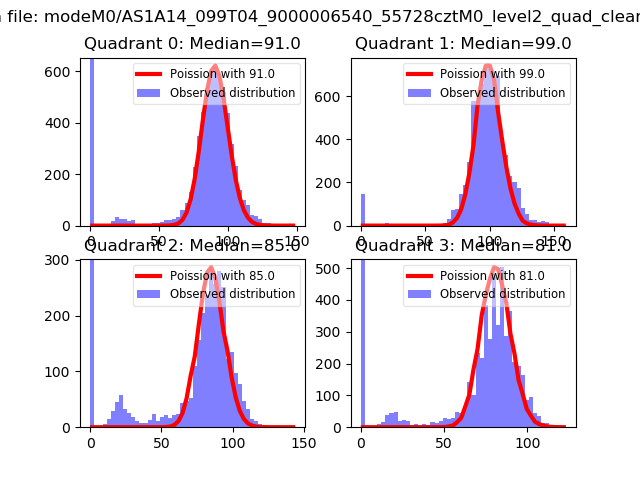 |
 |
| Quadrant-wise count rates Data is divided into 100 sec bins |
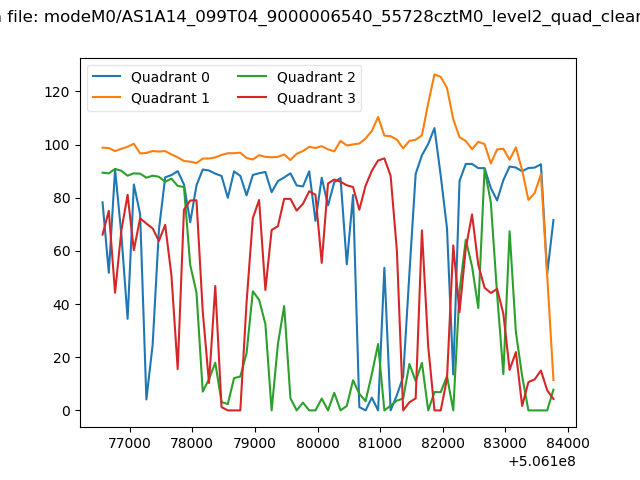 |
|
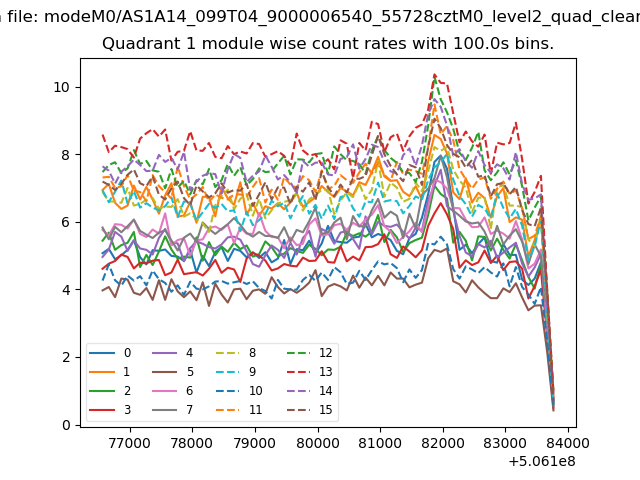
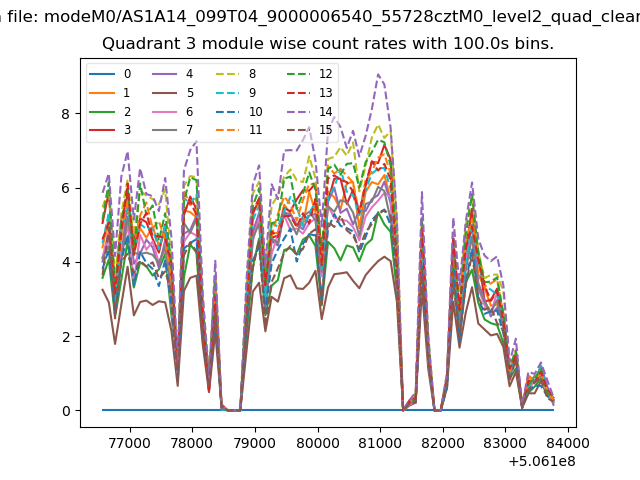
| Module-wise count rates for Quadrant A Data is divided into 100 sec bins |
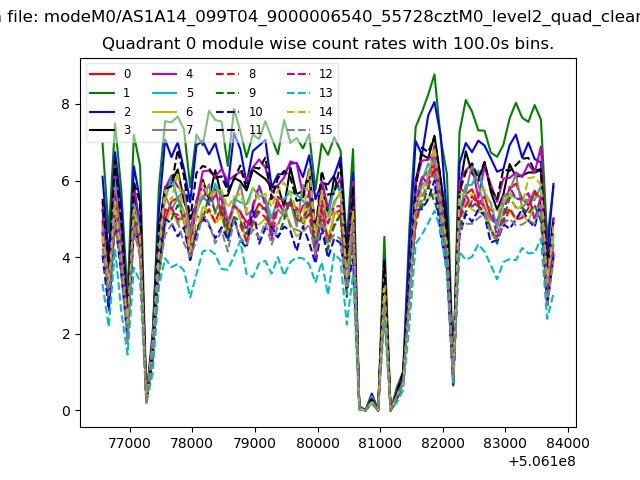 |
 |
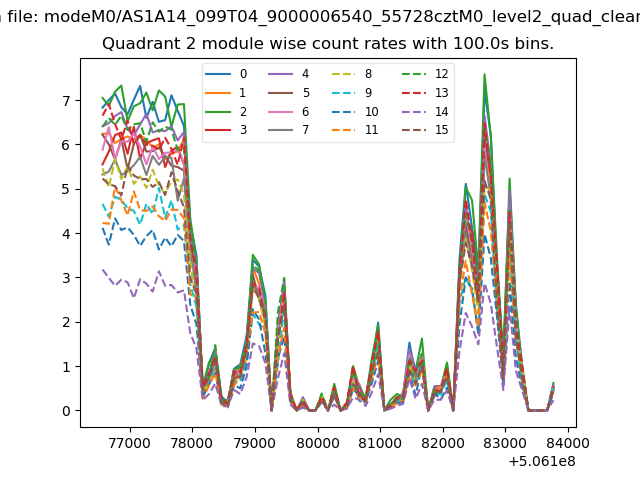
| Module-wise count rates for Quadrant B Data is divided into 100 sec bins |
 |
 |
| Module-wise count rates for Quadrant C Data is divided into 100 sec bins |
 |
 |
| Module-wise count rates for Quadrant D Data is divided into 100 sec bins |
 |
 |
| Parameter | Plot |
|---|---|
| CZT HV Monitor |  |
| D_VDD | 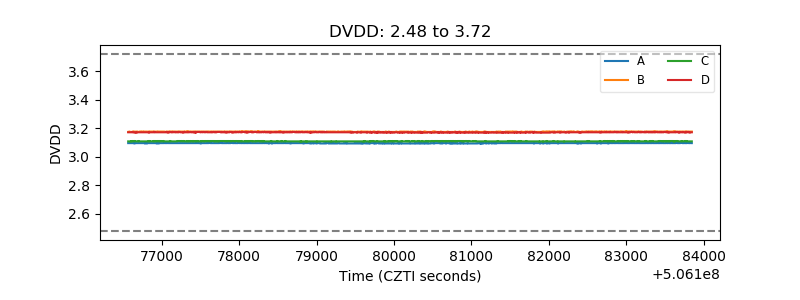 |
| Temperature 1 | 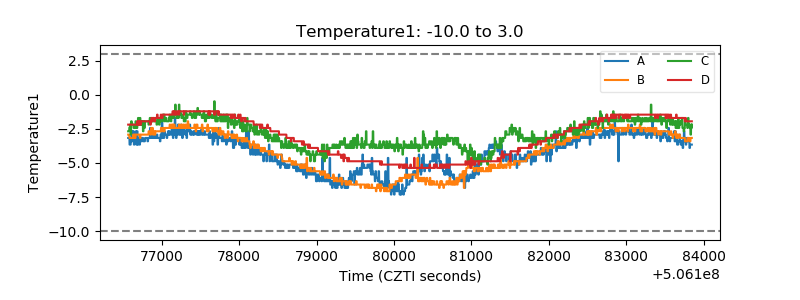 |
| Veto HV Monitor | 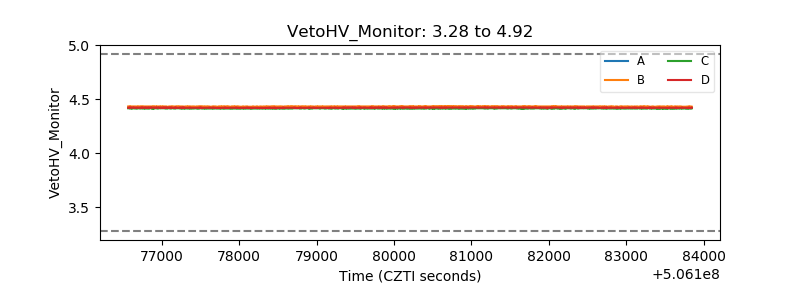 |
| Veto LLD | 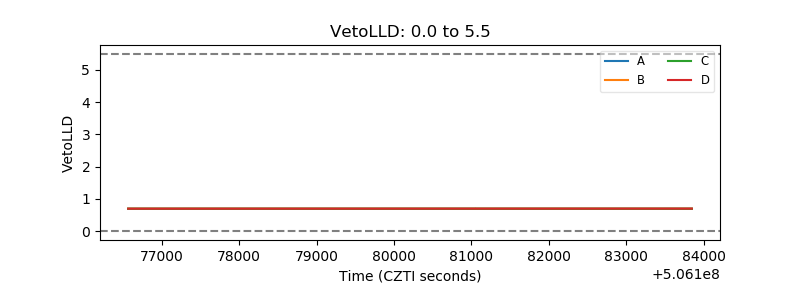 |
| Alpha Counter | 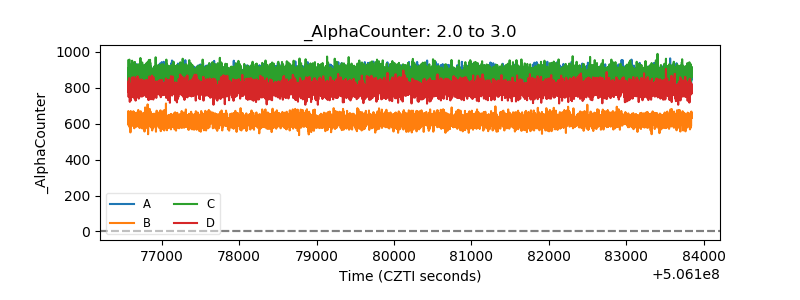 |
| _CPM_Rate | 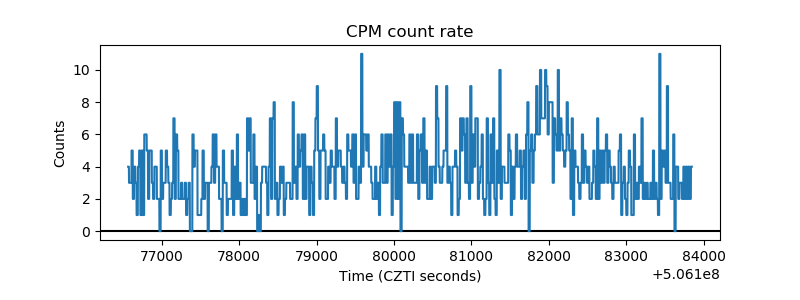 |
| CZT Counter | 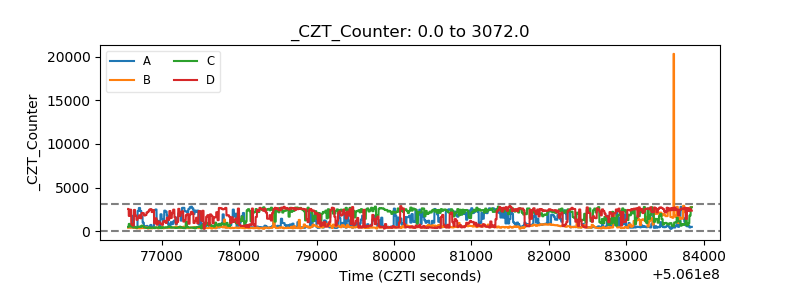 |
| +2.5 Volts monitor |  |
| +5 Volts monitor |  |
| _ROLL_ROT | 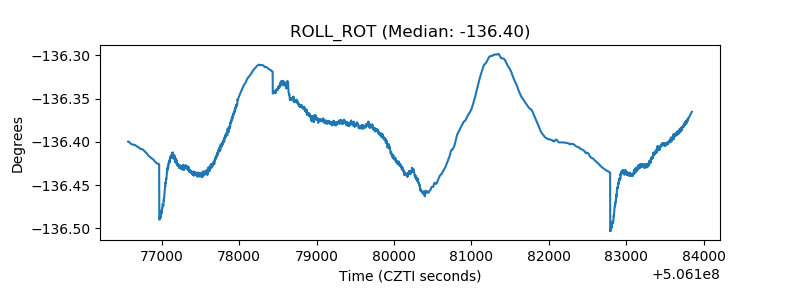 |
| _Roll_DEC | 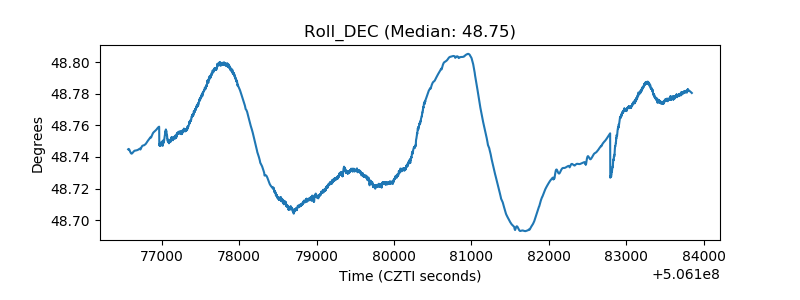 |
| _Roll_RA | 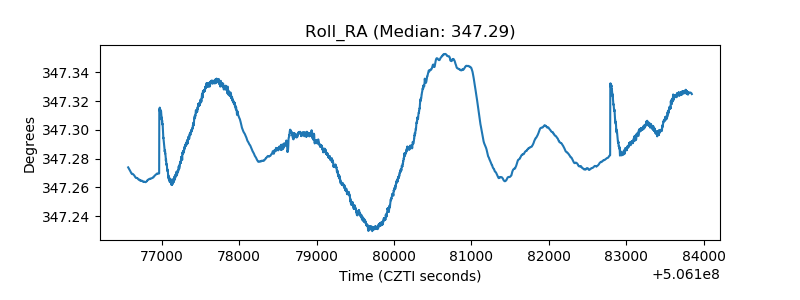 |
| Veto Counter | 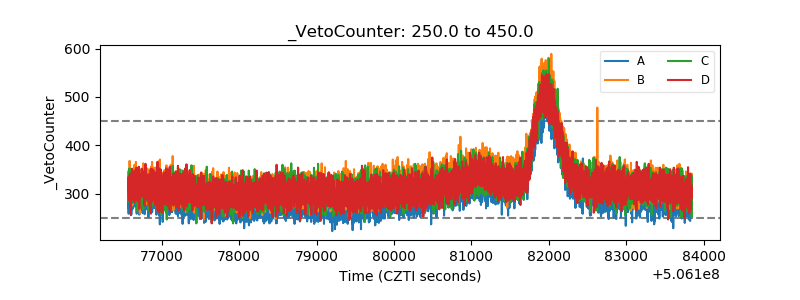 |