| Param | Original file | Final file |
|---|---|---|
| Filename | modeM0/AS1A14_099T04_9000006540_55731cztM0_level2.fits | modeM0/AS1A14_099T04_9000006540_55731cztM0_level2_quad_clean.evt |
| Size (bytes) | 3,011,716,800 | 165,404,160 |
| Size | 2.8 GB | 157.7 MB |
| Events in quadrant A | 17,012,105 | 1,342,350 |
| Events in quadrant B | 32,139,737 | 937,371 |
| Events in quadrant C | 29,107,293 | 750,227 |
| Events in quadrant D | 31,839,437 | 733,102 |
| Mode M0 | |||
|---|---|---|---|
| Quadrant | BADHDUFLAG | Total packets | Discarded packets |
| A | 0 | 62774 | 3 |
| B | 0 | 107946 | 3 |
| C | 0 | 98873 | 4 |
| D | 0 | 106900 | 3 |
| Mode M9 | |||
|---|---|---|---|
| Quadrant | BADHDUFLAG | Total packets | Discarded packets |
| A | 0 | 16 | 0 |
| B | 0 | 16 | 0 |
| C | 0 | 16 | 0 |
| D | 0 | 16 | 0 |
| Mode SS | |||
|---|---|---|---|
| Quadrant | BADHDUFLAG | Total packets | Discarded packets |
| A | 0 | 366 | 0 |
| B | 0 | 366 | 0 |
| C | 0 | 366 | 0 |
| D | 0 | 366 | 0 |
| Quadrant | Total seconds | Saturated seconds | Saturation percentage |
|---|---|---|---|
| A | 18037 | 3237 | 17.946443% |
| B | 18037 | 9059 | 50.224538% |
| C | 18036 | 9988 | 55.378133% |
| D | 18037 | 9668 | 53.600931% |
Noise dominated data is calculated using 1-second bins in cleaned event files. If a bin has >2000 counts, and if more than 50% of those come from <1% of pixels, then it is considered to be noise-dominated and hence unusable.
| Quadrant | # 1 sec bins | Bins with >0 counts | Bins with >2000 counts | High rate bins dominated by noise | Noise dominated (total time) | Noise dominated (detector-on time) | Marked lightcurve |
|---|---|---|---|---|---|---|---|
| A | 19627 | 18039 | 2424 | 2424 | 12.35% | 13.44% | 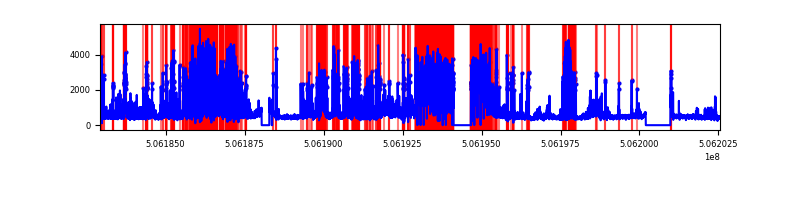 |
| B | 19627 | 18039 | 7936 | 7936 | 40.43% | 43.99% | 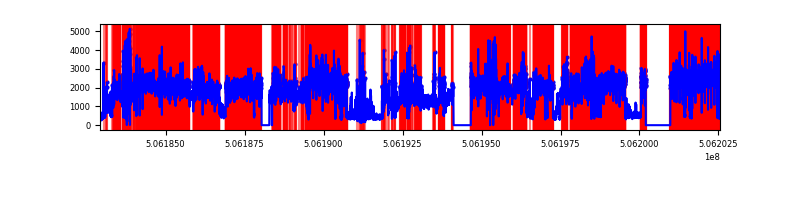 |
| C | 19626 | 18034 | 7220 | 7220 | 36.79% | 40.04% | 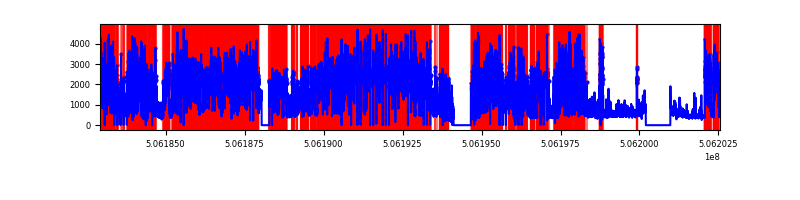 |
| D | 19627 | 18038 | 8823 | 8823 | 44.95% | 48.91% | 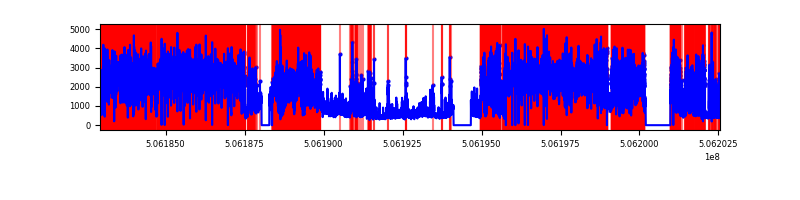 |
Top three noisy pixels from each quadrant. If the there are fewer than three noisy pixels in the level2.evt file, extra rows are filled as -1
| Pixel properties | Quadrant properties | ||||||
|---|---|---|---|---|---|---|---|
| Quadrant | DetID | PixID | Counts | Sigma | Mean | Median | Sigma |
| A | 15 | 32 | 8134155 | 19680.02 | 1686 | 1645 | 413.2 |
| A | 0 | 8 | 728820 | 1759.71 | 1686 | 1645 | 413.2 |
| A | 8 | 192 | 479064 | 1155.32 | 1686 | 1645 | 413.2 |
| B | 4 | 206 | 25830806 | 77652.21 | 1550 | 1492 | 332.6 |
| B | 0 | 199 | 81815 | 241.48 | 1550 | 1492 | 332.6 |
| B | 12 | 111 | 40031 | 115.86 | 1550 | 1492 | 332.6 |
| C | 15 | 199 | 13861451 | 41311.75 | 1230 | 1221 | 335.5 |
| C | 9 | 38 | 8853942 | 26386.38 | 1230 | 1221 | 335.5 |
| C | 14 | 96 | 550010 | 1635.72 | 1230 | 1221 | 335.5 |
| D | 11 | 129 | 25689074 | 66647.03 | 1374 | 1312 | 385.4 |
| D | 8 | 245 | 270248 | 697.75 | 1374 | 1312 | 385.4 |
| D | 6 | 239 | 223760 | 577.14 | 1374 | 1312 | 385.4 |
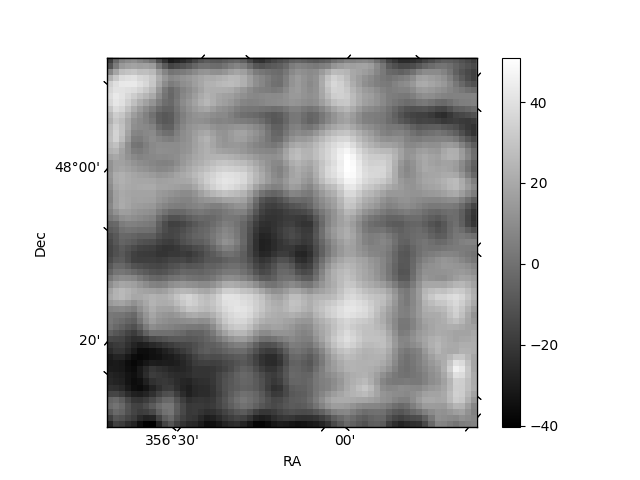
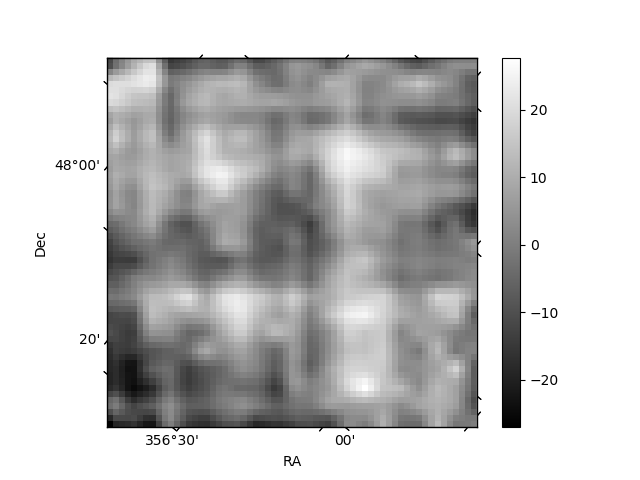
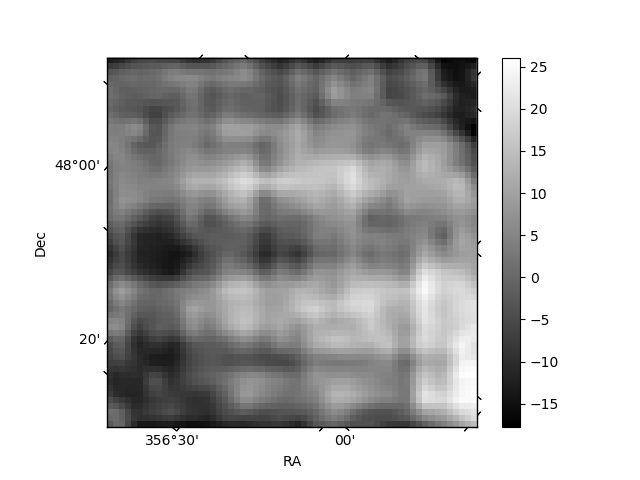
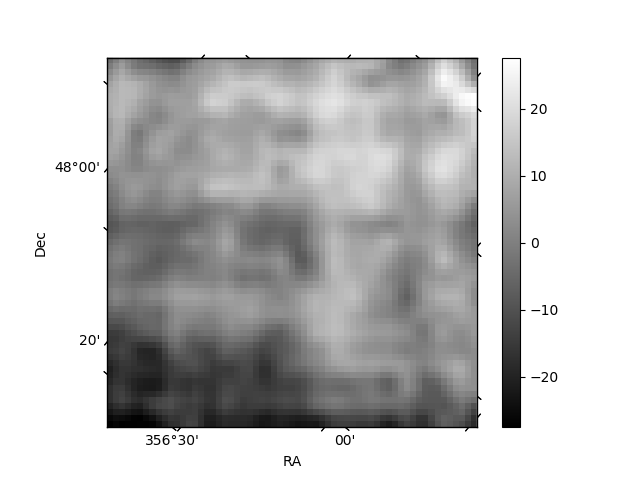
Histogram calculated using DETX and DETY for each event in the final _common_clean file
| Quadrant A | 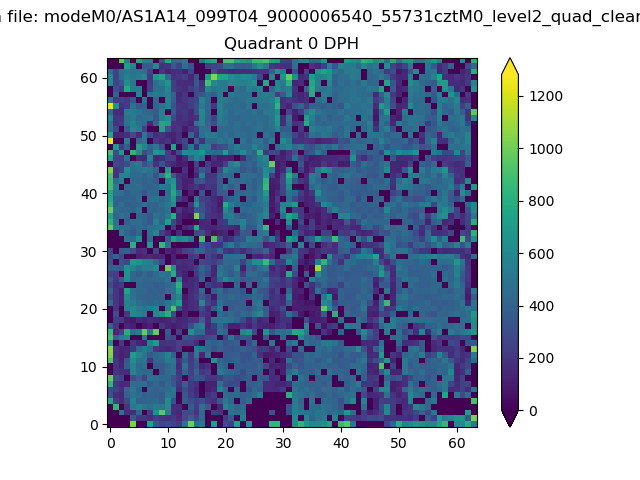 |
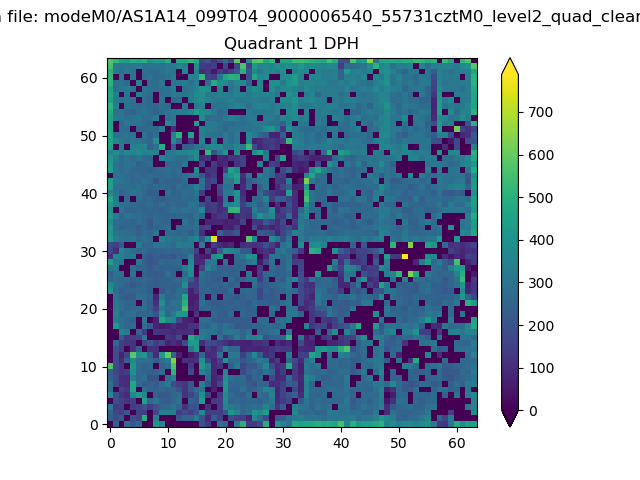 |
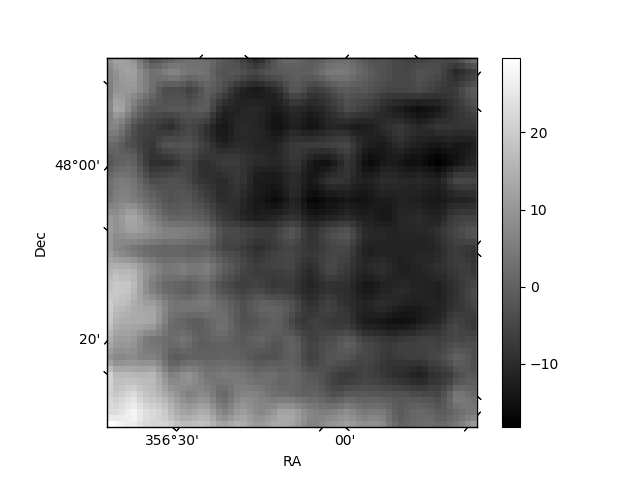
Quadrant B |
|---|---|---|---|
| Quadrant D | 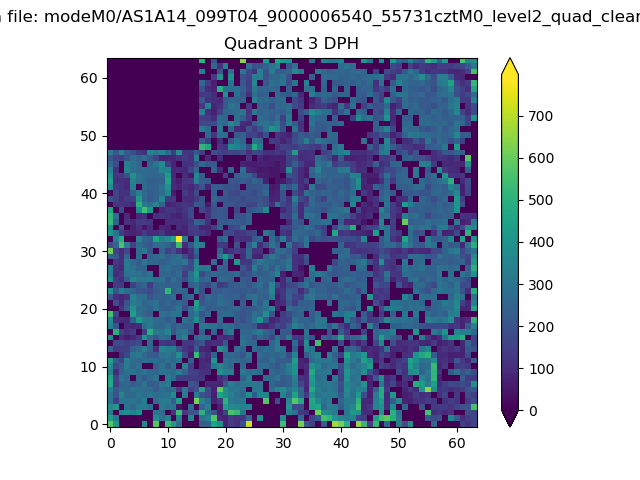 |
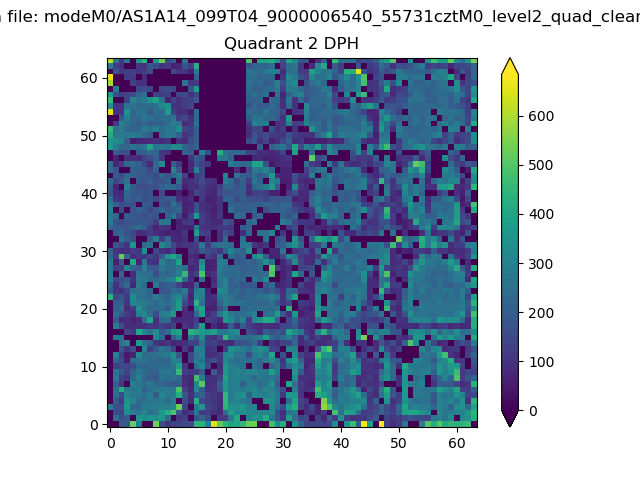 |
Quadrant C |
| Plot type | Count rate plots | Images |
|---|---|---|
| Comparison with Poisson distribution Blue bars denote a histogram of data divided into 1 sec bins. Red curve is a Poisson curve with rate = median count rate of data. |
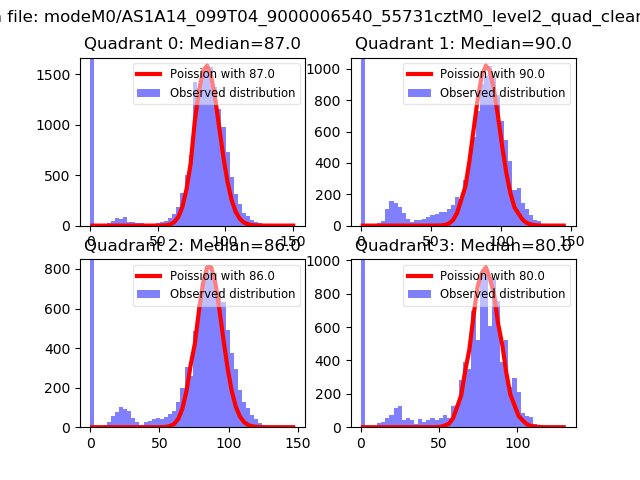 |
 |
| Quadrant-wise count rates Data is divided into 100 sec bins |
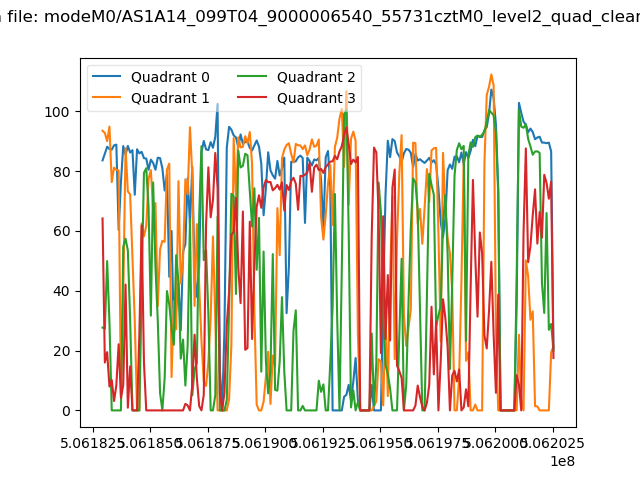 |
|
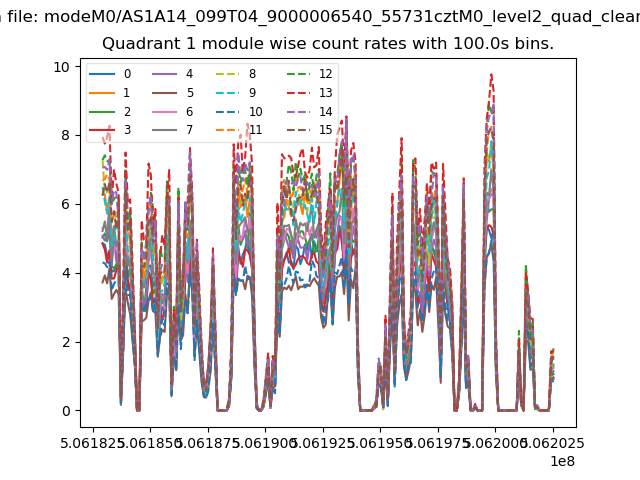
| Module-wise count rates for Quadrant A Data is divided into 100 sec bins |
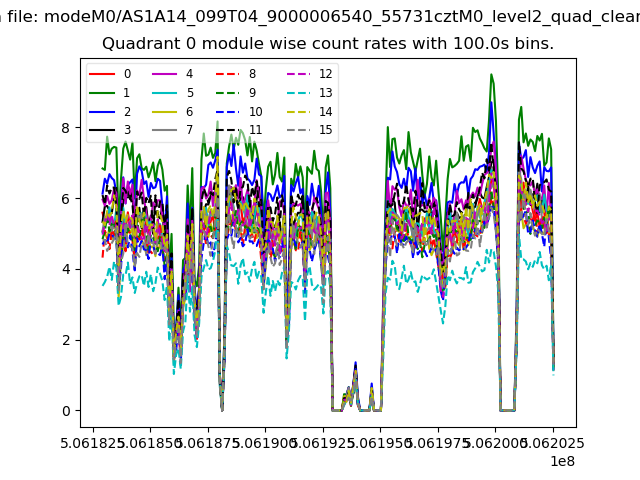 |
 |
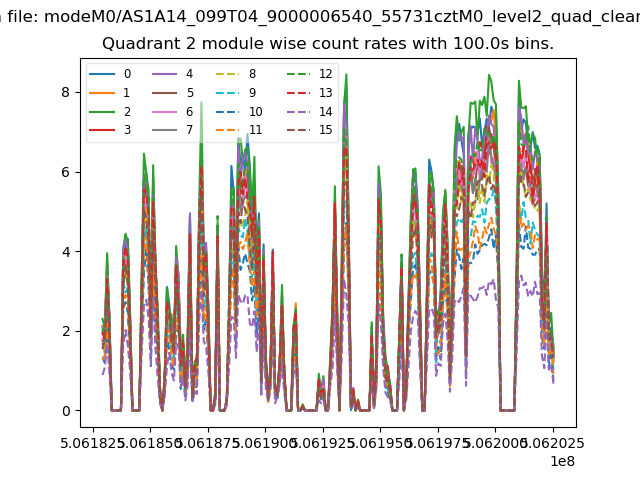
| Module-wise count rates for Quadrant B Data is divided into 100 sec bins |
 |
 |
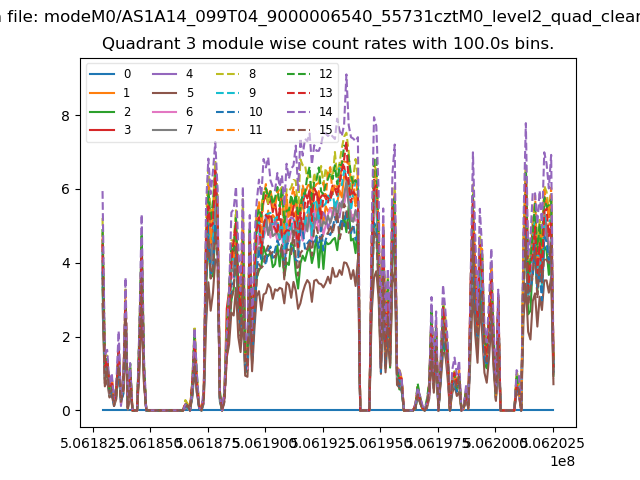
| Module-wise count rates for Quadrant C Data is divided into 100 sec bins |
 |
 |
| Module-wise count rates for Quadrant D Data is divided into 100 sec bins |
 |
 |
| Parameter | Plot |
|---|---|
| CZT HV Monitor | 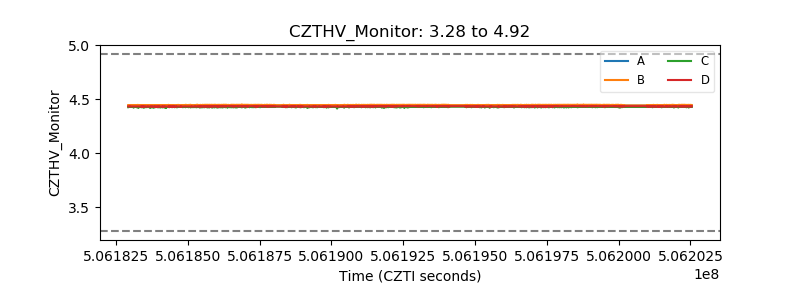 |
| D_VDD | 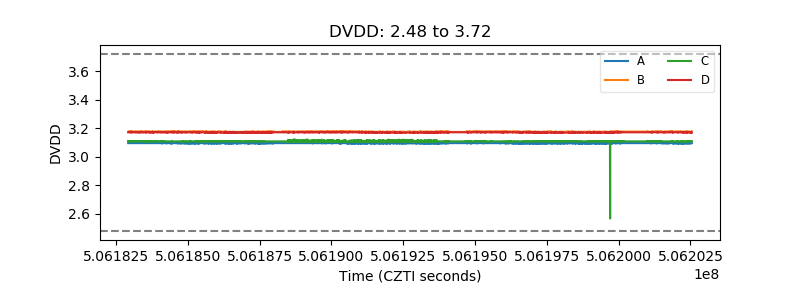 |
| Temperature 1 | 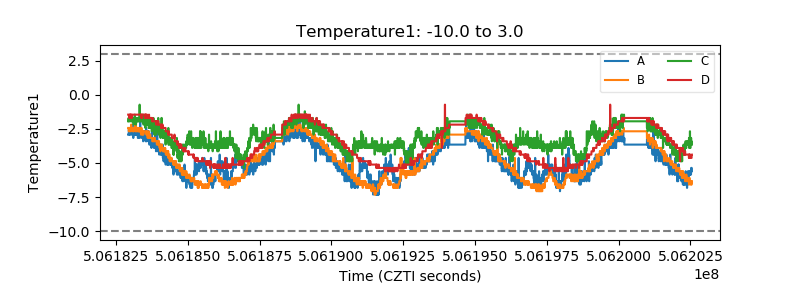 |
| Veto HV Monitor | 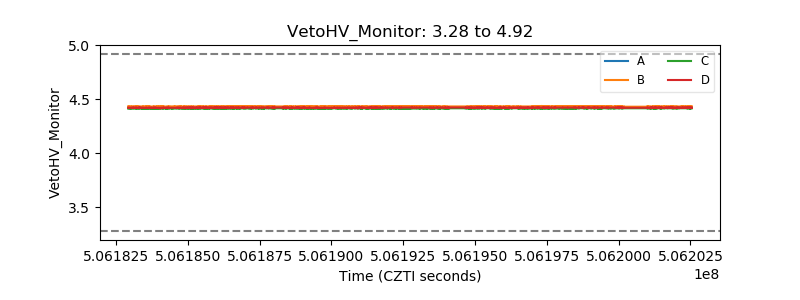 |
| Veto LLD | 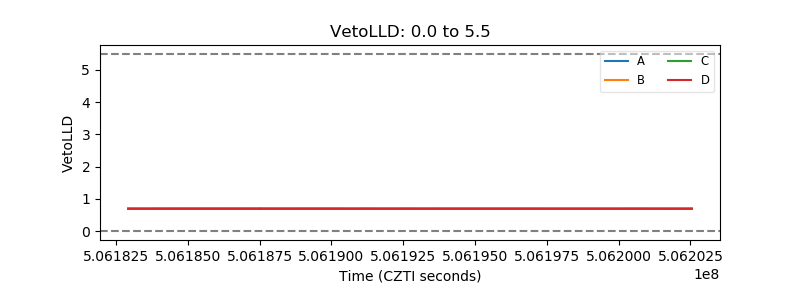 |
| Alpha Counter | 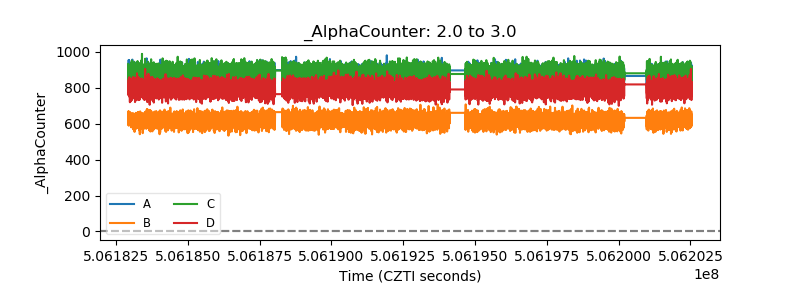 |
| _CPM_Rate | 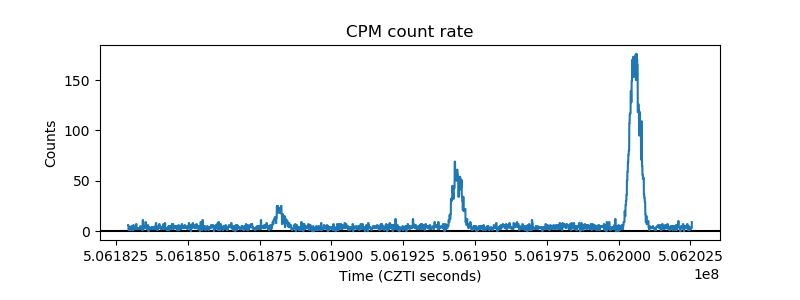 |
| CZT Counter | 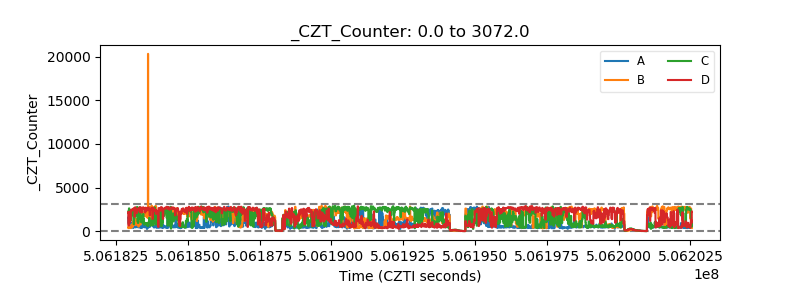 |
| +2.5 Volts monitor |  |
| +5 Volts monitor |  |
| _ROLL_ROT | 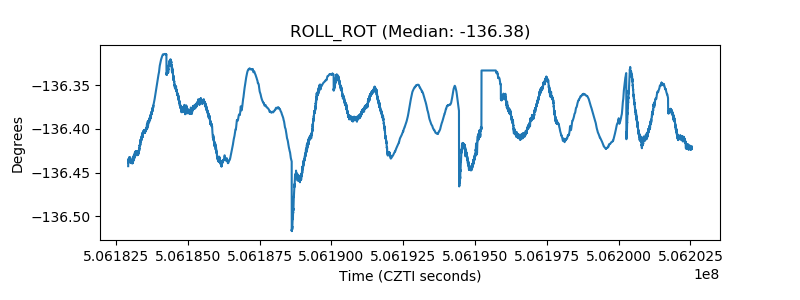 |
| _Roll_DEC | 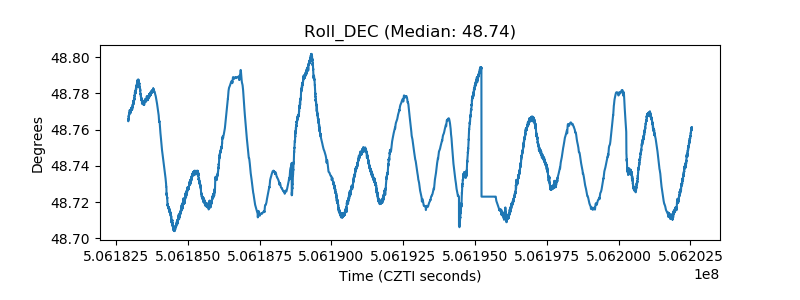 |
| _Roll_RA | 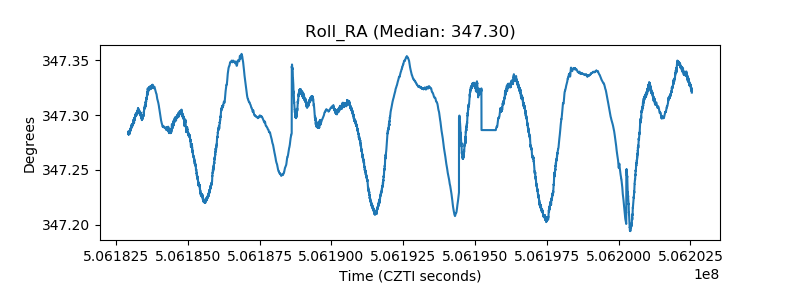 |
| Veto Counter | 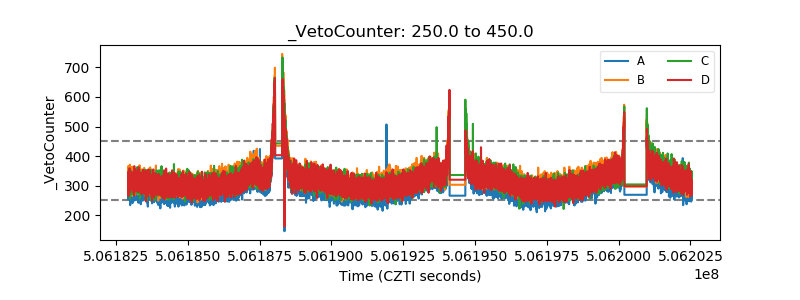 |