| Param | Original file | Final file |
|---|---|---|
| Filename | modeM0/AS1A14_099T04_9000006540_55732cztM0_level2.fits | modeM0/AS1A14_099T04_9000006540_55732cztM0_level2_quad_clean.evt |
| Size (bytes) | 955,791,360 | 68,454,720 |
| Size | 911.5 MB | 65.3 MB |
| Events in quadrant A | 8,501,637 | 432,789 |
| Events in quadrant B | 12,351,064 | 246,233 |
| Events in quadrant C | 6,480,184 | 475,164 |
| Events in quadrant D | 7,541,583 | 461,853 |
| Mode M0 | |||
|---|---|---|---|
| Quadrant | BADHDUFLAG | Total packets | Discarded packets |
| A | 0 | 29745 | 0 |
| B | 0 | 41254 | 0 |
| C | 0 | 23707 | 0 |
| D | 0 | 26897 | 0 |
| Mode M9 | |||
|---|---|---|---|
| Quadrant | BADHDUFLAG | Total packets | Discarded packets |
| A | 0 | 10 | 0 |
| B | 0 | 10 | 0 |
| C | 0 | 10 | 0 |
| D | 0 | 10 | 0 |
| Mode SS | |||
|---|---|---|---|
| Quadrant | BADHDUFLAG | Total packets | Discarded packets |
| A | 0 | 132 | 0 |
| B | 0 | 132 | 0 |
| C | 0 | 132 | 0 |
| D | 0 | 132 | 0 |
| Quadrant | Total seconds | Saturated seconds | Saturation percentage |
|---|---|---|---|
| A | 6543 | 2056 | 31.422895% |
| B | 6544 | 4189 | 64.012836% |
| C | 6544 | 1359 | 20.767115% |
| D | 6544 | 1352 | 20.660147% |
Noise dominated data is calculated using 1-second bins in cleaned event files. If a bin has >2000 counts, and if more than 50% of those come from <1% of pixels, then it is considered to be noise-dominated and hence unusable.
| Quadrant | # 1 sec bins | Bins with >0 counts | Bins with >2000 counts | High rate bins dominated by noise | Noise dominated (total time) | Noise dominated (detector-on time) | Marked lightcurve |
|---|---|---|---|---|---|---|---|
| A | 7498 | 6543 | 1602 | 1602 | 21.37% | 24.48% | 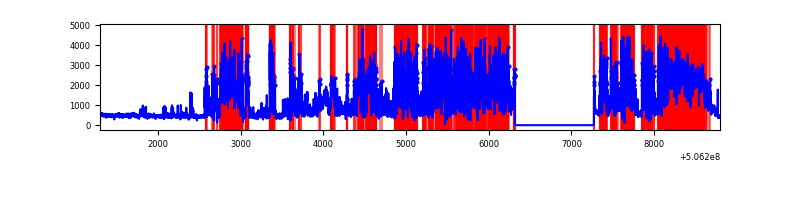 |
| B | 7499 | 6545 | 3929 | 3929 | 52.39% | 60.03% | 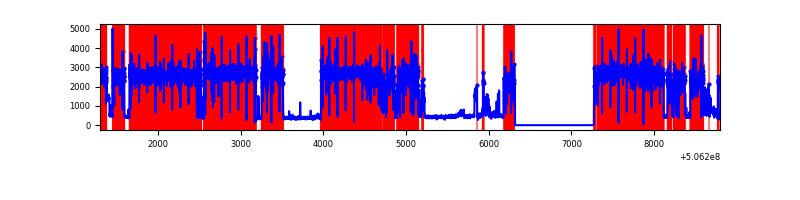 |
| C | 7499 | 6544 | 913 | 913 | 12.17% | 13.95% | 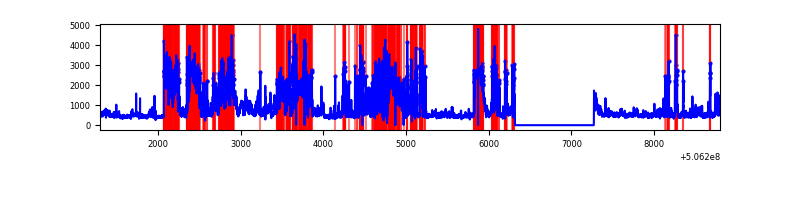 |
| D | 7499 | 6545 | 1111 | 1111 | 14.82% | 16.97% | 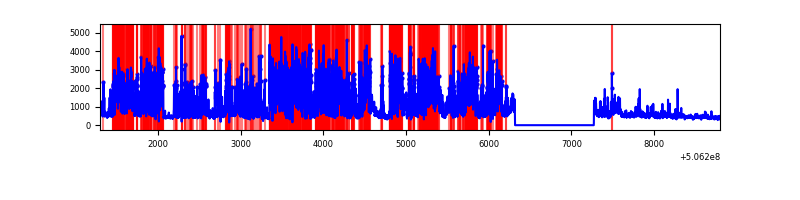 |
Top three noisy pixels from each quadrant. If the there are fewer than three noisy pixels in the level2.evt file, extra rows are filled as -1
| Pixel properties | Quadrant properties | ||||||
|---|---|---|---|---|---|---|---|
| Quadrant | DetID | PixID | Counts | Sigma | Mean | Median | Sigma |
| A | 15 | 32 | 4572154 | 31952.64 | 579 | 564 | 143.1 |
| A | 12 | 115 | 1130718 | 7899.09 | 579 | 564 | 143.1 |
| A | 4 | 249 | 194261 | 1353.82 | 579 | 564 | 143.1 |
| B | 4 | 206 | 10594213 | 113162.1 | 428 | 411 | 93.6 |
| B | 0 | 199 | 47949 | 507.8 | 428 | 411 | 93.6 |
| B | 12 | 111 | 11059 | 113.74 | 428 | 411 | 93.6 |
| C | 15 | 199 | 2830284 | 17641.46 | 585 | 580 | 160.4 |
| C | 9 | 38 | 855603 | 5330.54 | 585 | 580 | 160.4 |
| C | 13 | 3 | 183143 | 1138.17 | 585 | 580 | 160.4 |
| D | 11 | 129 | 4441962 | 25799.64 | 611 | 584 | 172.1 |
| D | 6 | 239 | 327129 | 1896.88 | 611 | 584 | 172.1 |
| D | 8 | 245 | 275257 | 1595.56 | 611 | 584 | 172.1 |
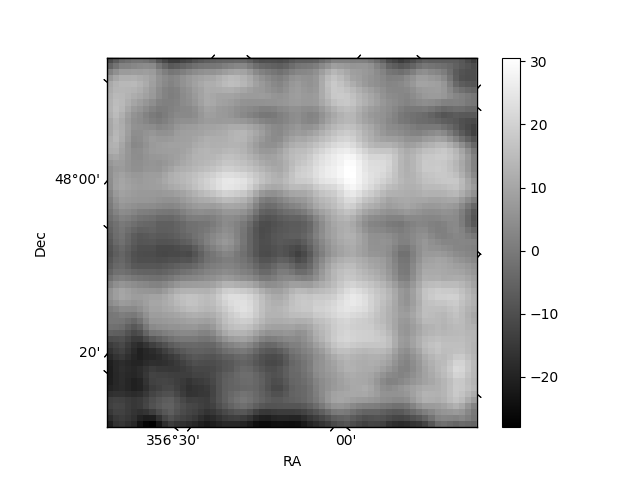
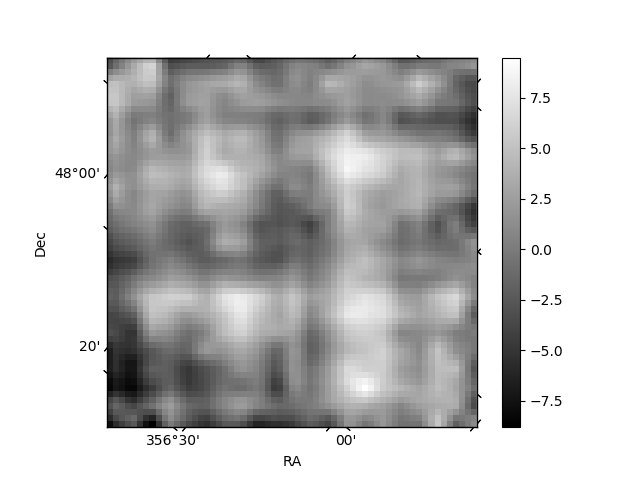
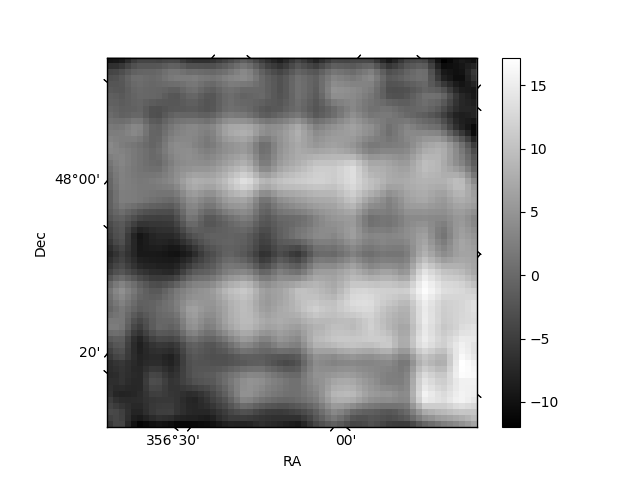
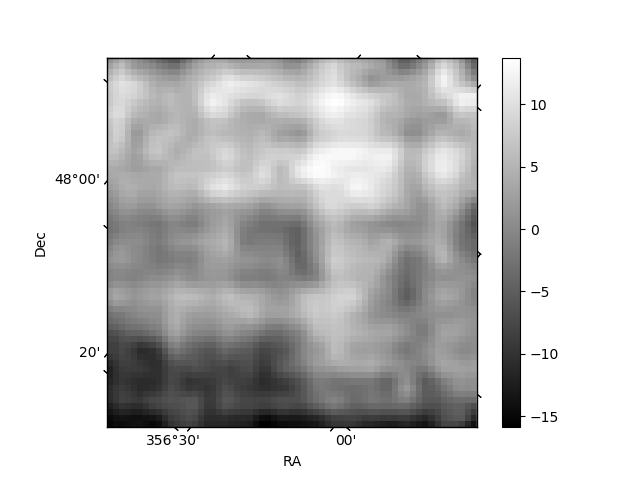
Histogram calculated using DETX and DETY for each event in the final _common_clean file
| Quadrant A | 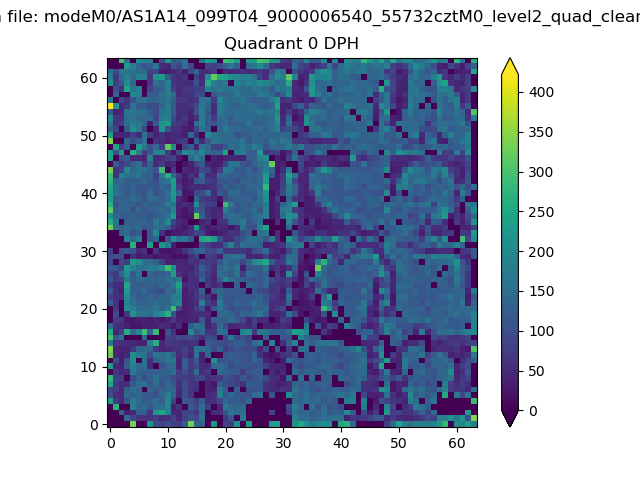 |
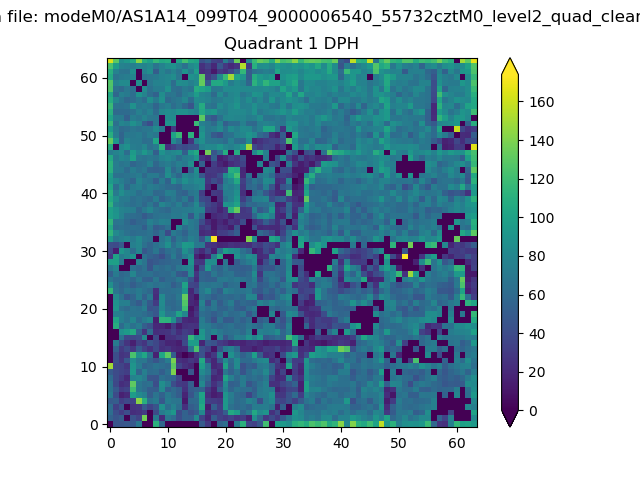 |
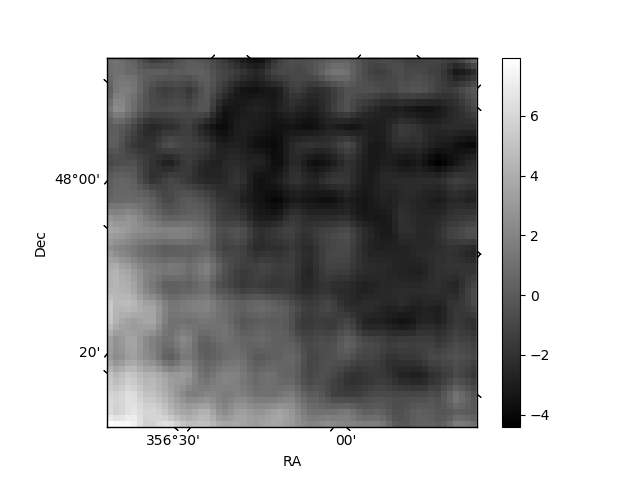
Quadrant B |
|---|---|---|---|
| Quadrant D | 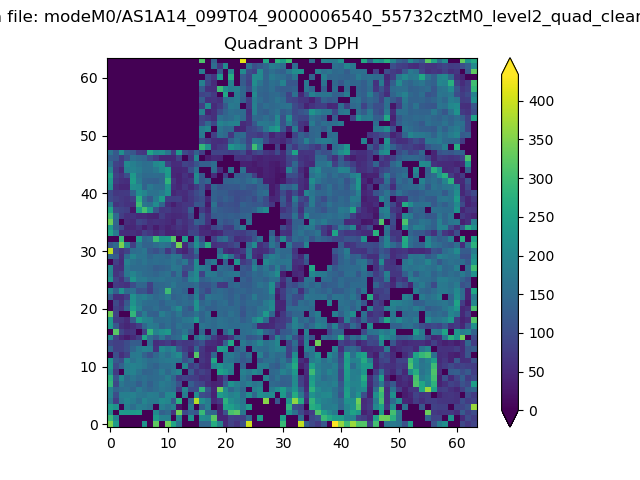 |
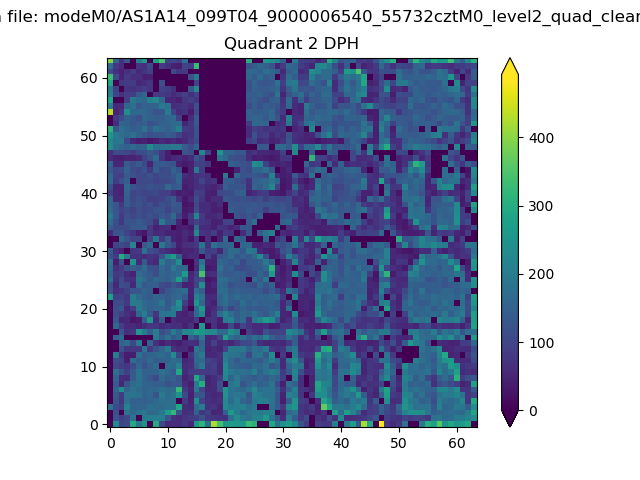 |
Quadrant C |
| Plot type | Count rate plots | Images |
|---|---|---|
| Comparison with Poisson distribution Blue bars denote a histogram of data divided into 1 sec bins. Red curve is a Poisson curve with rate = median count rate of data. |
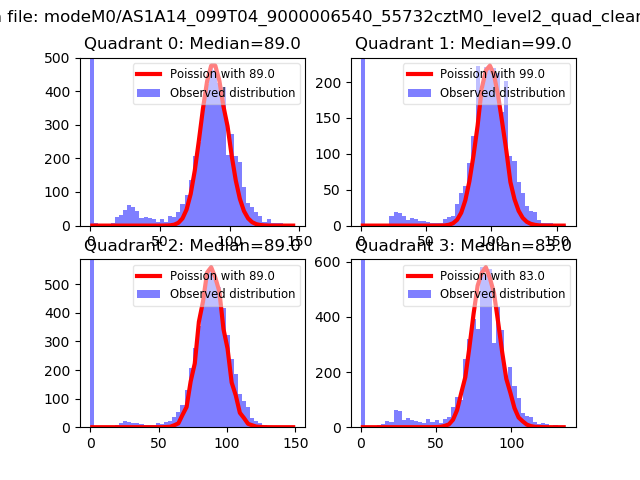 |
 |
| Quadrant-wise count rates Data is divided into 100 sec bins |
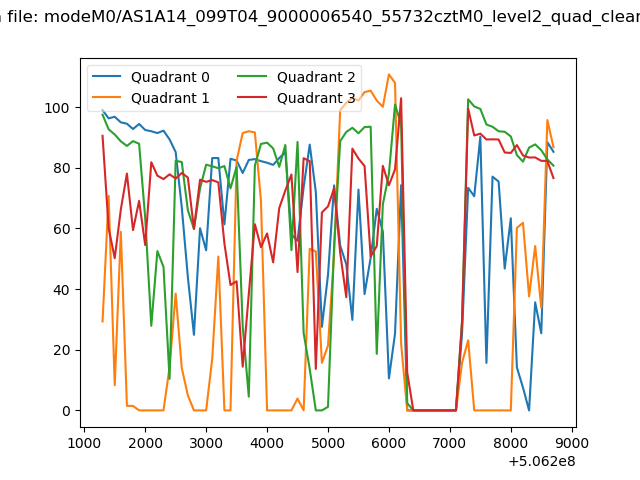 |
|
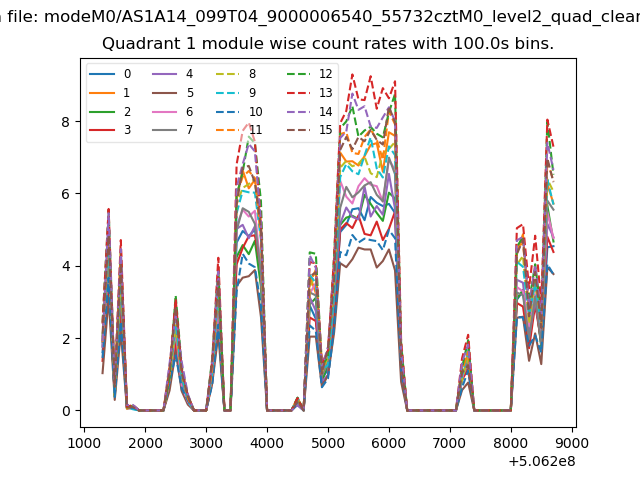
| Module-wise count rates for Quadrant A Data is divided into 100 sec bins |
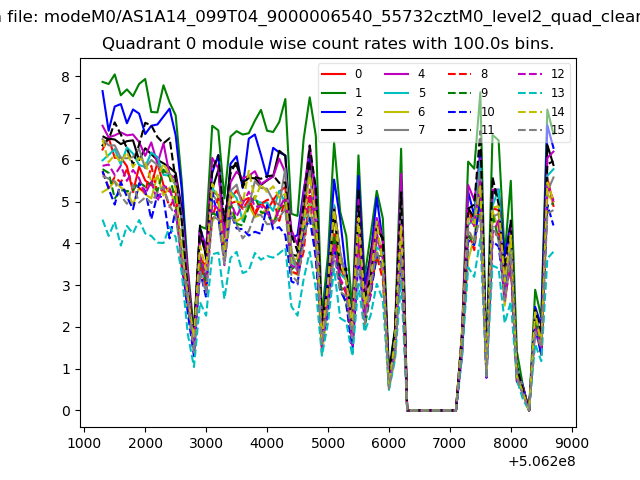 |
 |
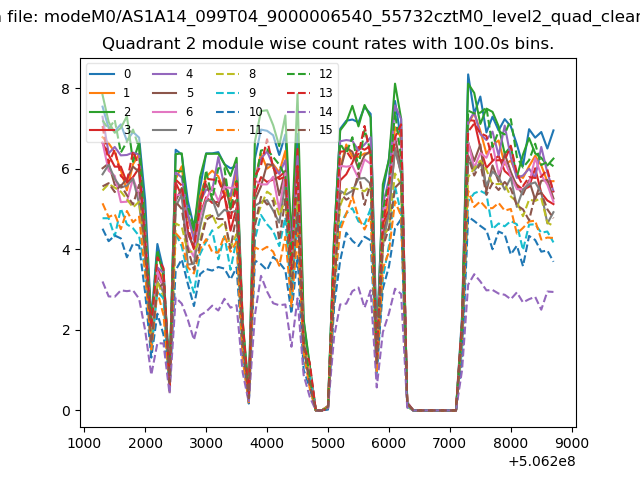
| Module-wise count rates for Quadrant B Data is divided into 100 sec bins |
 |
 |
| Module-wise count rates for Quadrant C Data is divided into 100 sec bins |
 |
 |
| Module-wise count rates for Quadrant D Data is divided into 100 sec bins |
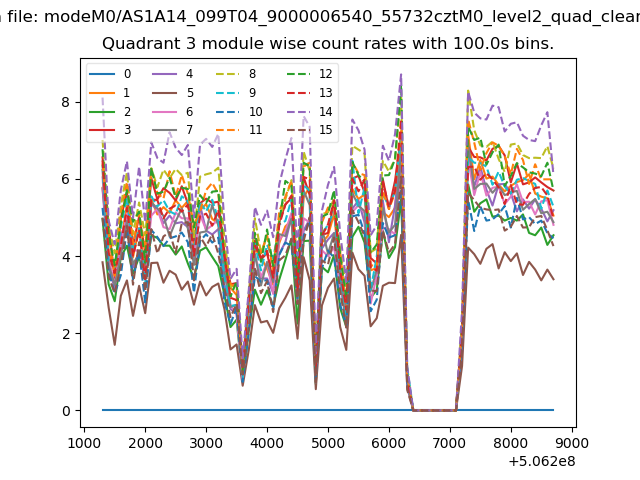 |
 |
| Parameter | Plot |
|---|---|
| CZT HV Monitor | 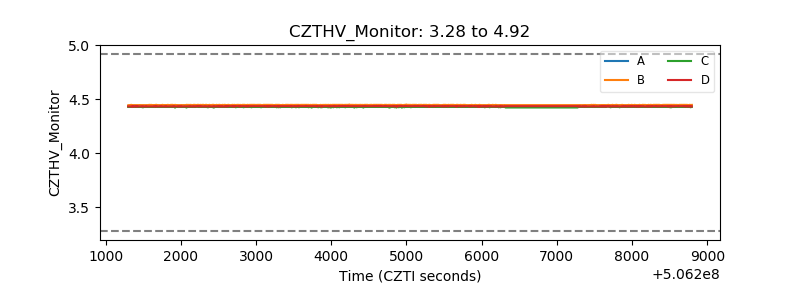 |
| D_VDD | 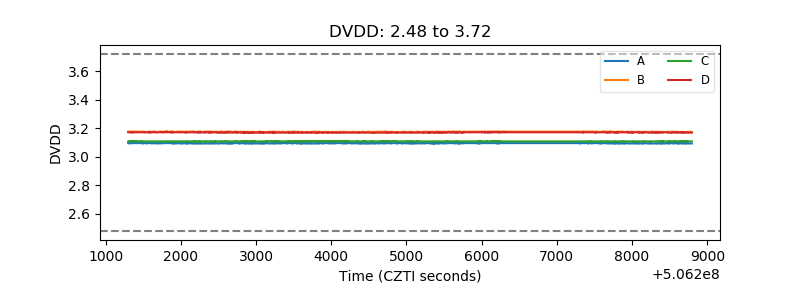 |
| Temperature 1 | 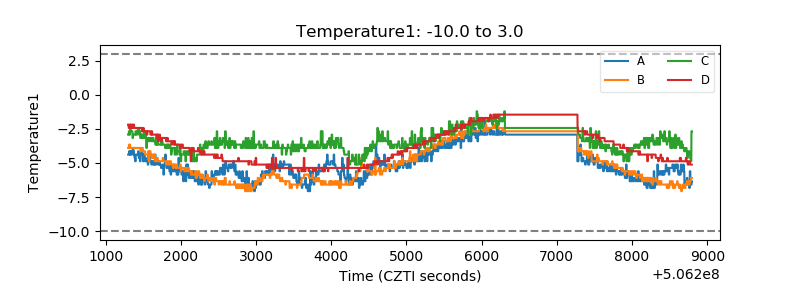 |
| Veto HV Monitor | 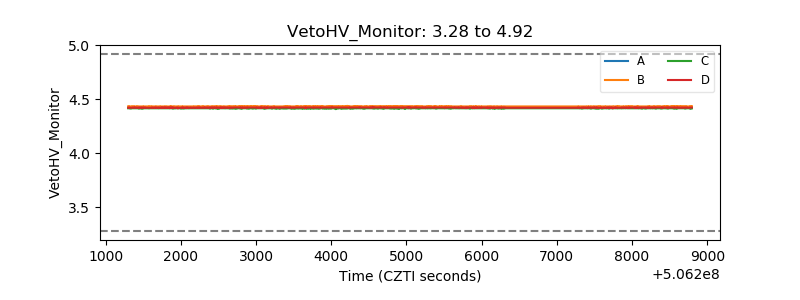 |
| Veto LLD | 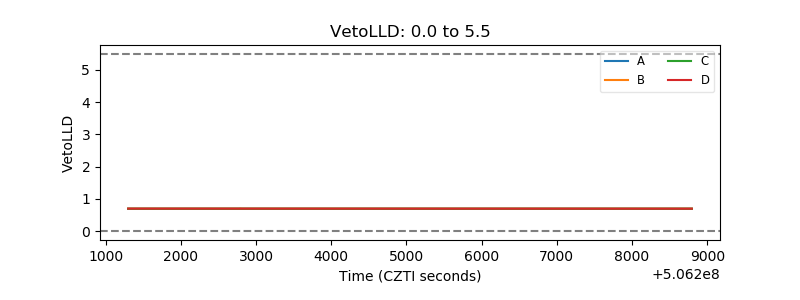 |
| Alpha Counter | 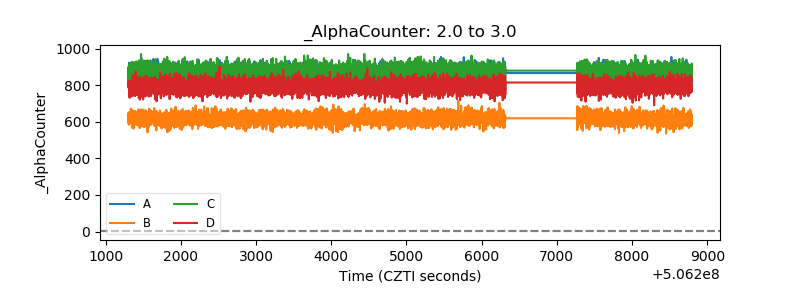 |
| _CPM_Rate | 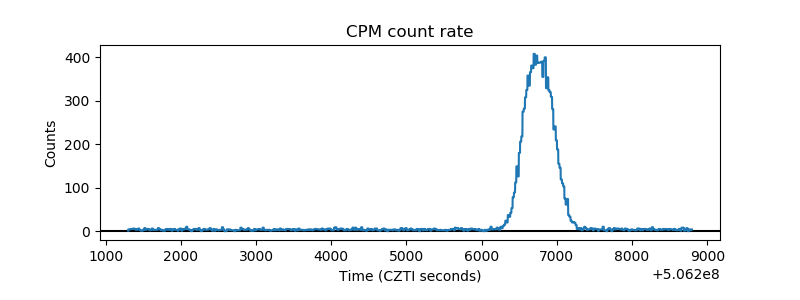 |
| CZT Counter | 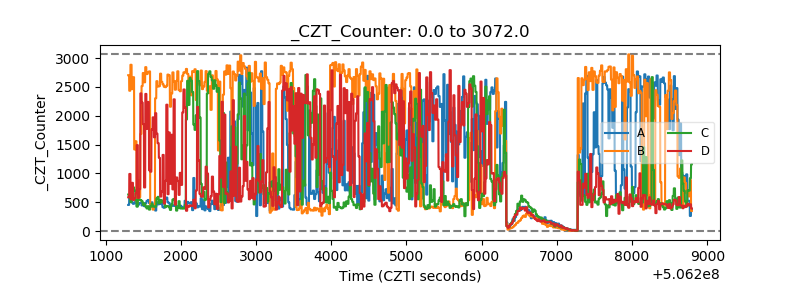 |
| +2.5 Volts monitor |  |
| +5 Volts monitor |  |
| _ROLL_ROT | 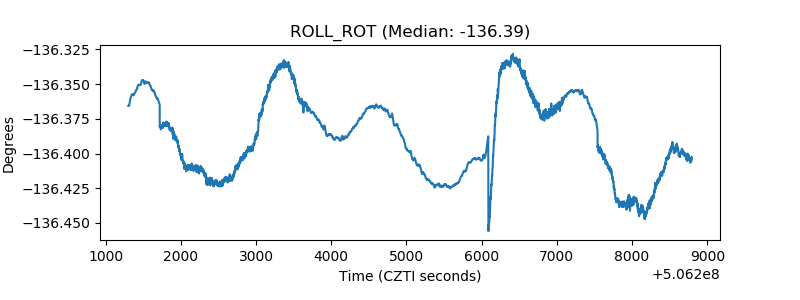 |
| _Roll_DEC | 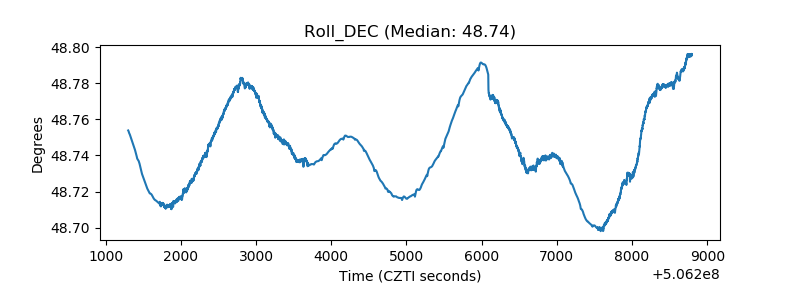 |
| _Roll_RA | 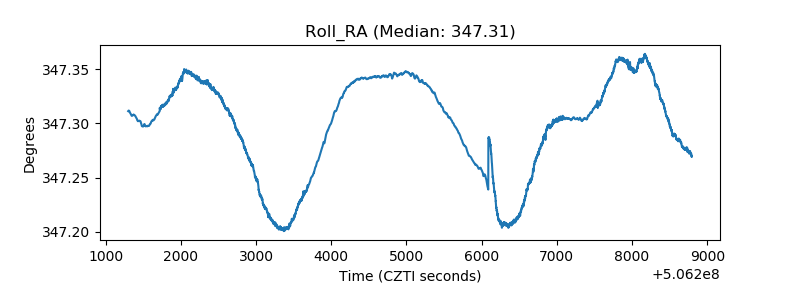 |
| Veto Counter | 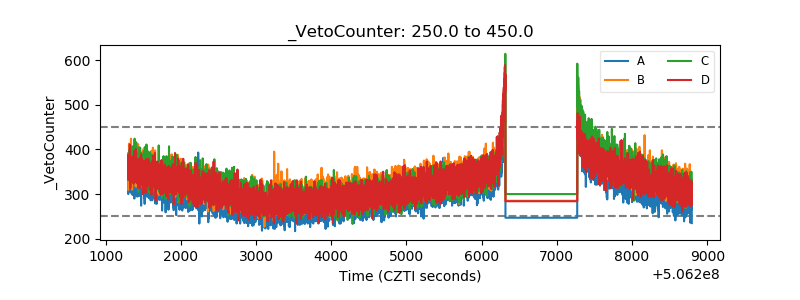 |