| Param | Original file | Final file |
|---|---|---|
| Filename | modeM0/AS1A14_099T04_9000006540_55734cztM0_level2.fits | modeM0/AS1A14_099T04_9000006540_55734cztM0_level2_quad_clean.evt |
| Size (bytes) | 944,133,120 | 76,772,160 |
| Size | 900.4 MB | 73.2 MB |
| Events in quadrant A | 11,344,645 | 350,272 |
| Events in quadrant B | 9,198,109 | 449,263 |
| Events in quadrant C | 6,018,443 | 577,124 |
| Events in quadrant D | 7,866,044 | 477,506 |
| Mode M0 | |||
|---|---|---|---|
| Quadrant | BADHDUFLAG | Total packets | Discarded packets |
| A | 0 | 38402 | 8 |
| B | 0 | 32047 | 1 |
| C | 0 | 22513 | 1 |
| D | 0 | 28029 | 1 |
| Mode M9 | |||
|---|---|---|---|
| Quadrant | BADHDUFLAG | Total packets | Discarded packets |
| A | 0 | 13 | 0 |
| B | 0 | 13 | 0 |
| C | 0 | 14 | 0 |
| D | 0 | 14 | 0 |
| Mode SS | |||
|---|---|---|---|
| Quadrant | BADHDUFLAG | Total packets | Discarded packets |
| A | 0 | 136 | 0 |
| B | 0 | 136 | 0 |
| C | 0 | 136 | 0 |
| D | 0 | 136 | 0 |
| Quadrant | Total seconds | Saturated seconds | Saturation percentage |
|---|---|---|---|
| A | 6747 | 3269 | 48.451163% |
| B | 6747 | 2538 | 37.616719% |
| C | 6747 | 620 | 9.189269% |
| D | 6747 | 1426 | 21.135319% |
Noise dominated data is calculated using 1-second bins in cleaned event files. If a bin has >2000 counts, and if more than 50% of those come from <1% of pixels, then it is considered to be noise-dominated and hence unusable.
| Quadrant | # 1 sec bins | Bins with >0 counts | Bins with >2000 counts | High rate bins dominated by noise | Noise dominated (total time) | Noise dominated (detector-on time) | Marked lightcurve |
|---|---|---|---|---|---|---|---|
| A | 7807 | 6748 | 2934 | 2934 | 37.58% | 43.48% | 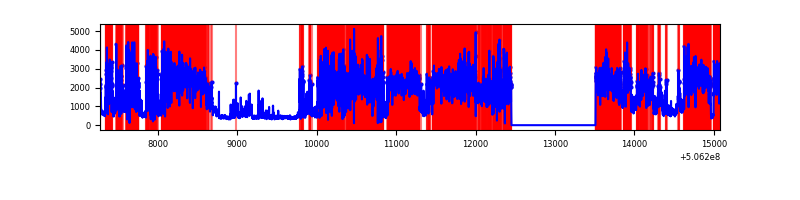 |
| B | 7807 | 6748 | 2221 | 2221 | 28.45% | 32.91% | 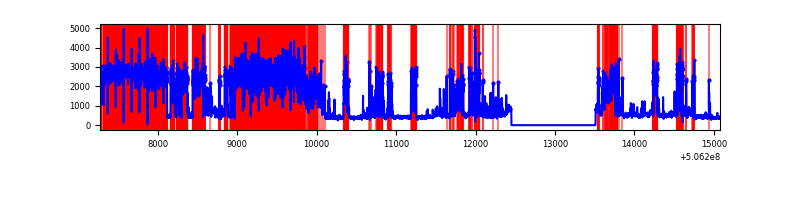 |
| C | 7807 | 6748 | 535 | 535 | 6.85% | 7.93% | 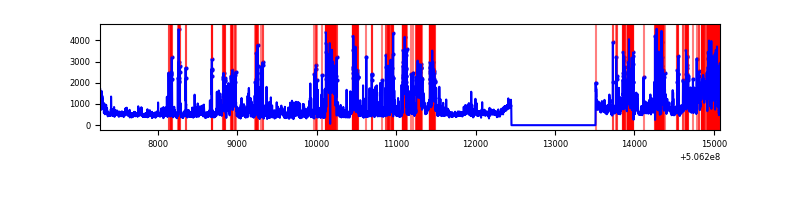 |
| D | 7807 | 6748 | 1124 | 1124 | 14.40% | 16.66% | 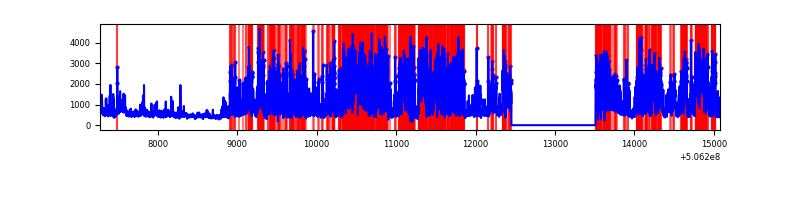 |
Top three noisy pixels from each quadrant. If the there are fewer than three noisy pixels in the level2.evt file, extra rows are filled as -1
| Pixel properties | Quadrant properties | ||||||
|---|---|---|---|---|---|---|---|
| Quadrant | DetID | PixID | Counts | Sigma | Mean | Median | Sigma |
| A | 12 | 115 | 4902568 | 34385.09 | 576 | 562 | 142.6 |
| A | 15 | 32 | 3765795 | 26411.2 | 576 | 562 | 142.6 |
| A | 8 | 192 | 132705 | 926.92 | 576 | 562 | 142.6 |
| B | 4 | 206 | 6811311 | 54599.61 | 578 | 559 | 124.7 |
| B | 0 | 199 | 61395 | 487.7 | 578 | 559 | 124.7 |
| B | 12 | 111 | 15246 | 117.74 | 578 | 559 | 124.7 |
| C | 15 | 199 | 1714709 | 9245.89 | 678 | 670 | 185.4 |
| C | 9 | 38 | 930868 | 5017.69 | 678 | 670 | 185.4 |
| C | 3 | 248 | 252069 | 1356.1 | 678 | 670 | 185.4 |
| D | 11 | 129 | 4398405 | 24480.0 | 633 | 605 | 179.6 |
| D | 6 | 239 | 790151 | 4394.94 | 633 | 605 | 179.6 |
| D | 10 | 181 | 76483 | 422.37 | 633 | 605 | 179.6 |
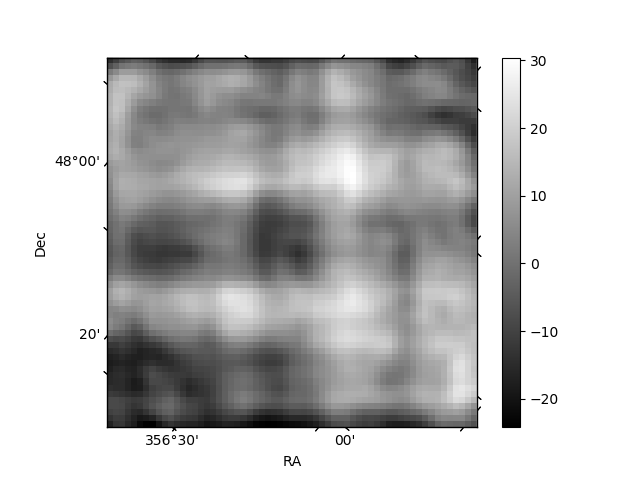
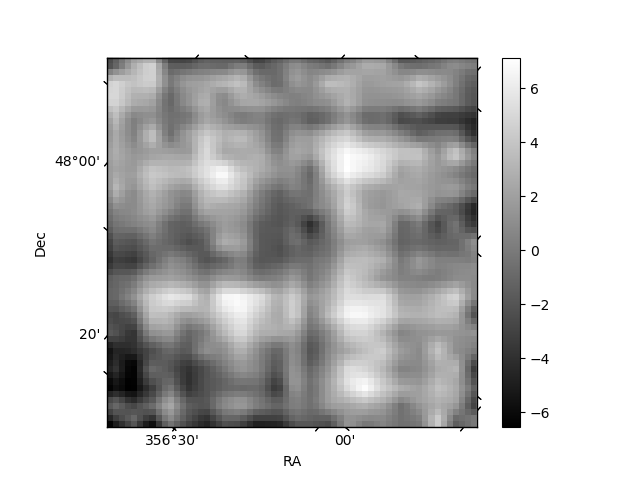
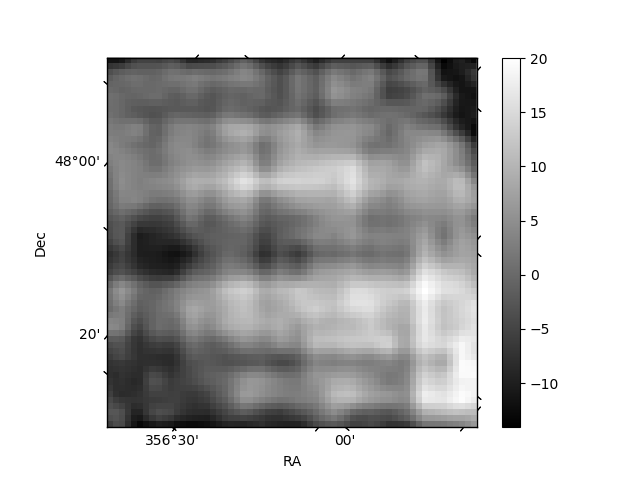
Histogram calculated using DETX and DETY for each event in the final _common_clean file
| Quadrant A | 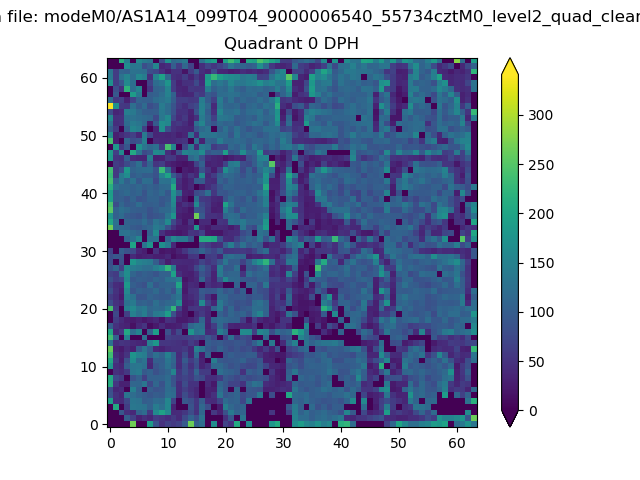 |
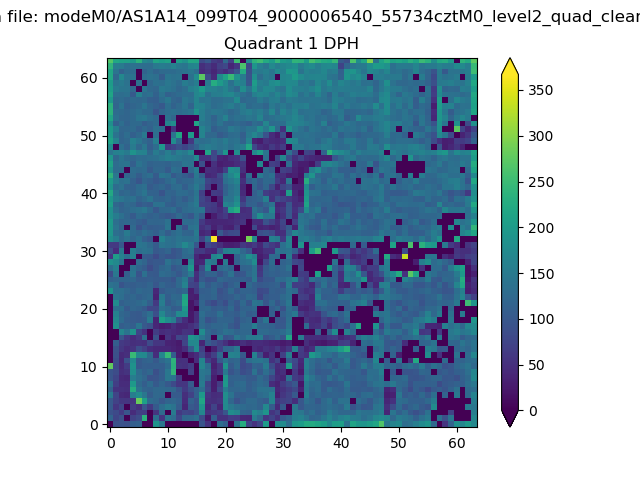 |
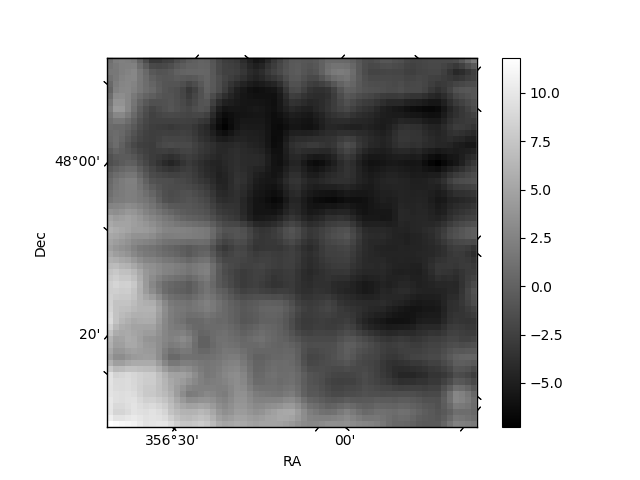
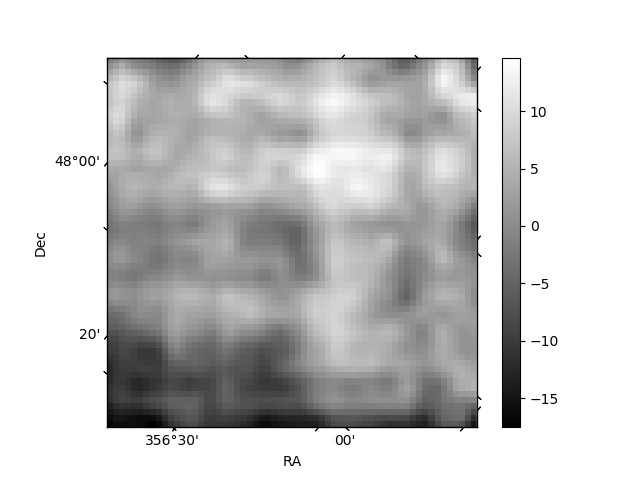
Quadrant B |
|---|---|---|---|
| Quadrant D | 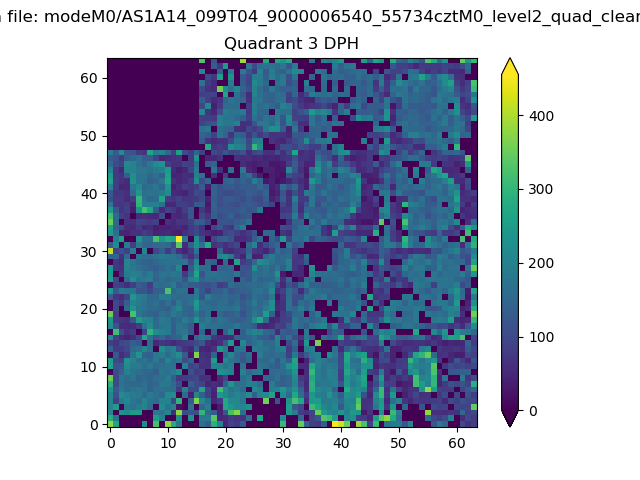 |
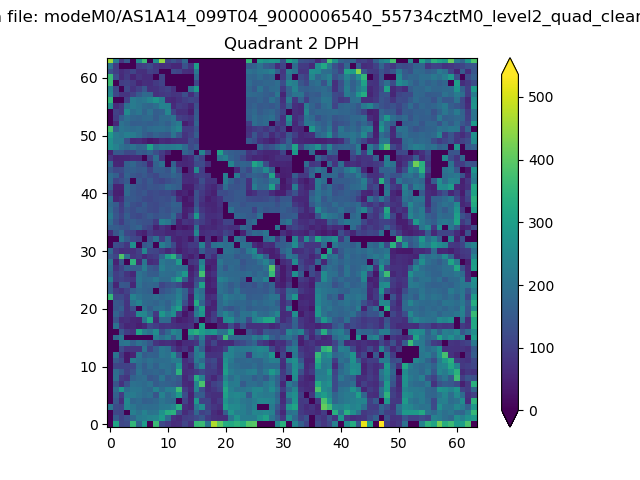 |
Quadrant C |
| Plot type | Count rate plots | Images |
|---|---|---|
| Comparison with Poisson distribution Blue bars denote a histogram of data divided into 1 sec bins. Red curve is a Poisson curve with rate = median count rate of data. |
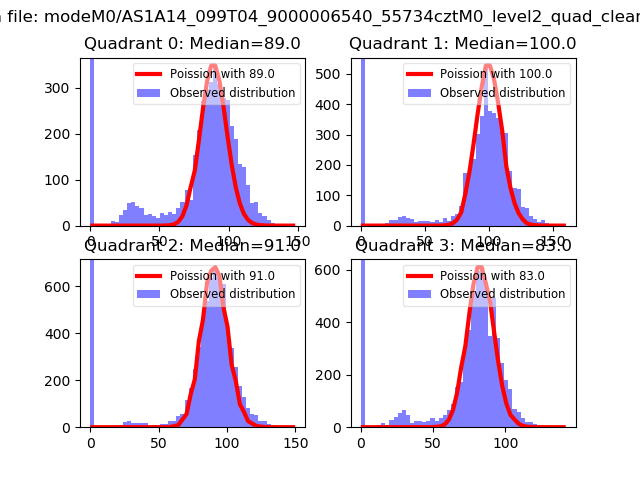 |
 |
| Quadrant-wise count rates Data is divided into 100 sec bins |
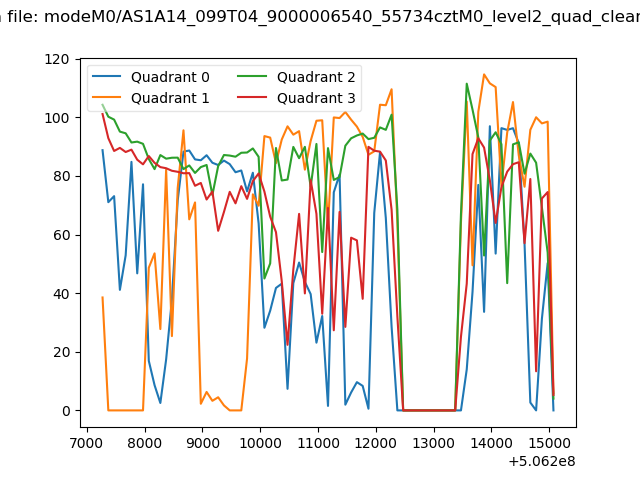 |
|
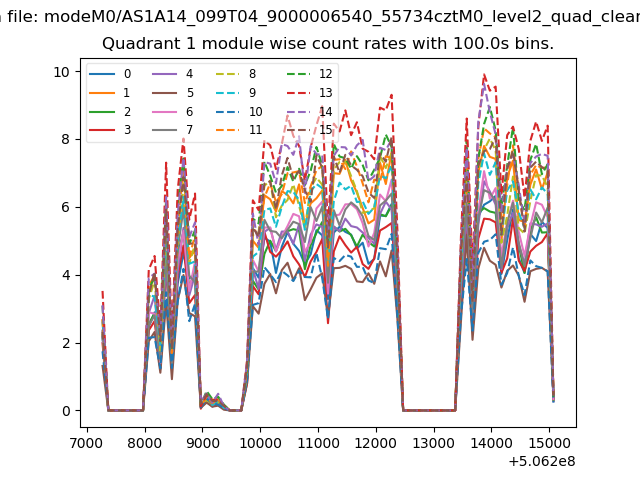
| Module-wise count rates for Quadrant A Data is divided into 100 sec bins |
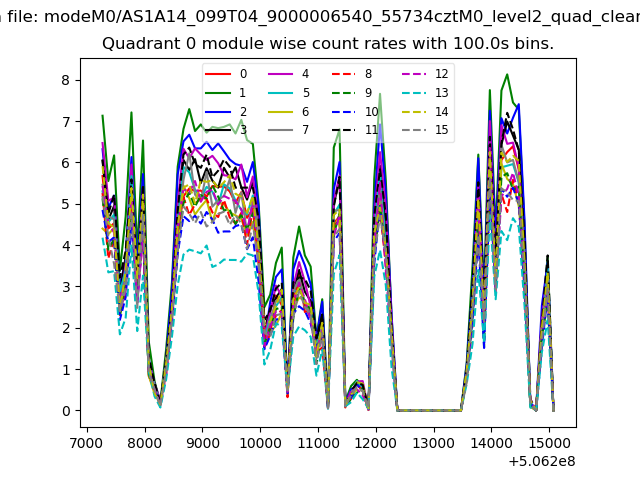 |
 |
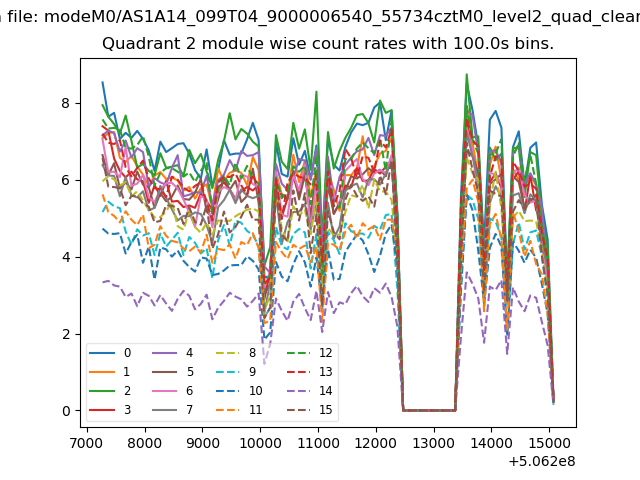
| Module-wise count rates for Quadrant B Data is divided into 100 sec bins |
 |
 |
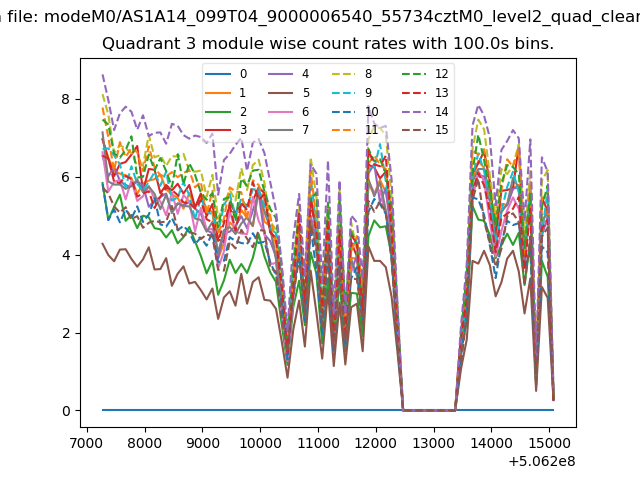
| Module-wise count rates for Quadrant C Data is divided into 100 sec bins |
 |
 |
| Module-wise count rates for Quadrant D Data is divided into 100 sec bins |
 |
 |
| Parameter | Plot |
|---|---|
| CZT HV Monitor | 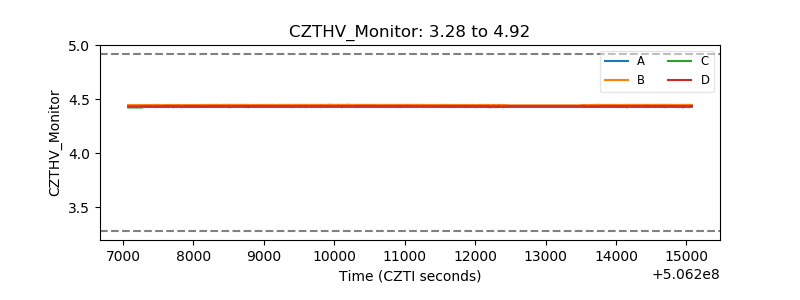 |
| D_VDD | 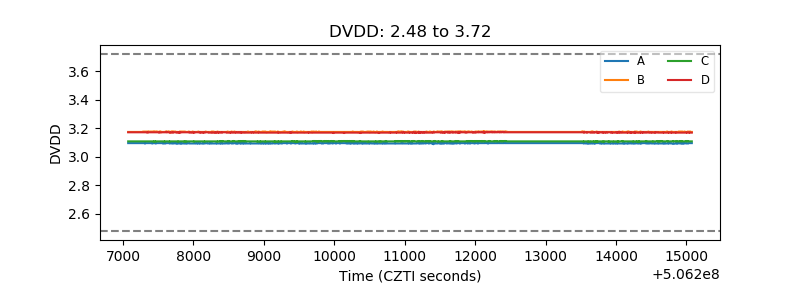 |
| Temperature 1 | 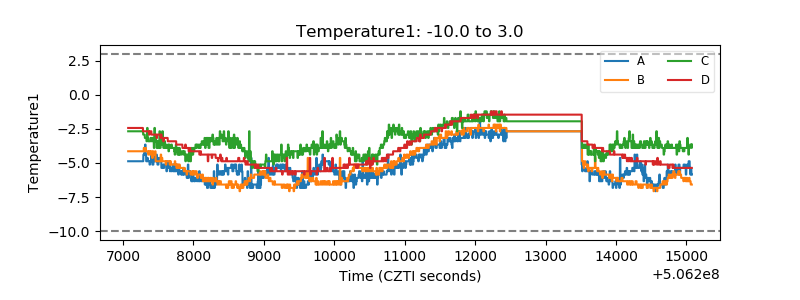 |
| Veto HV Monitor |  |
| Veto LLD | 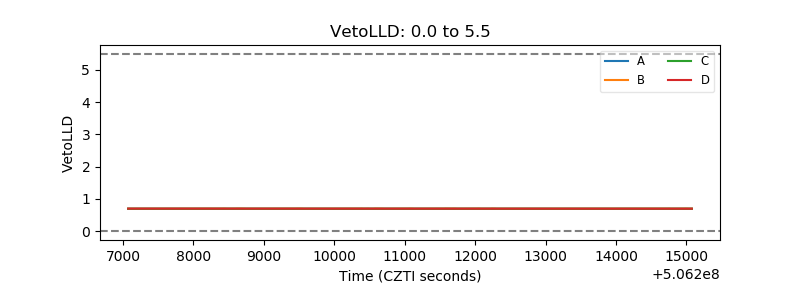 |
| Alpha Counter | 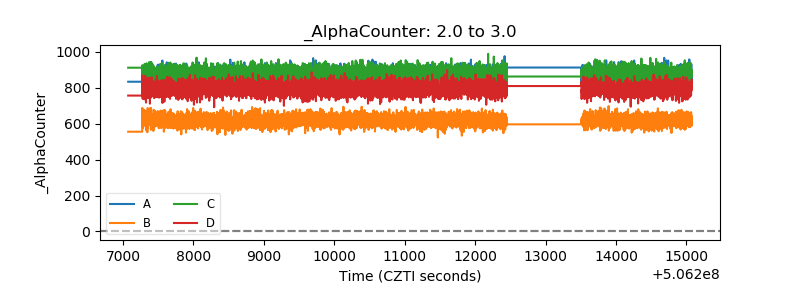 |
| _CPM_Rate | 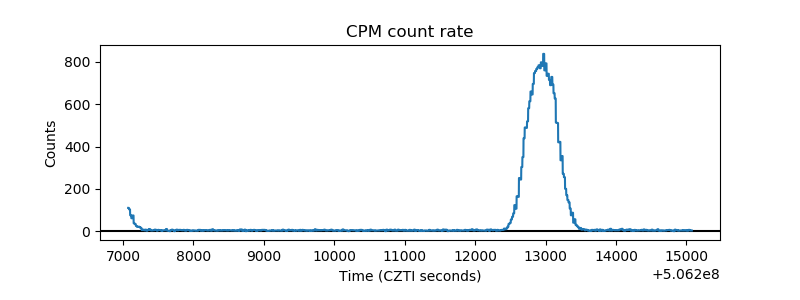 |
| CZT Counter | 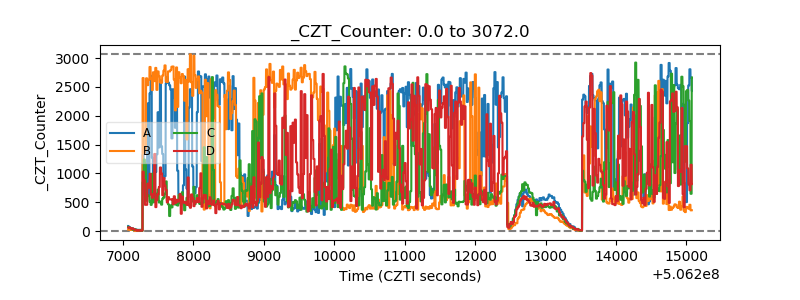 |
| +2.5 Volts monitor |  |
| +5 Volts monitor |  |
| _ROLL_ROT | 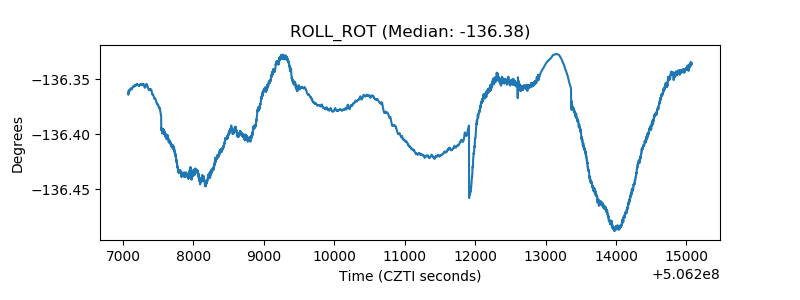 |
| _Roll_DEC | 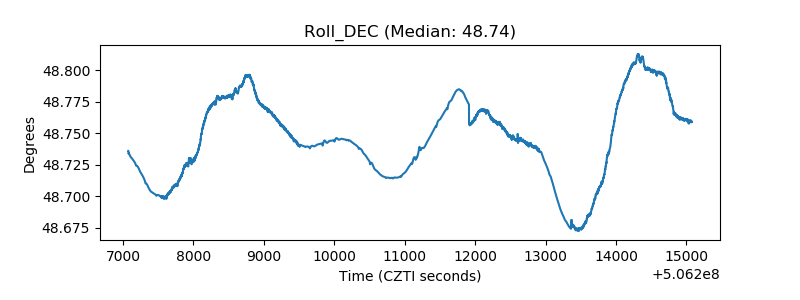 |
| _Roll_RA | 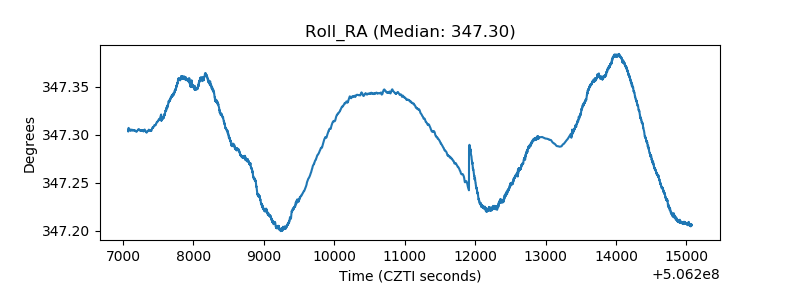 |
| Veto Counter | 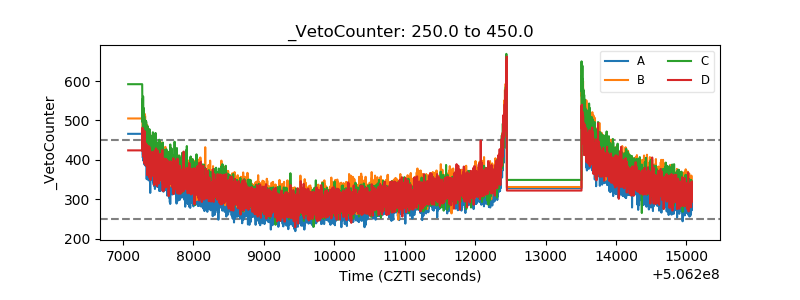 |