| Param | Original file | Final file |
|---|---|---|
| Filename | modeM0/AS1A14_099T04_9000006540_55735cztM0_level2.fits | modeM0/AS1A14_099T04_9000006540_55735cztM0_level2_quad_clean.evt |
| Size (bytes) | 724,613,760 | 84,781,440 |
| Size | 691.0 MB | 80.9 MB |
| Events in quadrant A | 7,463,571 | 506,680 |
| Events in quadrant B | 5,975,666 | 573,097 |
| Events in quadrant C | 6,823,157 | 518,619 |
| Events in quadrant D | 6,062,032 | 518,893 |
| Mode M0 | |||
|---|---|---|---|
| Quadrant | BADHDUFLAG | Total packets | Discarded packets |
| A | 0 | 26451 | 1 |
| B | 0 | 22229 | 1 |
| C | 0 | 24656 | 1 |
| D | 0 | 22560 | 1 |
| Mode M9 | |||
|---|---|---|---|
| Quadrant | BADHDUFLAG | Total packets | Discarded packets |
| A | 0 | 11 | 0 |
| B | 0 | 11 | 0 |
| C | 0 | 11 | 0 |
| D | 0 | 11 | 0 |
| Mode SS | |||
|---|---|---|---|
| Quadrant | BADHDUFLAG | Total packets | Discarded packets |
| A | 0 | 132 | 0 |
| B | 0 | 132 | 0 |
| C | 0 | 132 | 0 |
| D | 0 | 132 | 0 |
| Quadrant | Total seconds | Saturated seconds | Saturation percentage |
|---|---|---|---|
| A | 6442 | 1439 | 22.337783% |
| B | 6442 | 1118 | 17.354859% |
| C | 6442 | 1113 | 17.277243% |
| D | 6443 | 731 | 11.345646% |
Noise dominated data is calculated using 1-second bins in cleaned event files. If a bin has >2000 counts, and if more than 50% of those come from <1% of pixels, then it is considered to be noise-dominated and hence unusable.
| Quadrant | # 1 sec bins | Bins with >0 counts | Bins with >2000 counts | High rate bins dominated by noise | Noise dominated (total time) | Noise dominated (detector-on time) | Marked lightcurve |
|---|---|---|---|---|---|---|---|
| A | 7587 | 6443 | 1387 | 1387 | 18.28% | 21.53% | 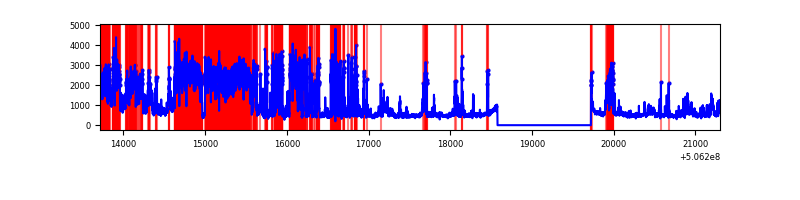 |
| B | 7587 | 6443 | 971 | 971 | 12.80% | 15.07% | 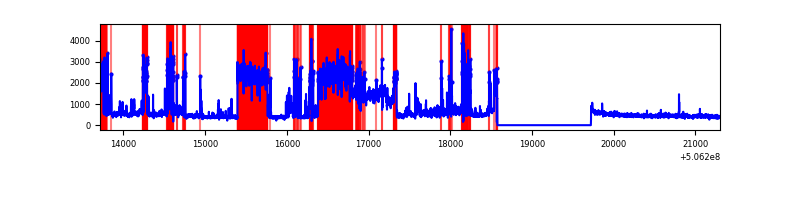 |
| C | 7587 | 6443 | 973 | 973 | 12.82% | 15.10% | 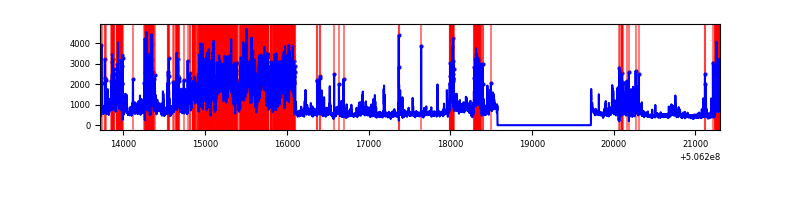 |
| D | 7588 | 6444 | 623 | 623 | 8.21% | 9.67% | 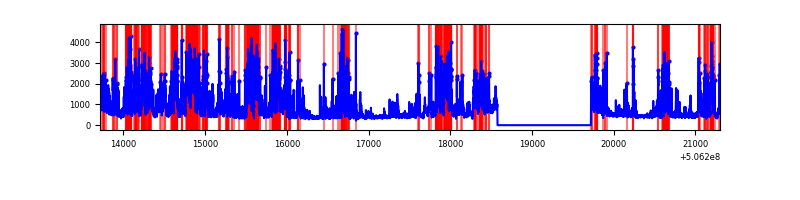 |
Top three noisy pixels from each quadrant. If the there are fewer than three noisy pixels in the level2.evt file, extra rows are filled as -1
| Pixel properties | Quadrant properties | ||||||
|---|---|---|---|---|---|---|---|
| Quadrant | DetID | PixID | Counts | Sigma | Mean | Median | Sigma |
| A | 12 | 115 | 2926367 | 18575.06 | 636 | 618 | 157.5 |
| A | 7 | 64 | 734307 | 4658.06 | 636 | 618 | 157.5 |
| A | 15 | 32 | 708718 | 4495.6 | 636 | 618 | 157.5 |
| B | 4 | 206 | 3264017 | 23748.16 | 644 | 622 | 137.4 |
| B | 0 | 182 | 75400 | 544.17 | 644 | 622 | 137.4 |
| B | 0 | 199 | 49271 | 354.03 | 644 | 622 | 137.4 |
| C | 15 | 199 | 2975727 | 17085.86 | 633 | 627 | 174.1 |
| C | 9 | 38 | 1015124 | 5826.21 | 633 | 627 | 174.1 |
| C | 14 | 96 | 143072 | 818.06 | 633 | 627 | 174.1 |
| D | 11 | 129 | 2772913 | 15100.48 | 640 | 609 | 183.6 |
| D | 6 | 239 | 583803 | 3176.6 | 640 | 609 | 183.6 |
| D | 10 | 181 | 63280 | 341.36 | 640 | 609 | 183.6 |
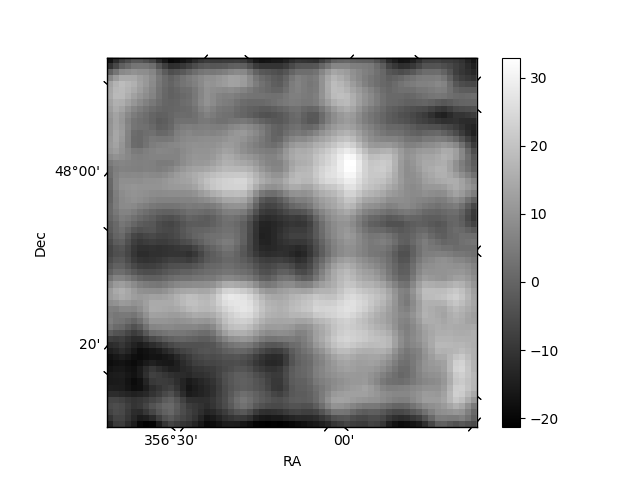
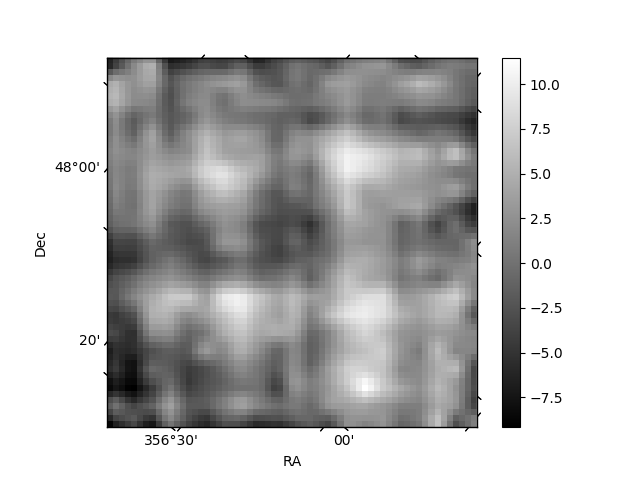
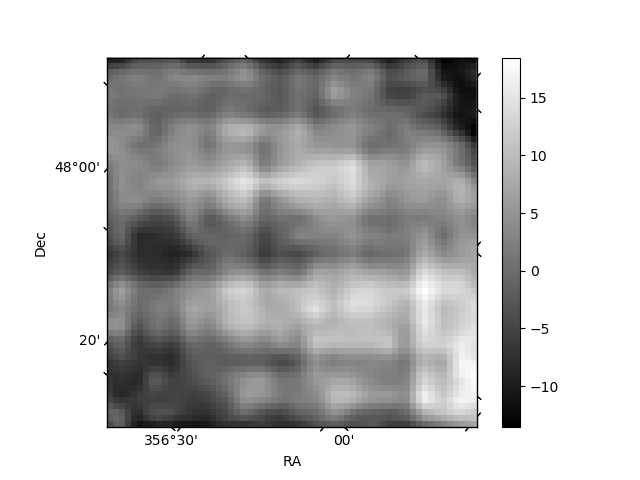
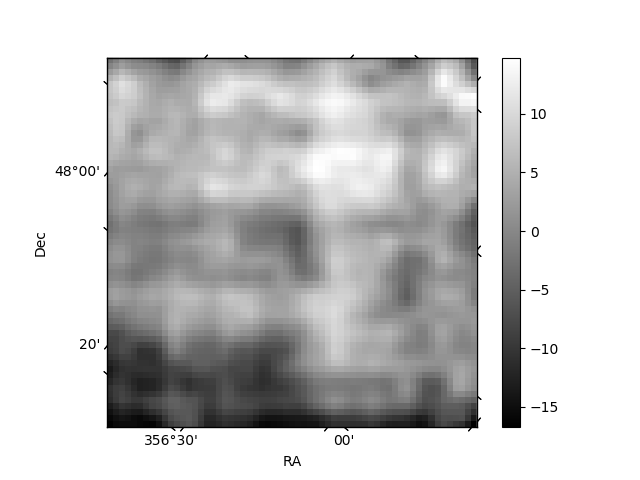
Histogram calculated using DETX and DETY for each event in the final _common_clean file
| Quadrant A | 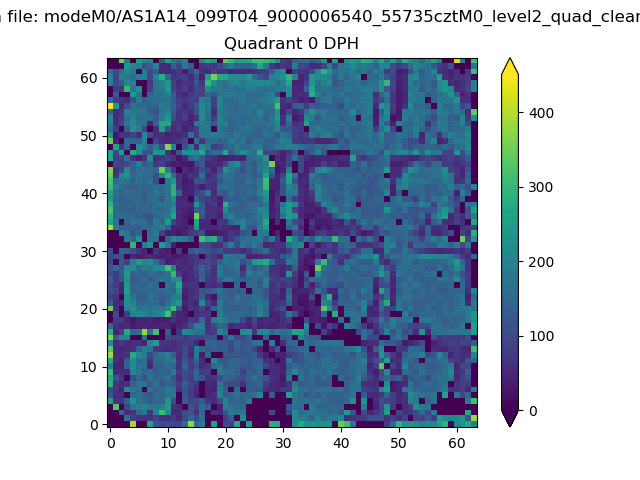 |
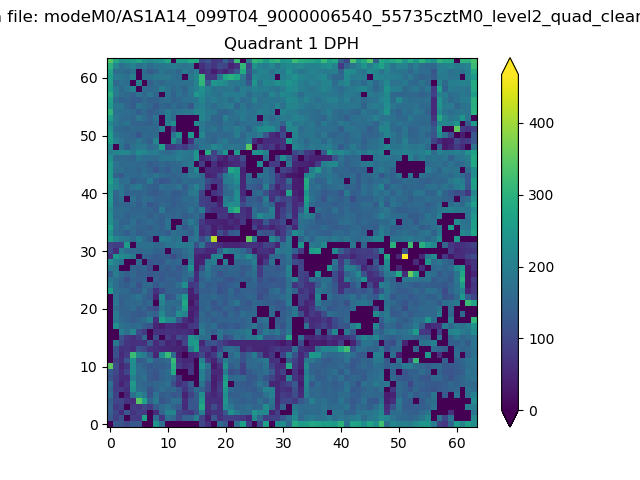 |
Quadrant B |
|---|---|---|---|
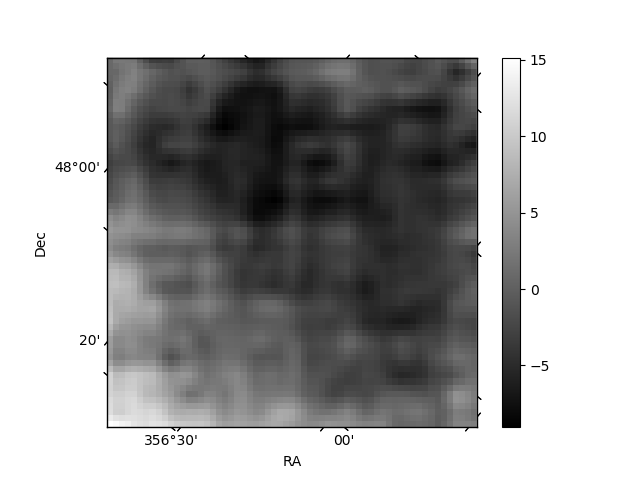
| Quadrant D | 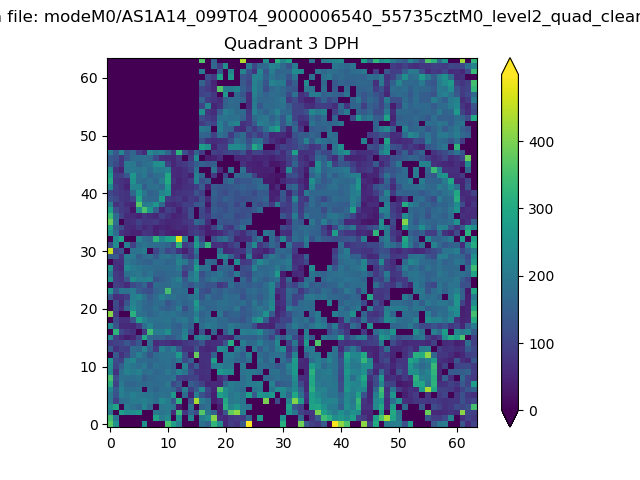 |
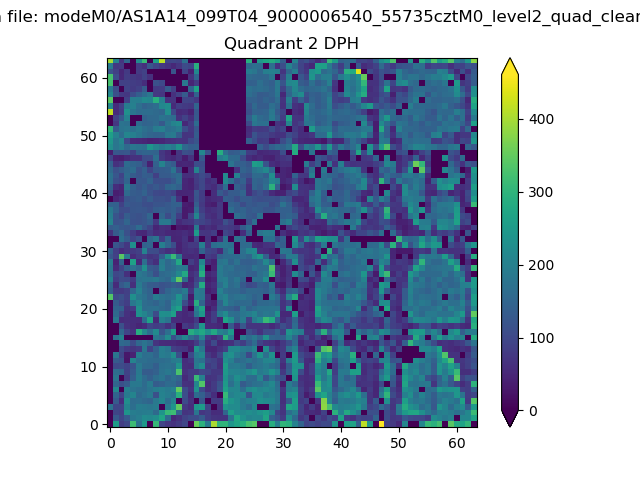 |
Quadrant C |
| Plot type | Count rate plots | Images |
|---|---|---|
| Comparison with Poisson distribution Blue bars denote a histogram of data divided into 1 sec bins. Red curve is a Poisson curve with rate = median count rate of data. |
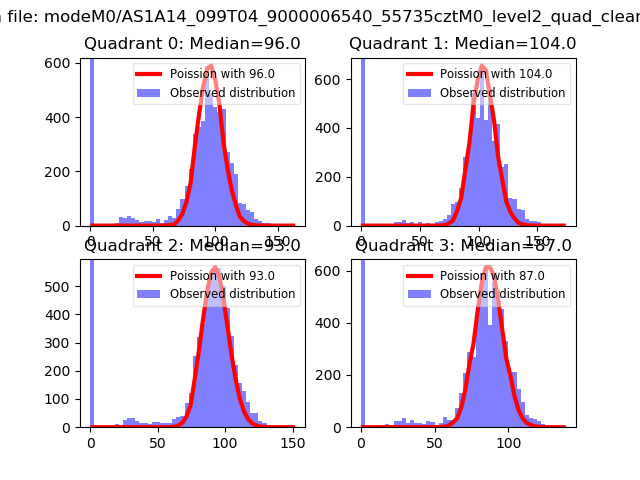 |
 |
| Quadrant-wise count rates Data is divided into 100 sec bins |
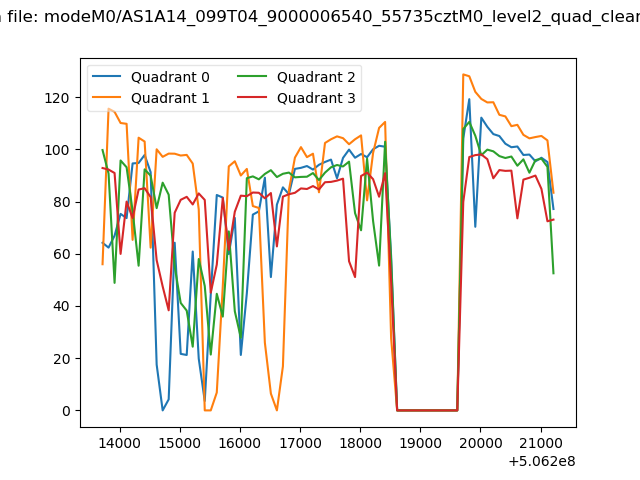 |
|
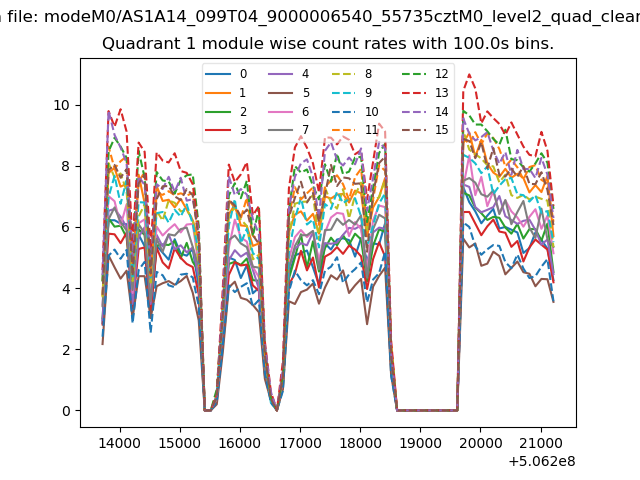
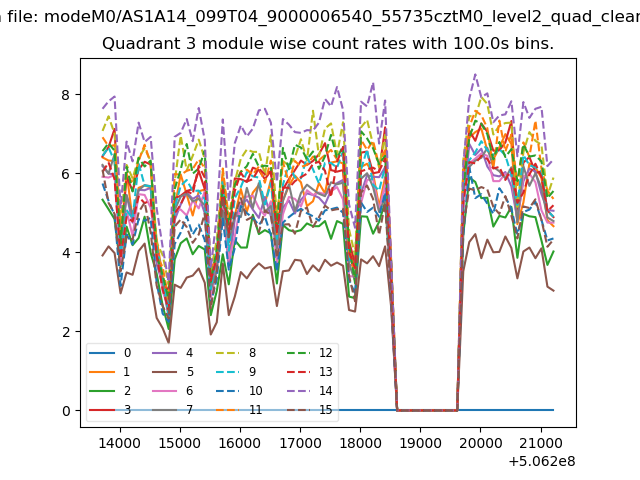
| Module-wise count rates for Quadrant A Data is divided into 100 sec bins |
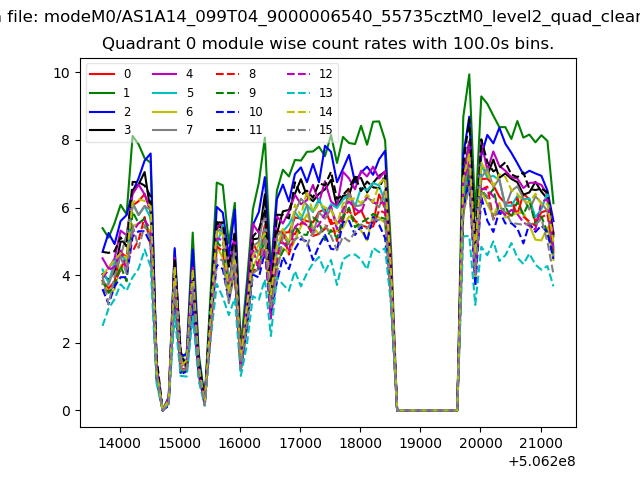 |
 |
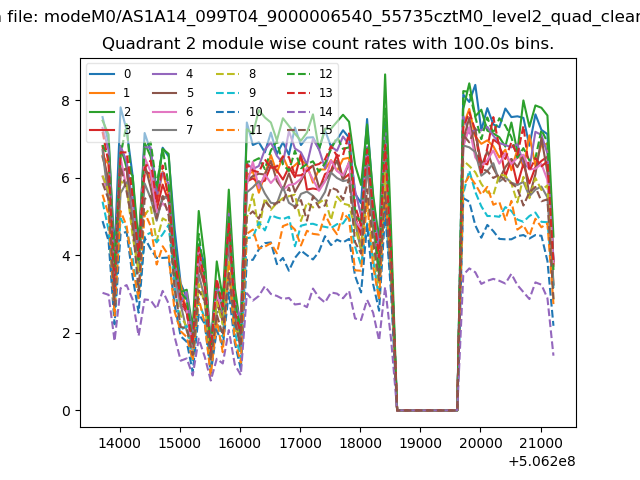
| Module-wise count rates for Quadrant B Data is divided into 100 sec bins |
 |
 |
| Module-wise count rates for Quadrant C Data is divided into 100 sec bins |
 |
 |
| Module-wise count rates for Quadrant D Data is divided into 100 sec bins |
 |
 |
| Parameter | Plot |
|---|---|
| CZT HV Monitor | 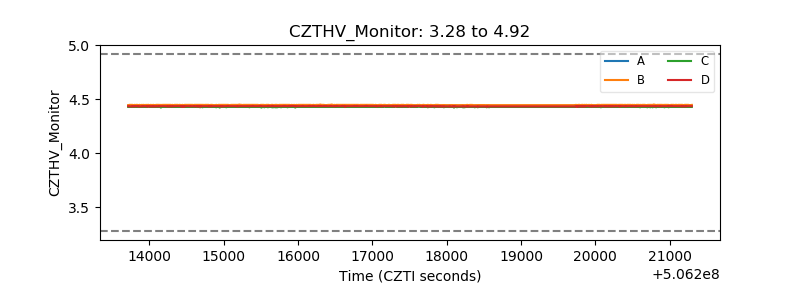 |
| D_VDD | 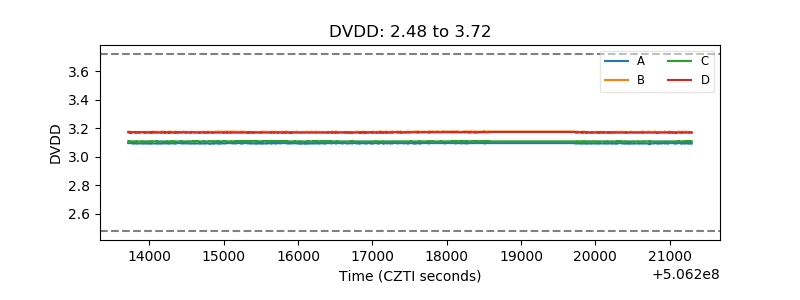 |
| Temperature 1 | 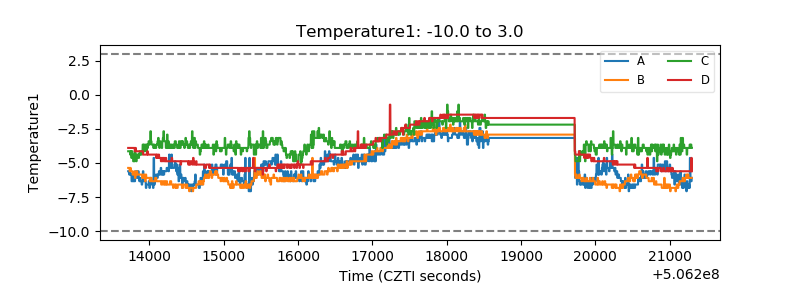 |
| Veto HV Monitor | 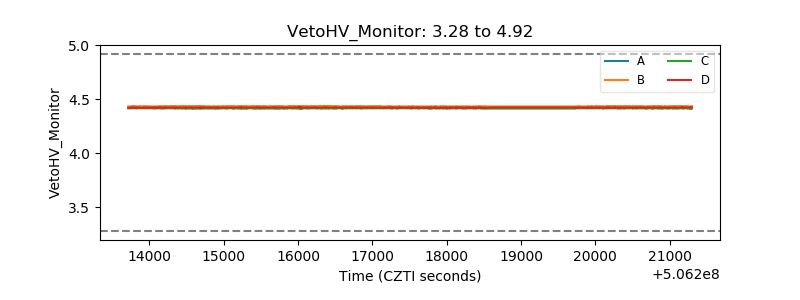 |
| Veto LLD | 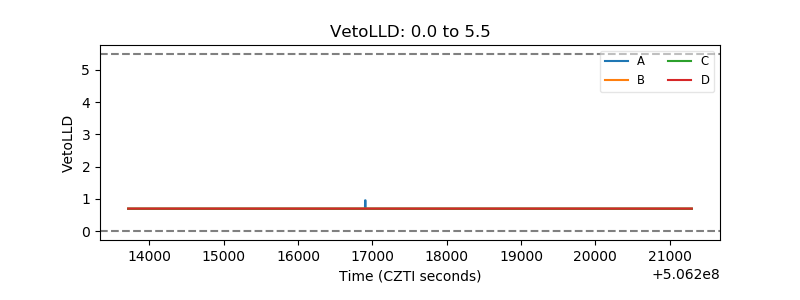 |
| Alpha Counter | 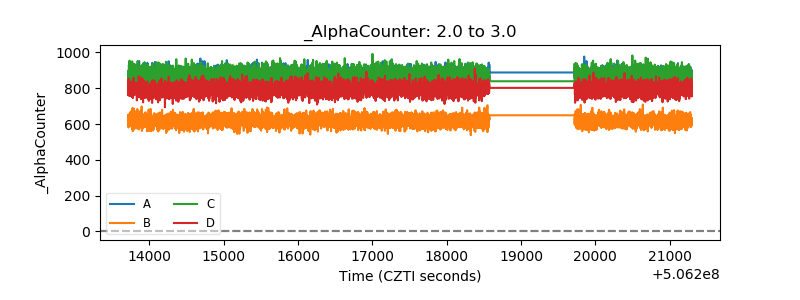 |
| _CPM_Rate | 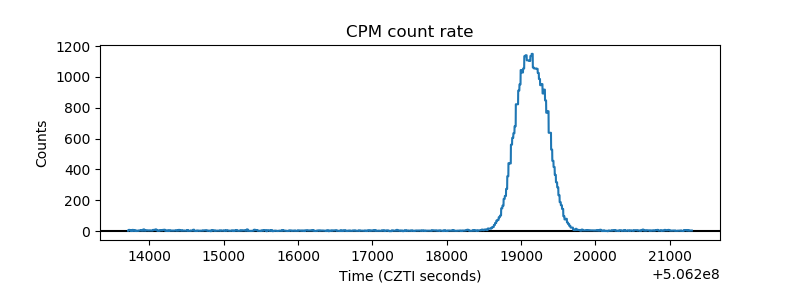 |
| CZT Counter | 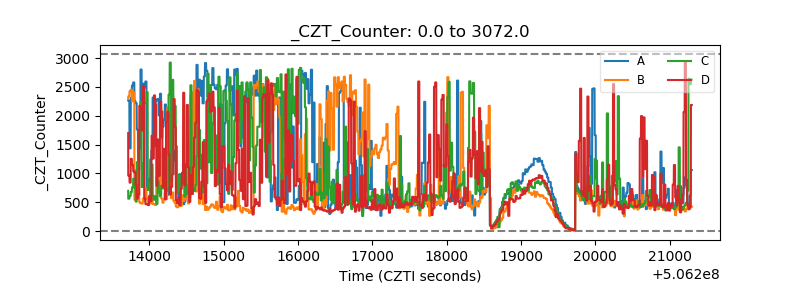 |
| +2.5 Volts monitor |  |
| +5 Volts monitor |  |
| _ROLL_ROT | 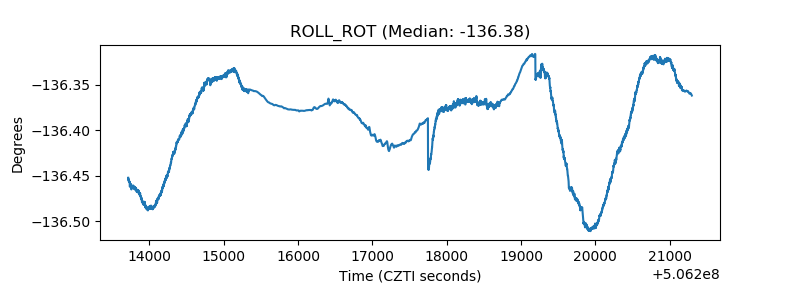 |
| _Roll_DEC | 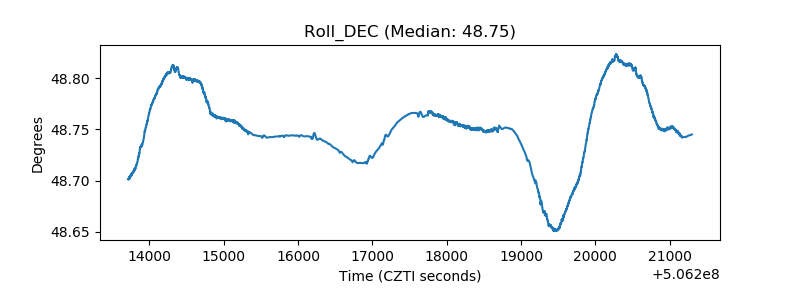 |
| _Roll_RA | 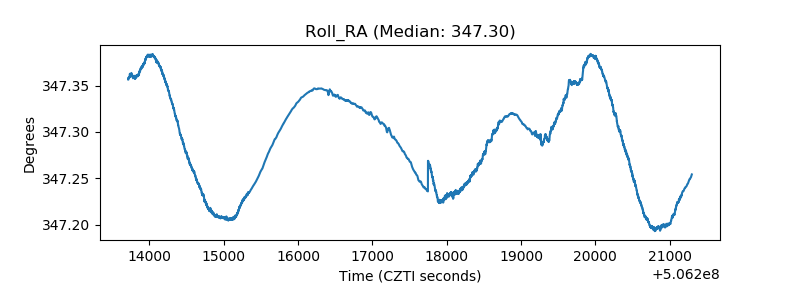 |
| Veto Counter | 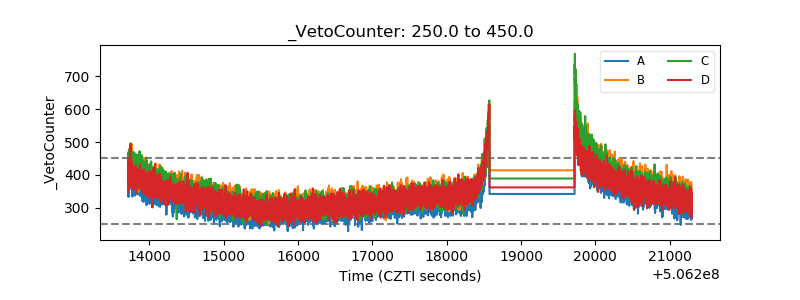 |