| Param | Original file | Final file |
|---|---|---|
| Filename | modeM0/AS1A14_099T04_9000006540_55738cztM0_level2.fits | modeM0/AS1A14_099T04_9000006540_55738cztM0_level2_quad_clean.evt |
| Size (bytes) | 665,700,480 | 88,672,320 |
| Size | 634.9 MB | 84.6 MB |
| Events in quadrant A | 10,218,249 | 422,175 |
| Events in quadrant B | 3,469,634 | 683,270 |
| Events in quadrant C | 4,773,512 | 618,414 |
| Events in quadrant D | 5,671,975 | 503,340 |
| Mode M0 | |||
|---|---|---|---|
| Quadrant | BADHDUFLAG | Total packets | Discarded packets |
| A | 0 | 34954 | 2 |
| B | 0 | 15233 | 2 |
| C | 0 | 18741 | 2 |
| D | 0 | 21741 | 2 |
| Mode M9 | |||
|---|---|---|---|
| Quadrant | BADHDUFLAG | Total packets | Discarded packets |
| A | 0 | 14 | 0 |
| B | 0 | 14 | 0 |
| C | 0 | 15 | 0 |
| D | 0 | 15 | 0 |
| Mode SS | |||
|---|---|---|---|
| Quadrant | BADHDUFLAG | Total packets | Discarded packets |
| A | 0 | 134 | 0 |
| B | 0 | 134 | 0 |
| C | 0 | 134 | 0 |
| D | 0 | 134 | 0 |
| Quadrant | Total seconds | Saturated seconds | Saturation percentage |
|---|---|---|---|
| A | 6559 | 2549 | 38.862631% |
| B | 6559 | 142 | 2.164964% |
| C | 6559 | 128 | 1.951517% |
| D | 6559 | 952 | 14.514408% |
Noise dominated data is calculated using 1-second bins in cleaned event files. If a bin has >2000 counts, and if more than 50% of those come from <1% of pixels, then it is considered to be noise-dominated and hence unusable.
| Quadrant | # 1 sec bins | Bins with >0 counts | Bins with >2000 counts | High rate bins dominated by noise | Noise dominated (total time) | Noise dominated (detector-on time) | Marked lightcurve |
|---|---|---|---|---|---|---|---|
| A | 7649 | 6561 | 2029 | 2029 | 26.53% | 30.93% | 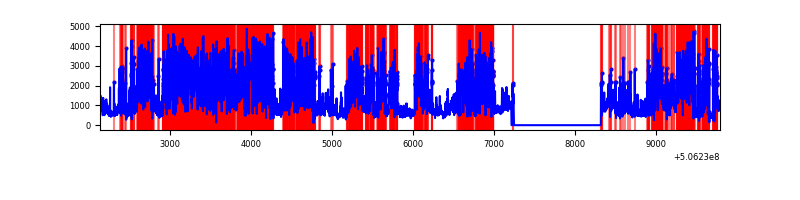 |
| B | 7649 | 6561 | 57 | 57 | 0.75% | 0.87% | 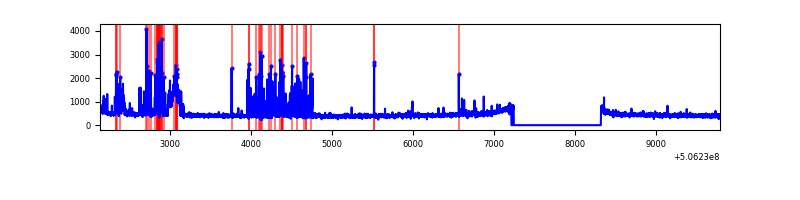 |
| C | 7649 | 6561 | 73 | 73 | 0.95% | 1.11% | 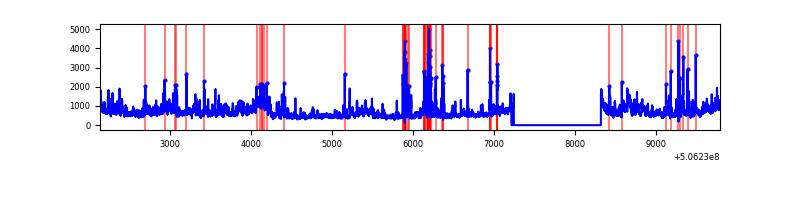 |
| D | 7649 | 6561 | 768 | 768 | 10.04% | 11.71% | 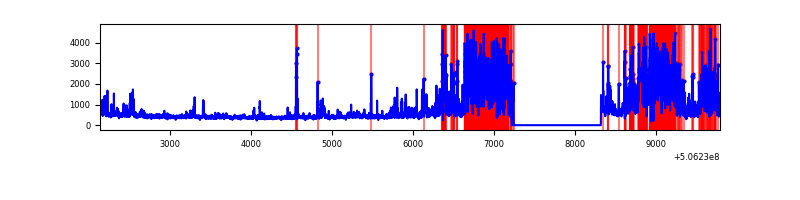 |
Top three noisy pixels from each quadrant. If the there are fewer than three noisy pixels in the level2.evt file, extra rows are filled as -1
| Pixel properties | Quadrant properties | ||||||
|---|---|---|---|---|---|---|---|
| Quadrant | DetID | PixID | Counts | Sigma | Mean | Median | Sigma |
| A | 15 | 32 | 7195753 | 49668.32 | 589 | 575 | 144.9 |
| A | 12 | 115 | 262640 | 1809.03 | 589 | 575 | 144.9 |
| A | 8 | 192 | 138066 | 949.1 | 589 | 575 | 144.9 |
| B | 5 | 172 | 437557 | 2919.66 | 701 | 677 | 149.6 |
| B | 4 | 206 | 216873 | 1444.83 | 701 | 677 | 149.6 |
| B | 10 | 247 | 18164 | 116.87 | 701 | 677 | 149.6 |
| C | 9 | 38 | 1356305 | 7129.32 | 688 | 681 | 190.1 |
| C | 13 | 3 | 239374 | 1255.3 | 688 | 681 | 190.1 |
| C | 14 | 96 | 222043 | 1164.16 | 688 | 681 | 190.1 |
| D | 11 | 129 | 3112477 | 17475.24 | 629 | 600 | 178.1 |
| D | 5 | 173 | 39686 | 219.49 | 629 | 600 | 178.1 |
| D | 2 | 31 | 33032 | 182.13 | 629 | 600 | 178.1 |
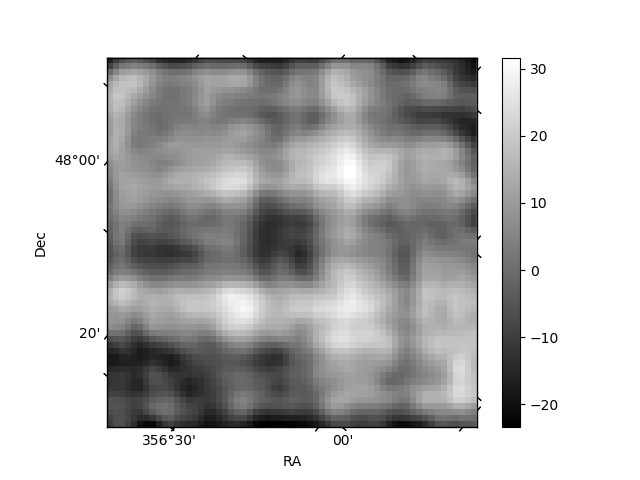
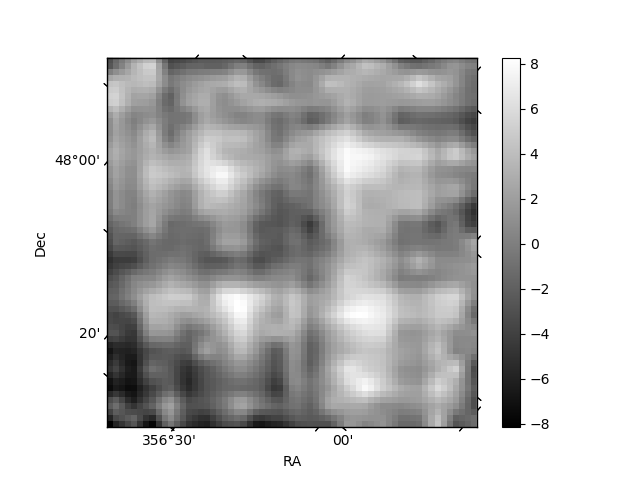
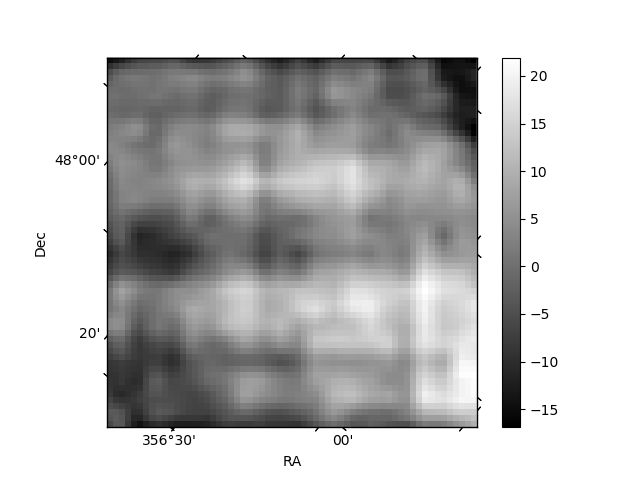
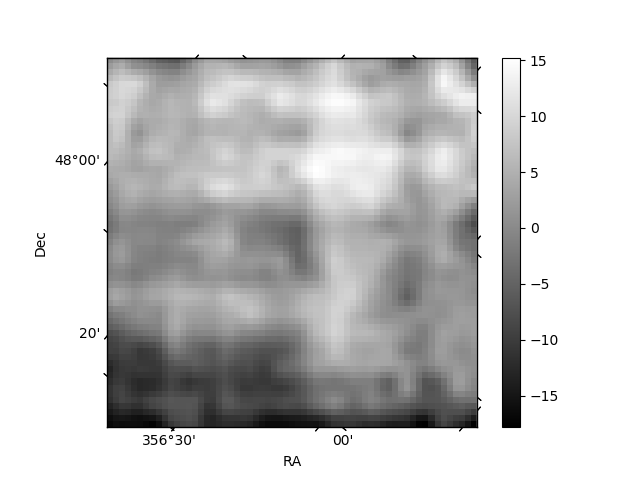
Histogram calculated using DETX and DETY for each event in the final _common_clean file
| Quadrant A | 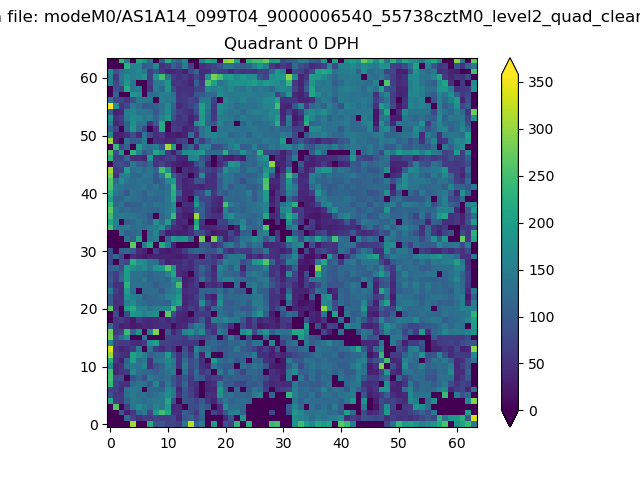 |
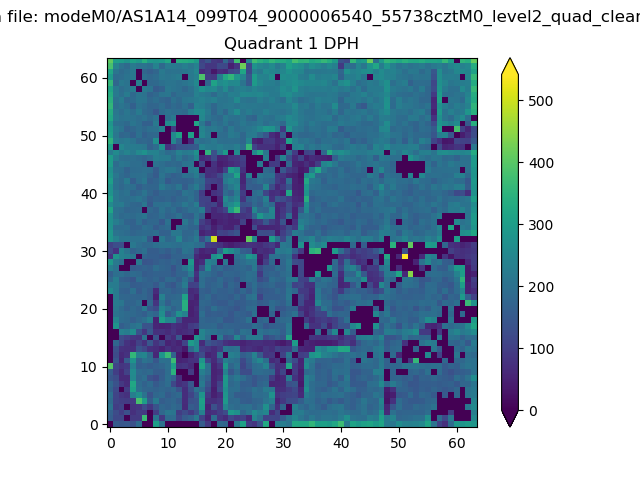 |
Quadrant B |
|---|---|---|---|
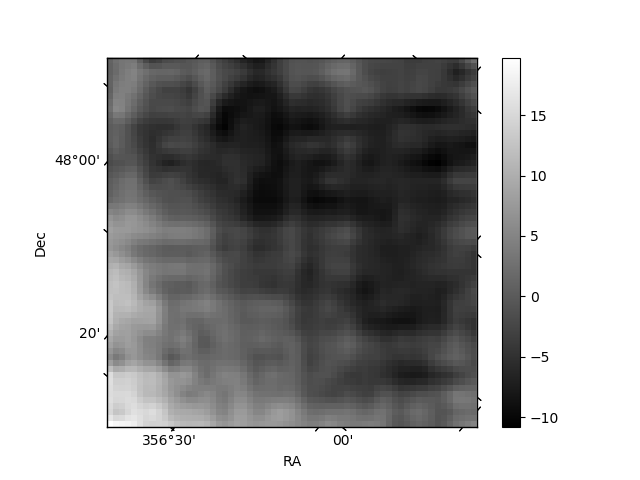
| Quadrant D | 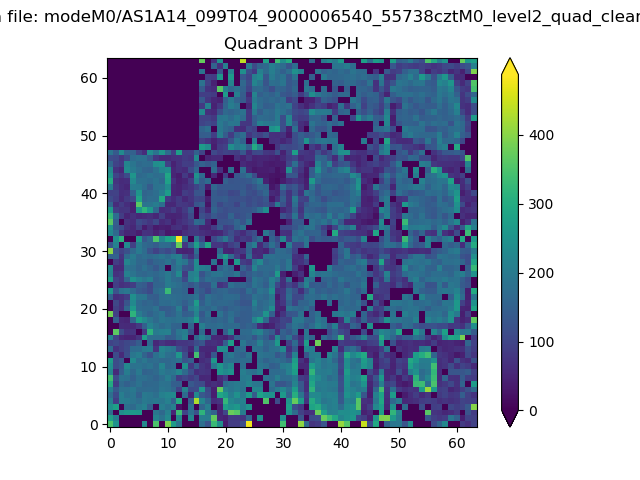 |
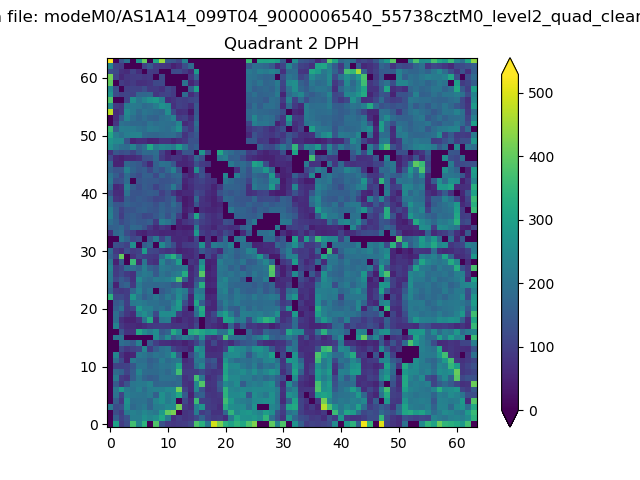 |
Quadrant C |
| Plot type | Count rate plots | Images |
|---|---|---|
| Comparison with Poisson distribution Blue bars denote a histogram of data divided into 1 sec bins. Red curve is a Poisson curve with rate = median count rate of data. |
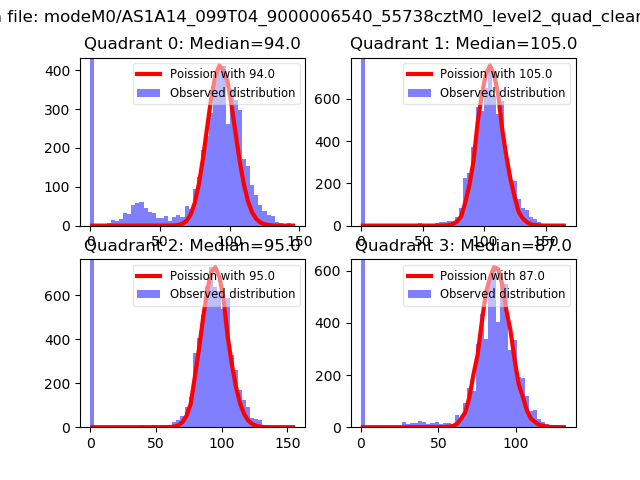 |
 |
| Quadrant-wise count rates Data is divided into 100 sec bins |
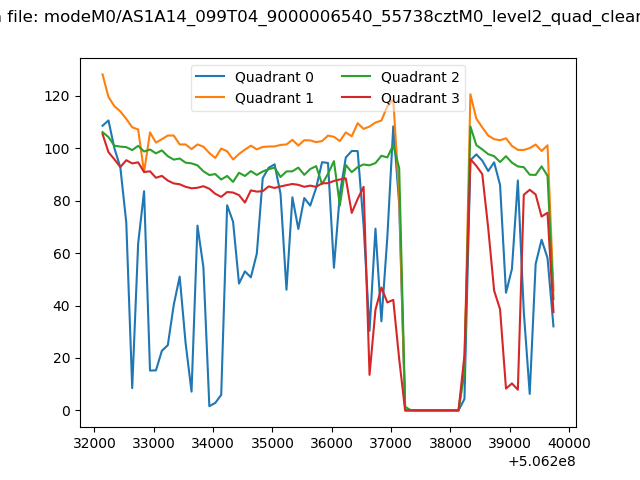 |
|
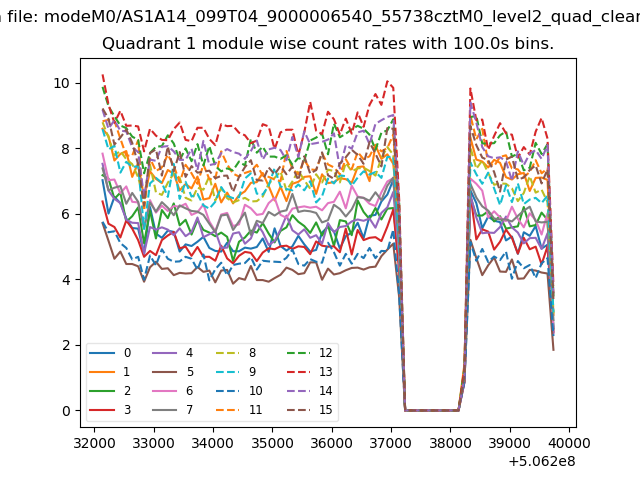
| Module-wise count rates for Quadrant A Data is divided into 100 sec bins |
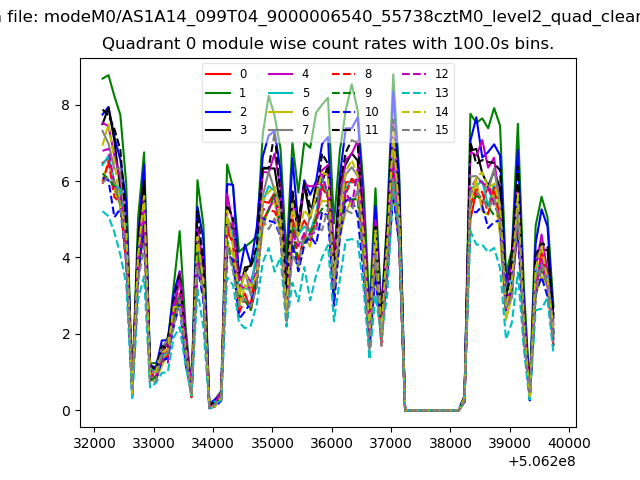 |
 |
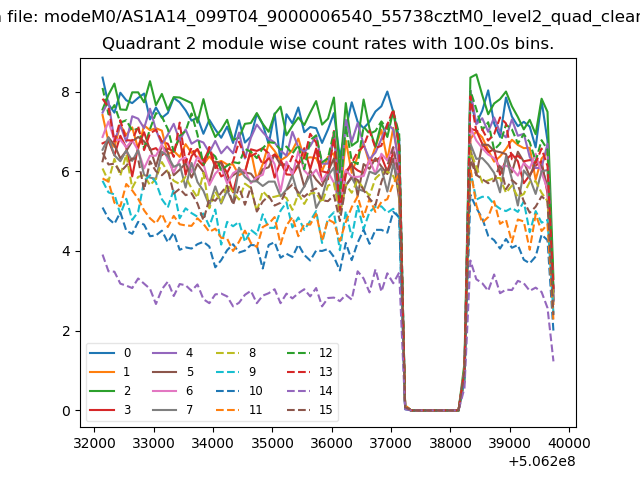
| Module-wise count rates for Quadrant B Data is divided into 100 sec bins |
 |
 |
| Module-wise count rates for Quadrant C Data is divided into 100 sec bins |
 |
 |
| Module-wise count rates for Quadrant D Data is divided into 100 sec bins |
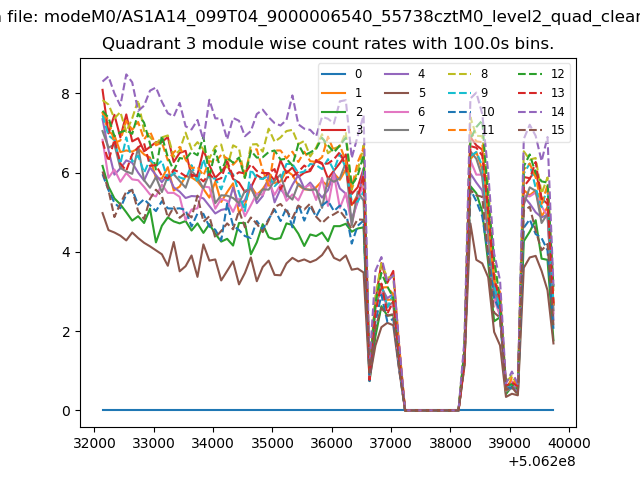 |
 |
| Parameter | Plot |
|---|---|
| CZT HV Monitor | 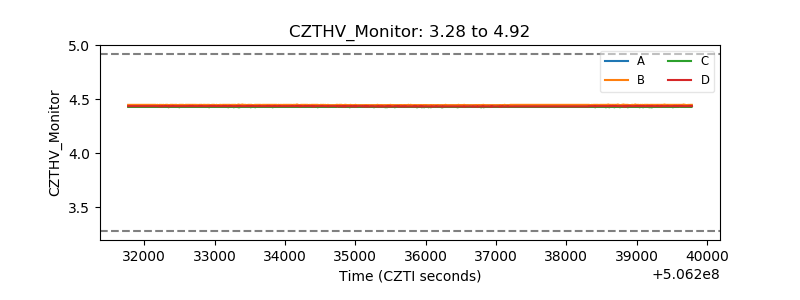 |
| D_VDD | 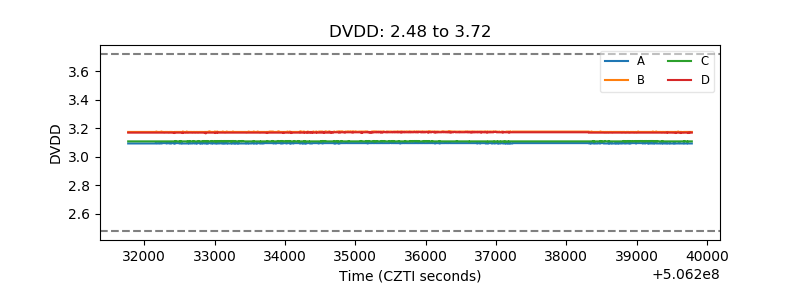 |
| Temperature 1 | 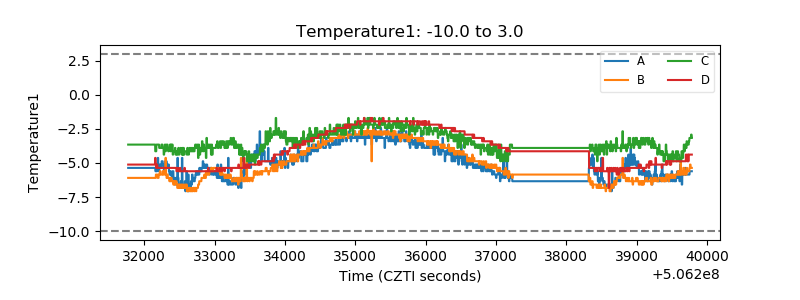 |
| Veto HV Monitor | 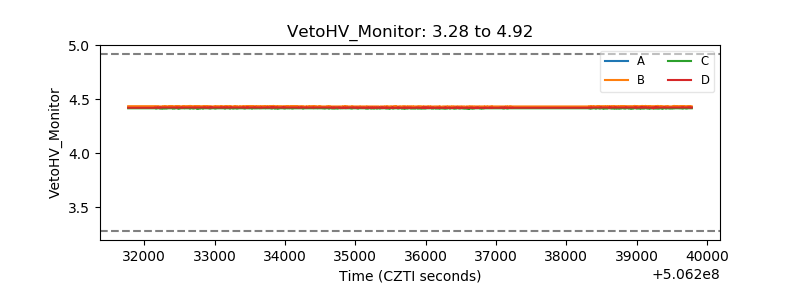 |
| Veto LLD | 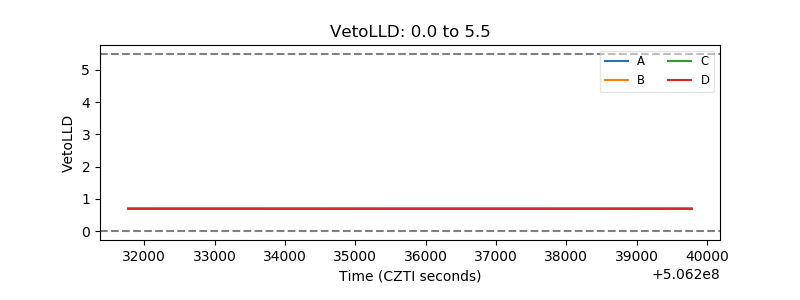 |
| Alpha Counter | 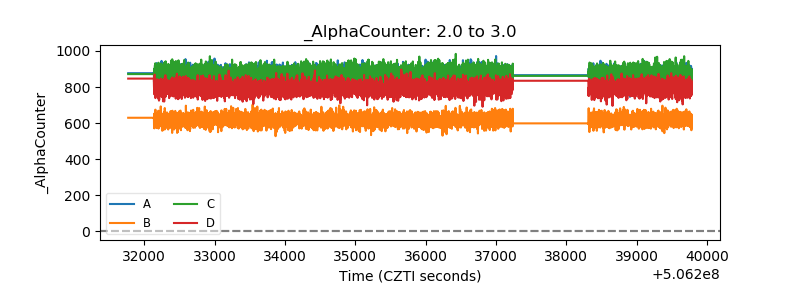 |
| _CPM_Rate | 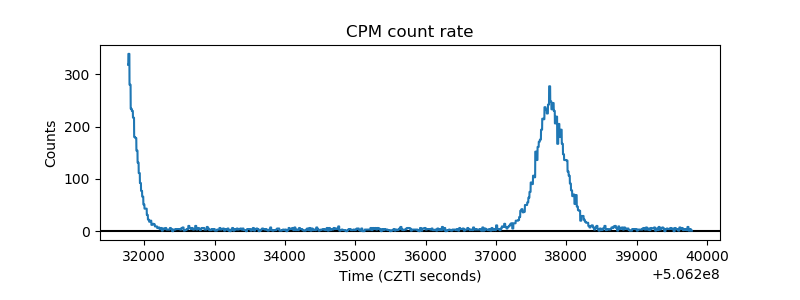 |
| CZT Counter | 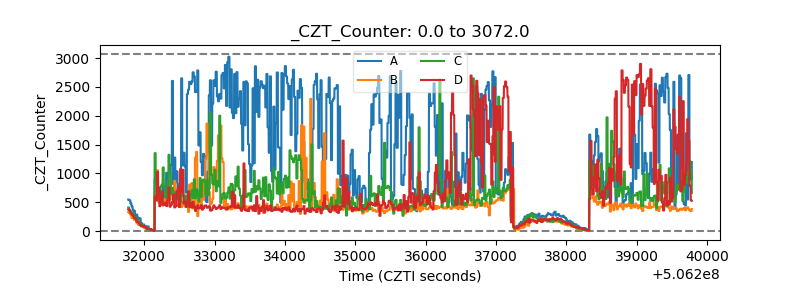 |
| +2.5 Volts monitor |  |
| +5 Volts monitor |  |
| _ROLL_ROT | 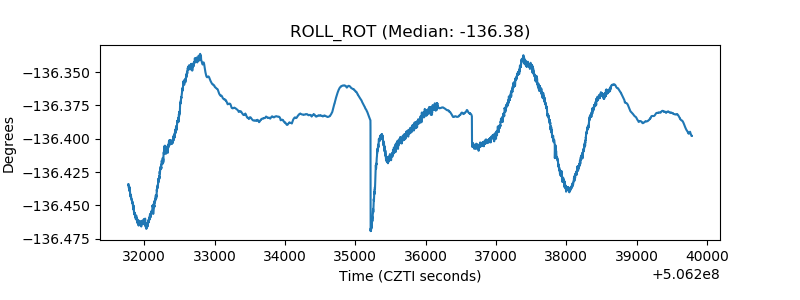 |
| _Roll_DEC | 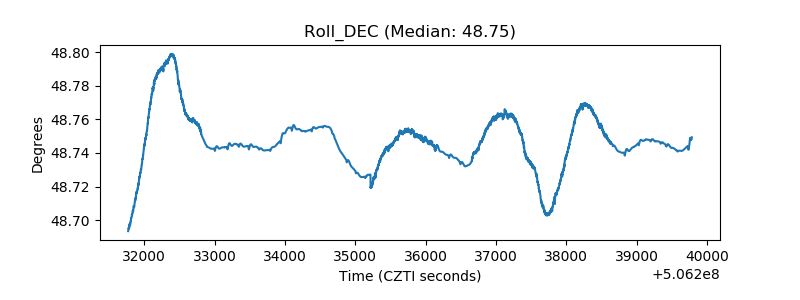 |
| _Roll_RA | 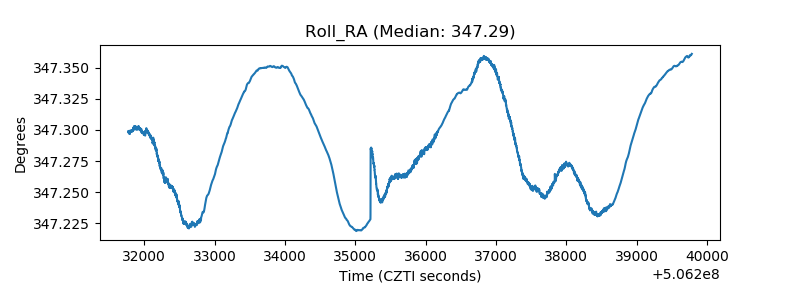 |
| Veto Counter | 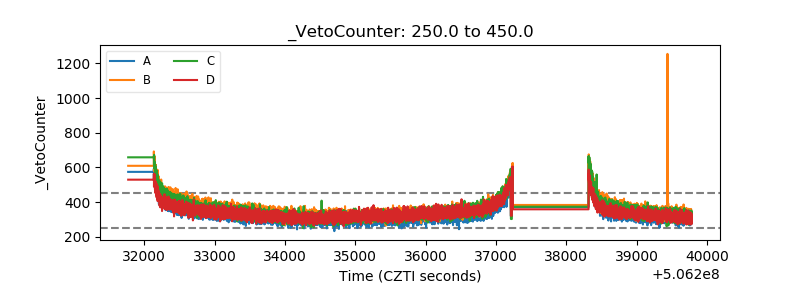 |