| Param | Original file | Final file |
|---|---|---|
| Filename | modeM0/AS1A14_099T04_9000006540_55739cztM0_level2.fits | modeM0/AS1A14_099T04_9000006540_55739cztM0_level2_quad_clean.evt |
| Size (bytes) | 793,964,160 | 76,086,720 |
| Size | 757.2 MB | 72.6 MB |
| Events in quadrant A | 10,137,208 | 362,862 |
| Events in quadrant B | 6,525,546 | 491,502 |
| Events in quadrant C | 4,494,672 | 578,375 |
| Events in quadrant D | 7,736,866 | 424,203 |
| Mode M0 | |||
|---|---|---|---|
| Quadrant | BADHDUFLAG | Total packets | Discarded packets |
| A | 0 | 34544 | 1 |
| B | 0 | 24052 | 1 |
| C | 0 | 17686 | 1 |
| D | 0 | 27415 | 1 |
| Mode M9 | |||
|---|---|---|---|
| Quadrant | BADHDUFLAG | Total packets | Discarded packets |
| A | 0 | 7 | 0 |
| B | 0 | 7 | 0 |
| C | 0 | 7 | 0 |
| D | 0 | 7 | 0 |
| Mode SS | |||
|---|---|---|---|
| Quadrant | BADHDUFLAG | Total packets | Discarded packets |
| A | 0 | 130 | 0 |
| B | 0 | 130 | 0 |
| C | 0 | 130 | 0 |
| D | 0 | 130 | 0 |
| Quadrant | Total seconds | Saturated seconds | Saturation percentage |
|---|---|---|---|
| A | 6400 | 2736 | 42.750000% |
| B | 6400 | 1707 | 26.671875% |
| C | 6401 | 156 | 2.437119% |
| D | 6401 | 1628 | 25.433526% |
Noise dominated data is calculated using 1-second bins in cleaned event files. If a bin has >2000 counts, and if more than 50% of those come from <1% of pixels, then it is considered to be noise-dominated and hence unusable.
| Quadrant | # 1 sec bins | Bins with >0 counts | Bins with >2000 counts | High rate bins dominated by noise | Noise dominated (total time) | Noise dominated (detector-on time) | Marked lightcurve |
|---|---|---|---|---|---|---|---|
| A | 7110 | 6401 | 2096 | 2096 | 29.48% | 32.74% | 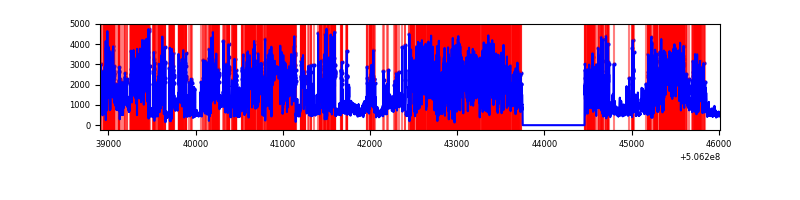 |
| B | 7110 | 6401 | 1339 | 1339 | 18.83% | 20.92% | 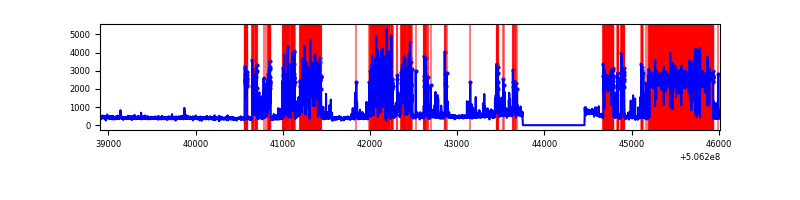 |
| C | 7111 | 6402 | 42 | 42 | 0.59% | 0.66% | 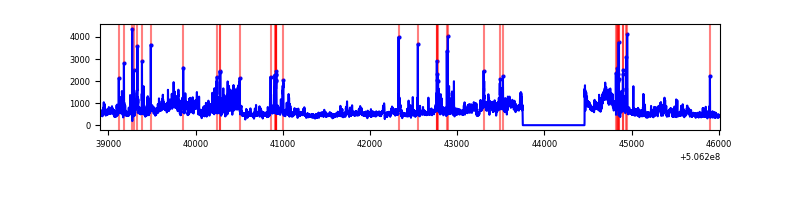 |
| D | 7111 | 6402 | 1310 | 1310 | 18.42% | 20.46% | 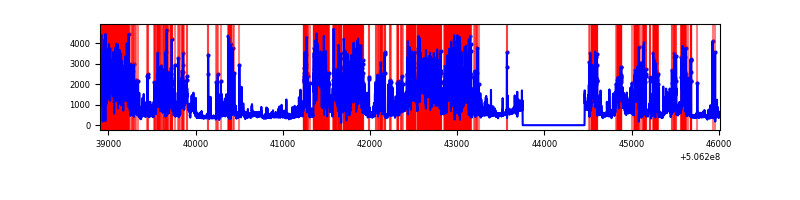 |
Top three noisy pixels from each quadrant. If the there are fewer than three noisy pixels in the level2.evt file, extra rows are filled as -1
| Pixel properties | Quadrant properties | ||||||
|---|---|---|---|---|---|---|---|
| Quadrant | DetID | PixID | Counts | Sigma | Mean | Median | Sigma |
| A | 15 | 32 | 7219907 | 55548.48 | 527 | 513 | 130.0 |
| A | 12 | 115 | 431153 | 3313.49 | 527 | 513 | 130.0 |
| A | 8 | 249 | 163152 | 1251.4 | 527 | 513 | 130.0 |
| B | 4 | 206 | 4103793 | 31926.88 | 599 | 576 | 128.5 |
| B | 12 | 111 | 15707 | 117.73 | 599 | 576 | 128.5 |
| B | 11 | 111 | 14852 | 111.08 | 599 | 576 | 128.5 |
| C | 9 | 38 | 1250462 | 6850.16 | 663 | 657 | 182.4 |
| C | 14 | 96 | 336432 | 1840.38 | 663 | 657 | 182.4 |
| C | 13 | 3 | 193360 | 1056.2 | 663 | 657 | 182.4 |
| D | 11 | 129 | 5244906 | 32127.21 | 578 | 553 | 163.2 |
| D | 8 | 160 | 115968 | 707.04 | 578 | 553 | 163.2 |
| D | 5 | 173 | 38601 | 233.08 | 578 | 553 | 163.2 |
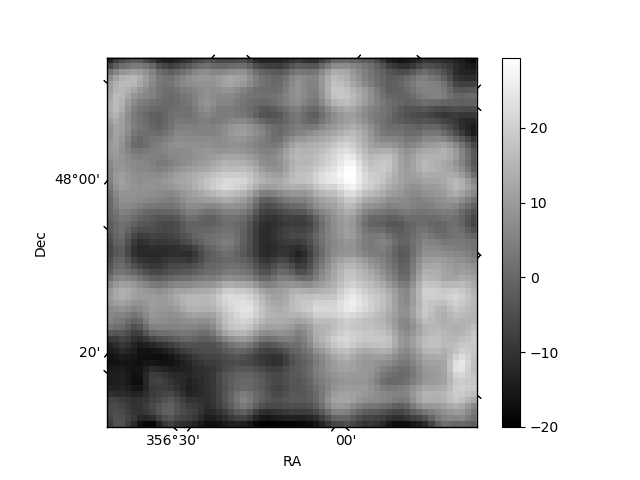
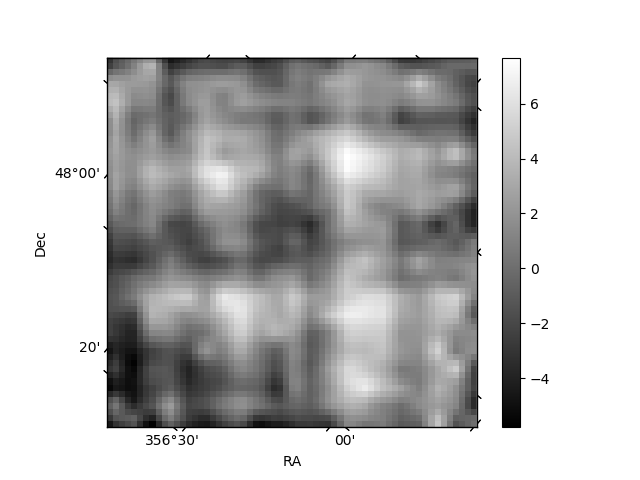
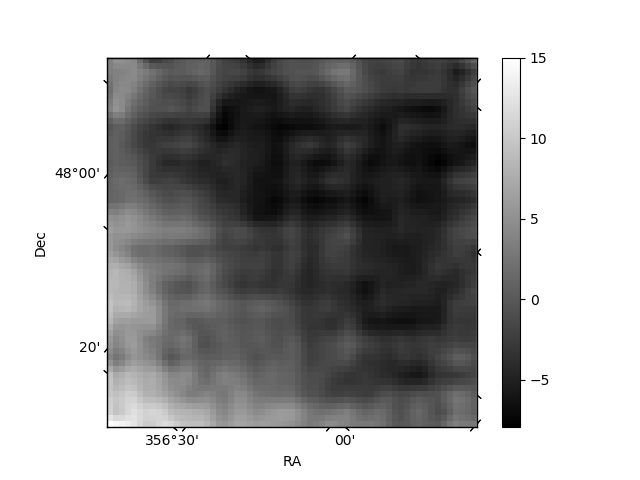
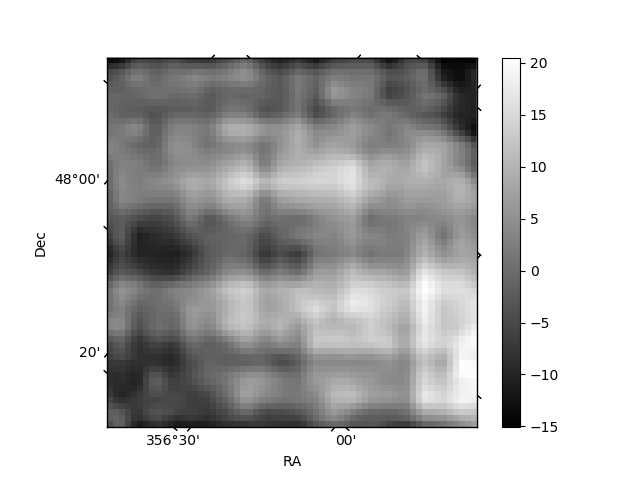
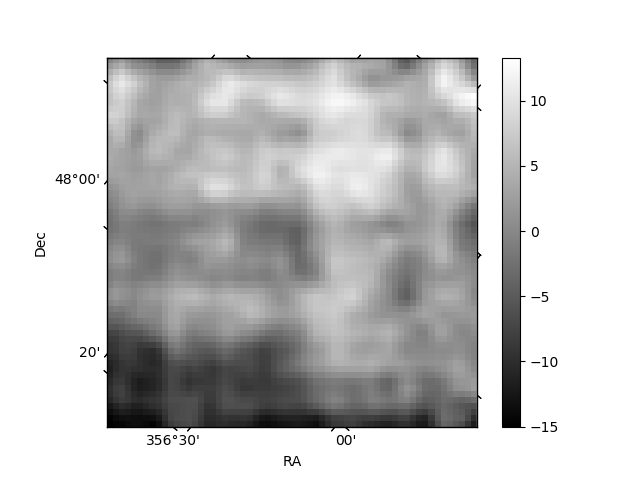
Histogram calculated using DETX and DETY for each event in the final _common_clean file
| Quadrant A | 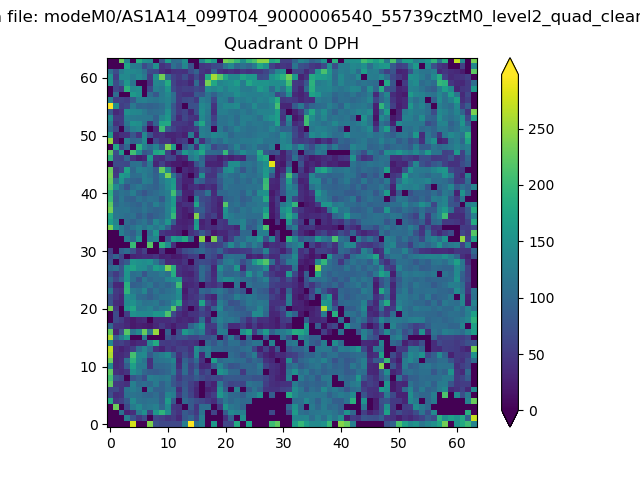 |
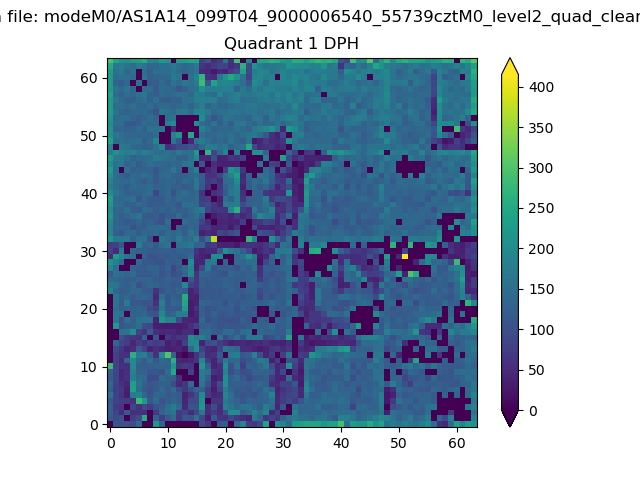 |
Quadrant B |
|---|---|---|---|
| Quadrant D | 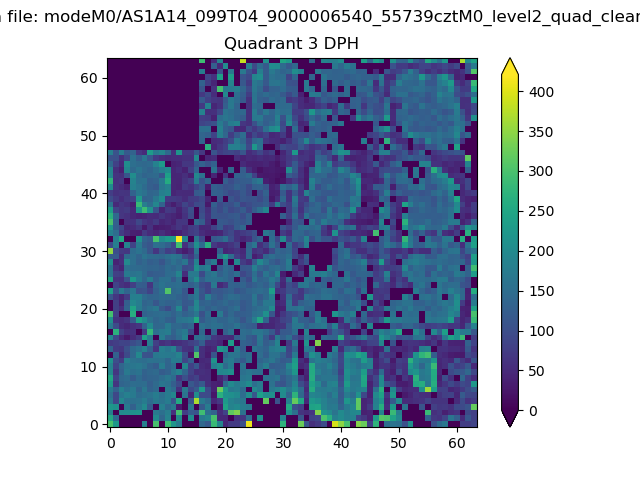 |
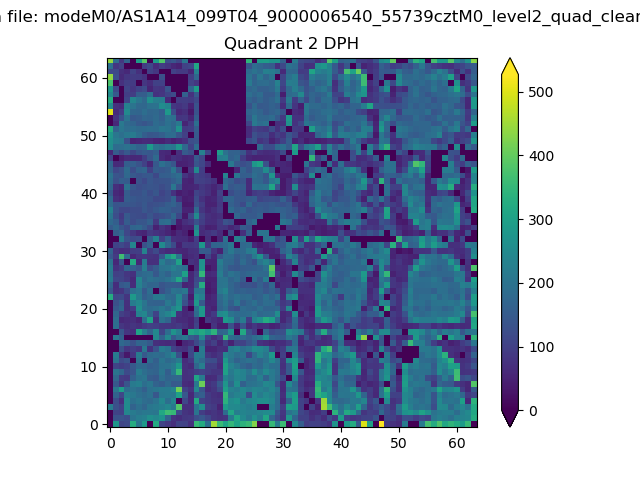 |
Quadrant C |
| Plot type | Count rate plots | Images |
|---|---|---|
| Comparison with Poisson distribution Blue bars denote a histogram of data divided into 1 sec bins. Red curve is a Poisson curve with rate = median count rate of data. |
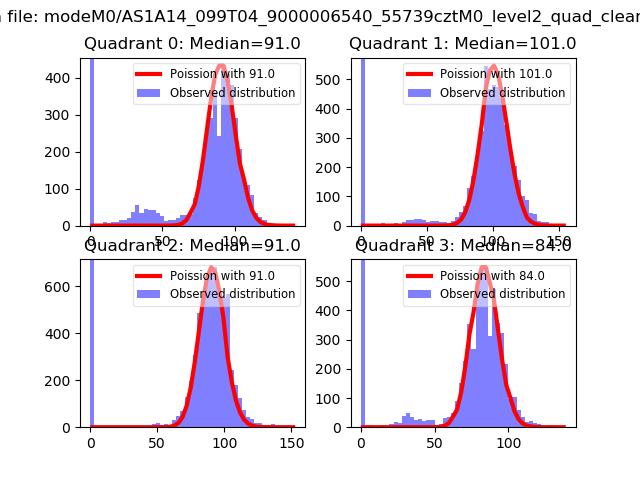 |
 |
| Quadrant-wise count rates Data is divided into 100 sec bins |
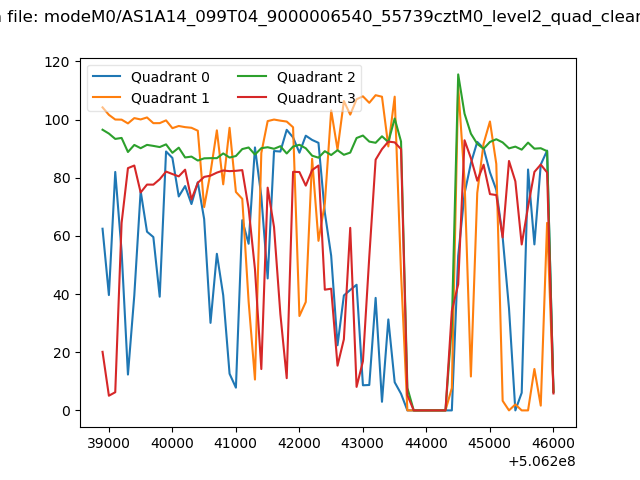 |
|
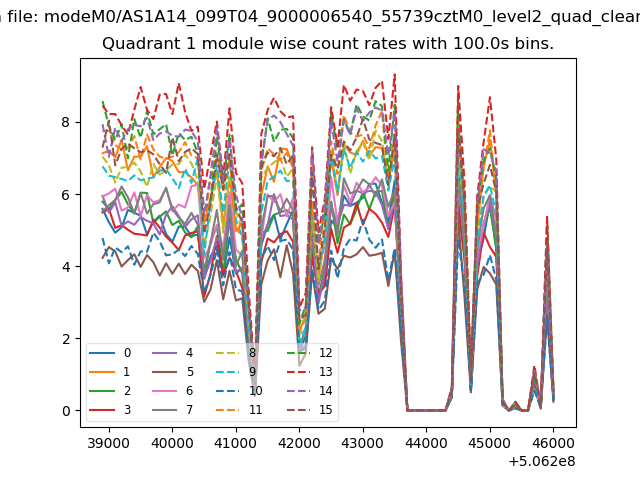
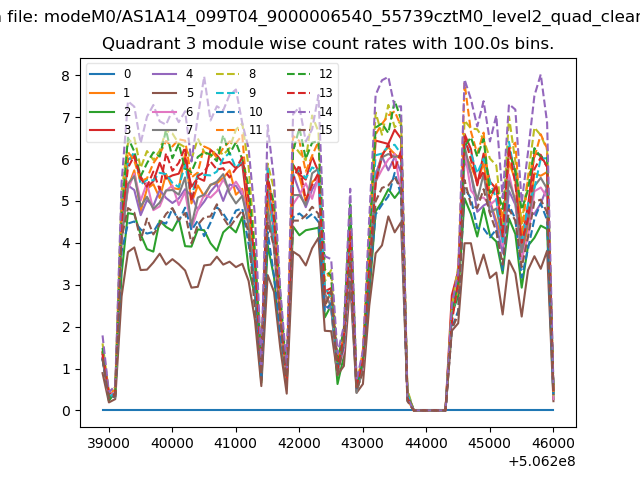
| Module-wise count rates for Quadrant A Data is divided into 100 sec bins |
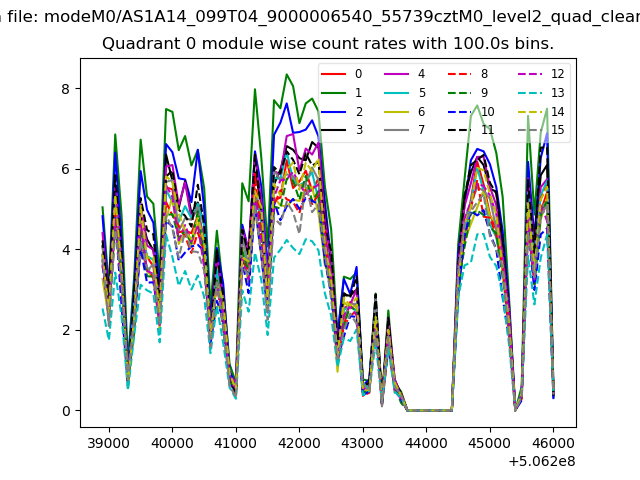 |
 |
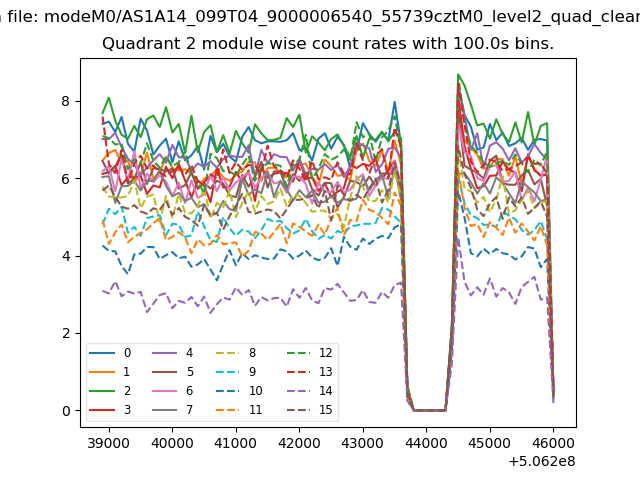
| Module-wise count rates for Quadrant B Data is divided into 100 sec bins |
 |
 |
| Module-wise count rates for Quadrant C Data is divided into 100 sec bins |
 |
 |
| Module-wise count rates for Quadrant D Data is divided into 100 sec bins |
 |
 |
| Parameter | Plot |
|---|---|
| CZT HV Monitor |  |
| D_VDD | 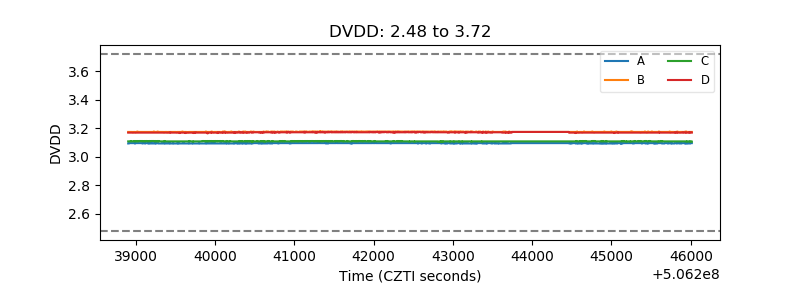 |
| Temperature 1 | 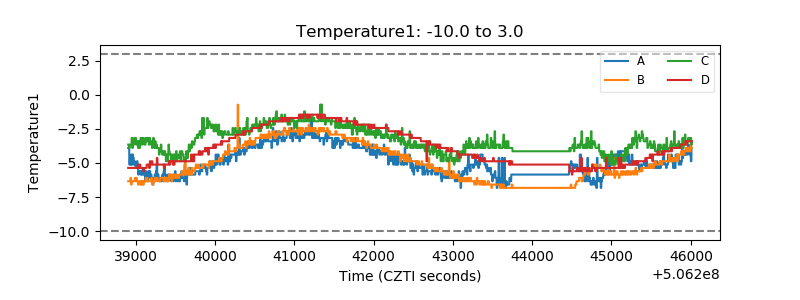 |
| Veto HV Monitor | 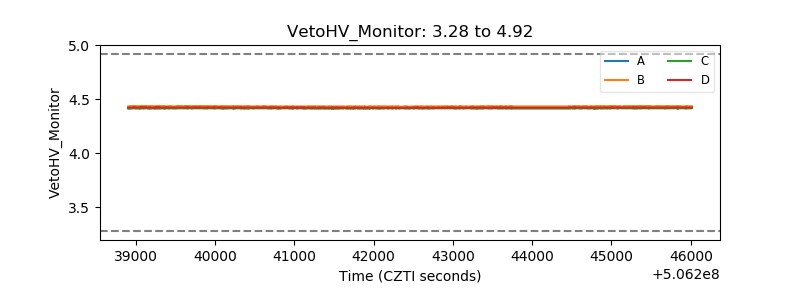 |
| Veto LLD | 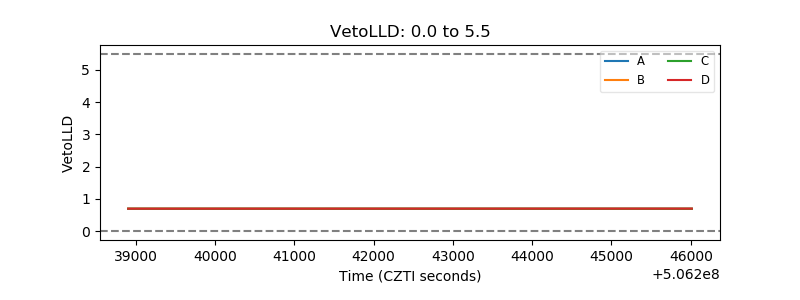 |
| Alpha Counter | 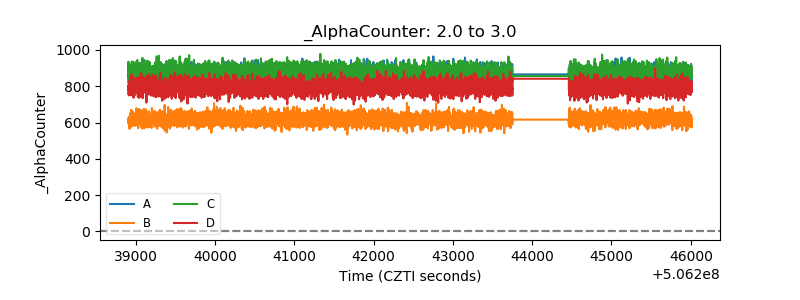 |
| _CPM_Rate | 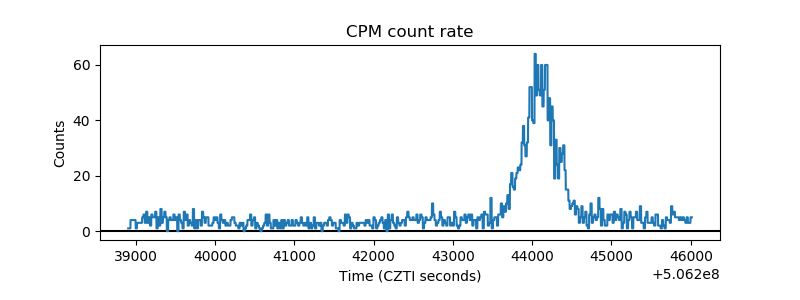 |
| CZT Counter | 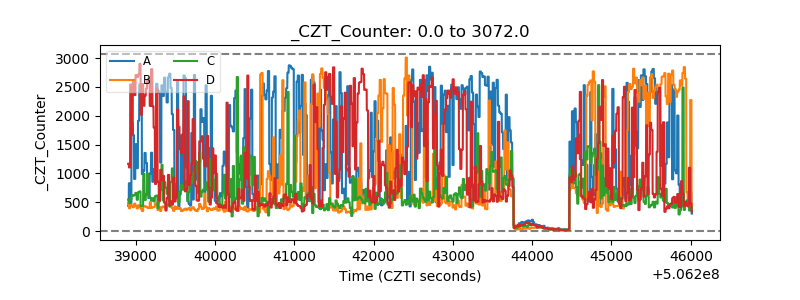 |
| +2.5 Volts monitor |  |
| +5 Volts monitor |  |
| _ROLL_ROT |  |
| _Roll_DEC | 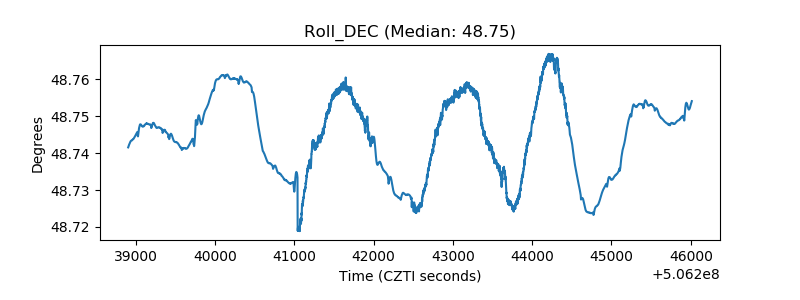 |
| _Roll_RA | 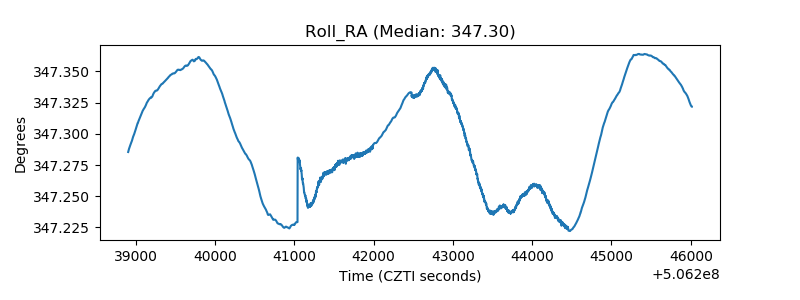 |
| Veto Counter | 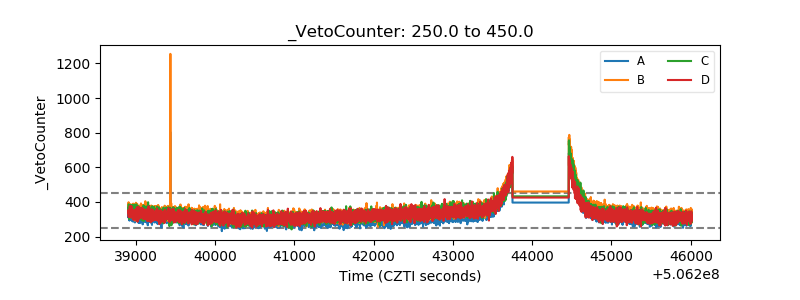 |