| Param | Original file | Final file |
|---|---|---|
| Filename | modeM0/AS1A14_099T04_9000006540_55740cztM0_level2.fits | modeM0/AS1A14_099T04_9000006540_55740cztM0_level2_quad_clean.evt |
| Size (bytes) | 1,014,724,800 | 77,008,320 |
| Size | 967.7 MB | 73.4 MB |
| Events in quadrant A | 10,899,797 | 437,919 |
| Events in quadrant B | 13,700,460 | 240,262 |
| Events in quadrant C | 5,115,652 | 603,596 |
| Events in quadrant D | 7,287,972 | 547,045 |
| Mode M0 | |||
|---|---|---|---|
| Quadrant | BADHDUFLAG | Total packets | Discarded packets |
| A | 0 | 37389 | 0 |
| B | 0 | 45777 | 0 |
| C | 0 | 20107 | 0 |
| D | 0 | 26655 | 0 |
| Mode SS | |||
|---|---|---|---|
| Quadrant | BADHDUFLAG | Total packets | Discarded packets |
| A | 0 | 144 | 0 |
| B | 0 | 144 | 0 |
| C | 0 | 144 | 0 |
| D | 0 | 144 | 0 |
| Quadrant | Total seconds | Saturated seconds | Saturation percentage |
|---|---|---|---|
| A | 7217 | 2892 | 40.072052% |
| B | 7217 | 4852 | 67.230151% |
| C | 7218 | 664 | 9.199224% |
| D | 7218 | 1115 | 15.447492% |
Noise dominated data is calculated using 1-second bins in cleaned event files. If a bin has >2000 counts, and if more than 50% of those come from <1% of pixels, then it is considered to be noise-dominated and hence unusable.
| Quadrant | # 1 sec bins | Bins with >0 counts | Bins with >2000 counts | High rate bins dominated by noise | Noise dominated (total time) | Noise dominated (detector-on time) | Marked lightcurve |
|---|---|---|---|---|---|---|---|
| A | 7217 | 7217 | 2214 | 2214 | 30.68% | 30.68% | 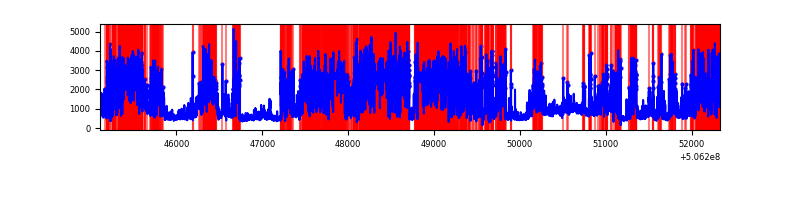 |
| B | 7217 | 7217 | 4498 | 4498 | 62.33% | 62.33% | 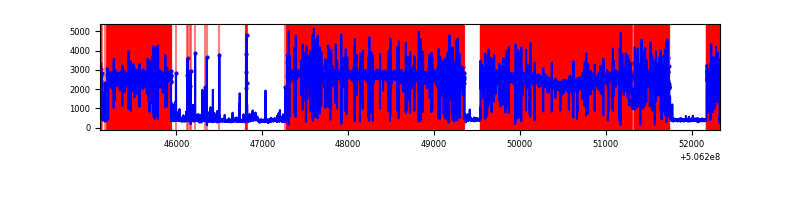 |
| C | 7218 | 7218 | 438 | 438 | 6.07% | 6.07% | 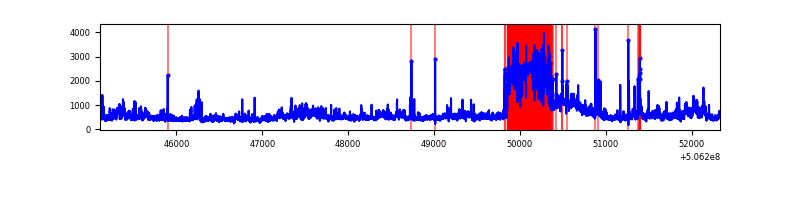 |
| D | 7218 | 7218 | 818 | 818 | 11.33% | 11.33% | 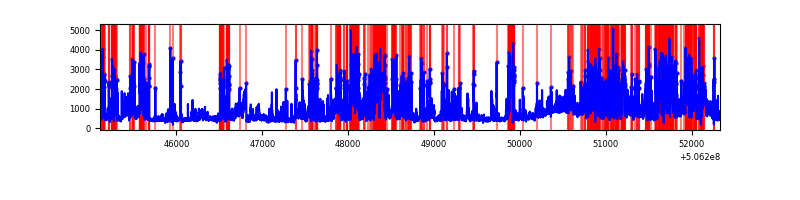 |
Top three noisy pixels from each quadrant. If the there are fewer than three noisy pixels in the level2.evt file, extra rows are filled as -1
| Pixel properties | Quadrant properties | ||||||
|---|---|---|---|---|---|---|---|
| Quadrant | DetID | PixID | Counts | Sigma | Mean | Median | Sigma |
| A | 15 | 32 | 7470231 | 46657.68 | 655 | 635 | 160.1 |
| A | 8 | 249 | 434412 | 2709.52 | 655 | 635 | 160.1 |
| A | 8 | 192 | 150803 | 938.0 | 655 | 635 | 160.1 |
| B | 4 | 206 | 11889174 | 122973.87 | 445 | 429 | 96.7 |
| B | 0 | 199 | 23242 | 235.97 | 445 | 429 | 96.7 |
| B | 12 | 111 | 11566 | 115.2 | 445 | 429 | 96.7 |
| C | 15 | 199 | 1117786 | 5612.93 | 723 | 715 | 199.0 |
| C | 9 | 38 | 856299 | 4299.04 | 723 | 715 | 199.0 |
| C | 6 | 223 | 98473 | 491.2 | 723 | 715 | 199.0 |
| D | 11 | 129 | 3838660 | 18908.05 | 727 | 696 | 203.0 |
| D | 8 | 160 | 323120 | 1588.45 | 727 | 696 | 203.0 |
| D | 13 | 84 | 86090 | 420.7 | 727 | 696 | 203.0 |
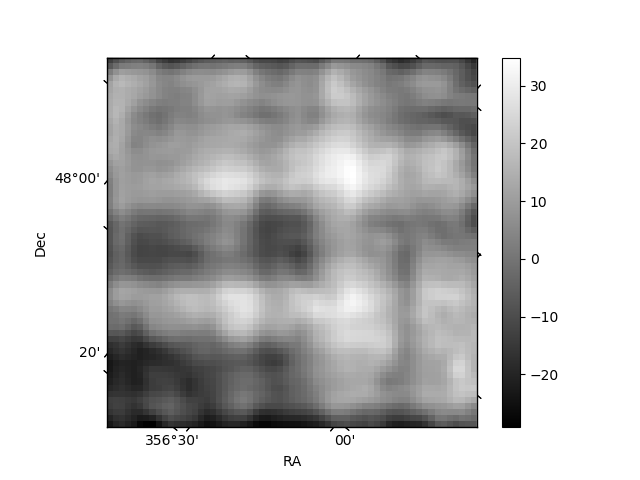
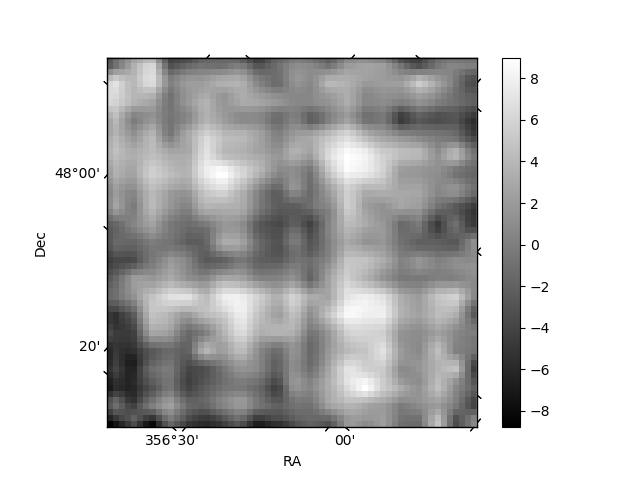
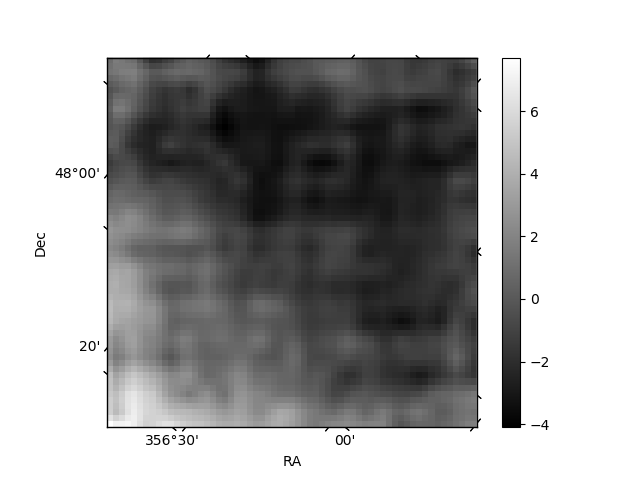
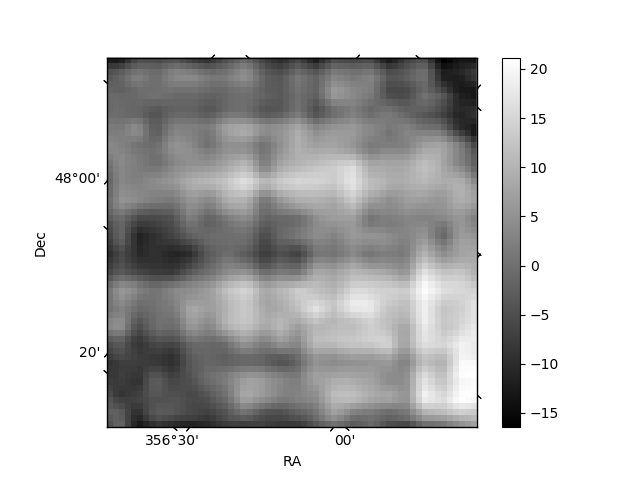
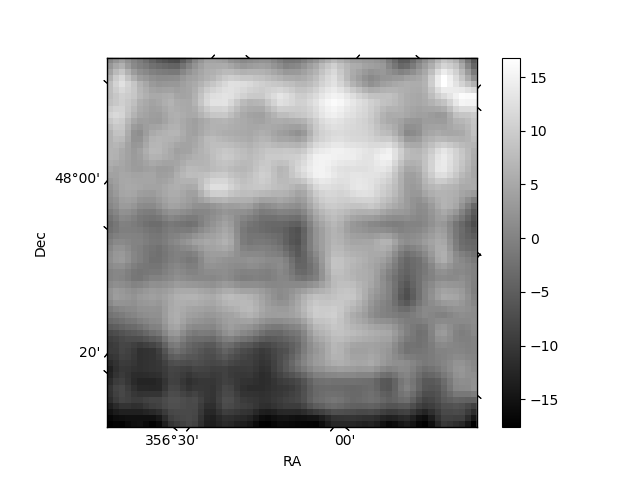
Histogram calculated using DETX and DETY for each event in the final _common_clean file
| Quadrant A | 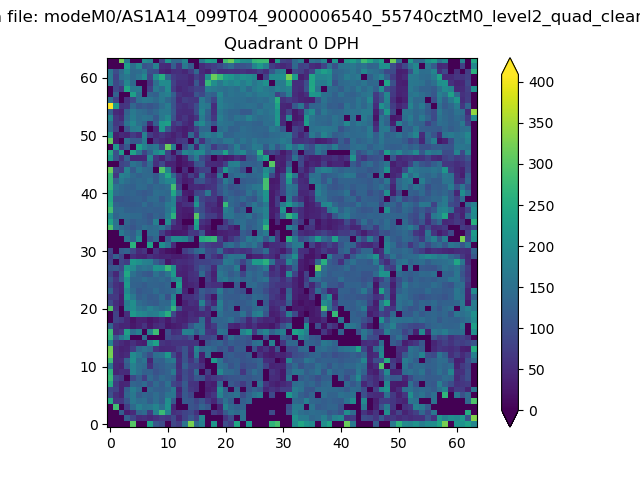 |
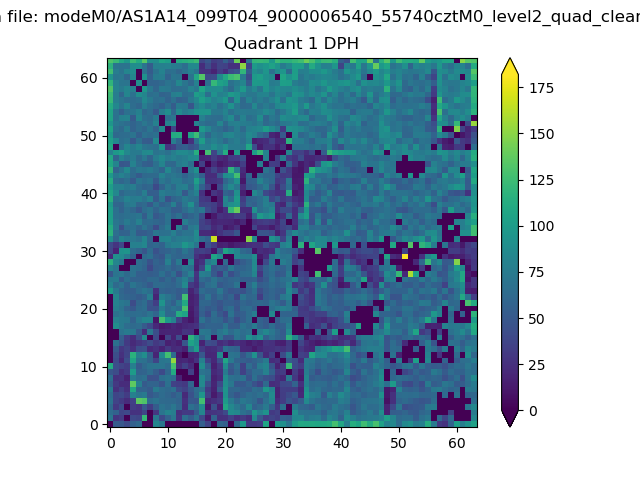 |
Quadrant B |
|---|---|---|---|
| Quadrant D | 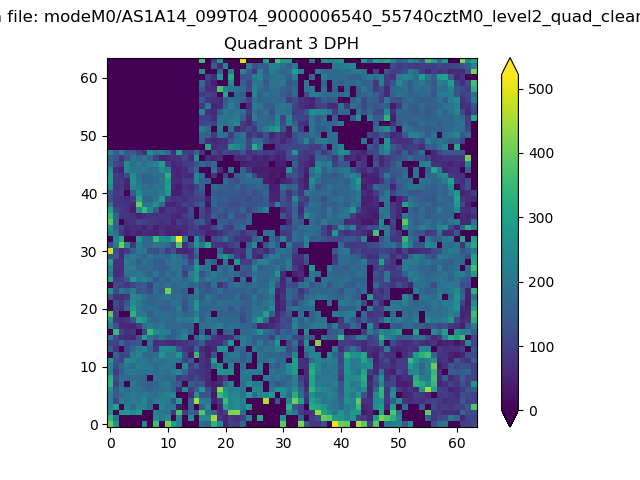 |
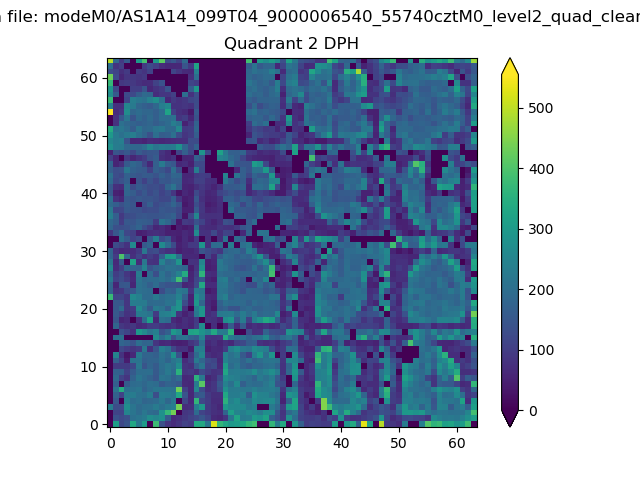 |
Quadrant C |
| Plot type | Count rate plots | Images |
|---|---|---|
| Comparison with Poisson distribution Blue bars denote a histogram of data divided into 1 sec bins. Red curve is a Poisson curve with rate = median count rate of data. |
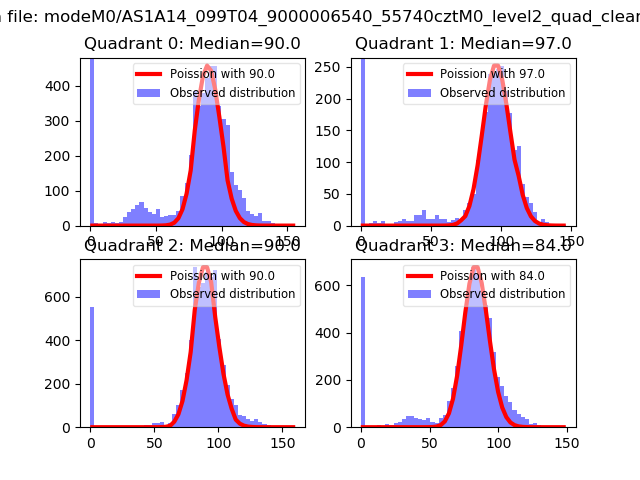 |
 |
| Quadrant-wise count rates Data is divided into 100 sec bins |
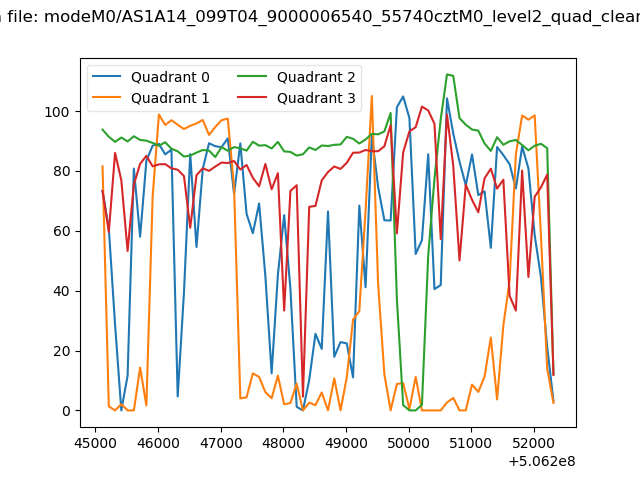 |
|
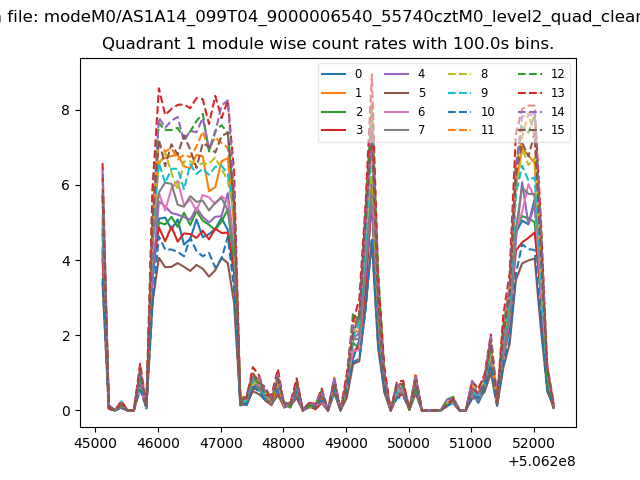
| Module-wise count rates for Quadrant A Data is divided into 100 sec bins |
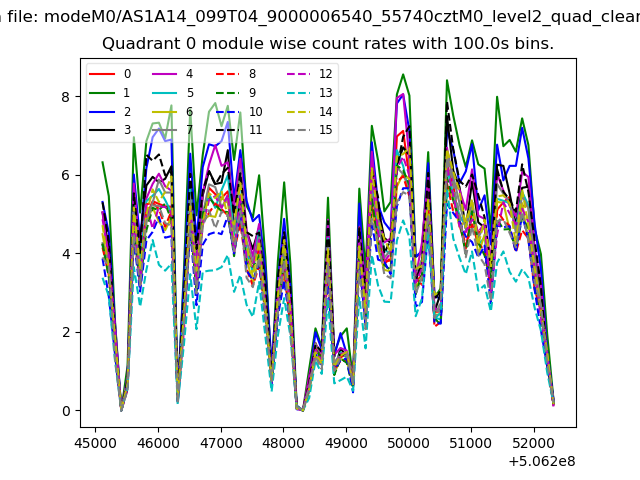 |
 |
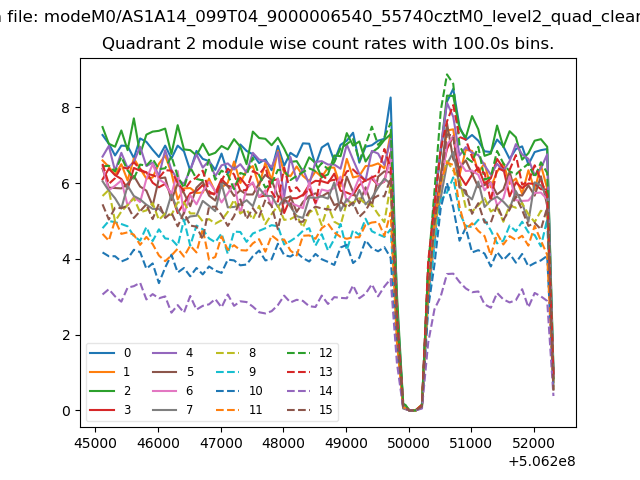
| Module-wise count rates for Quadrant B Data is divided into 100 sec bins |
 |
 |
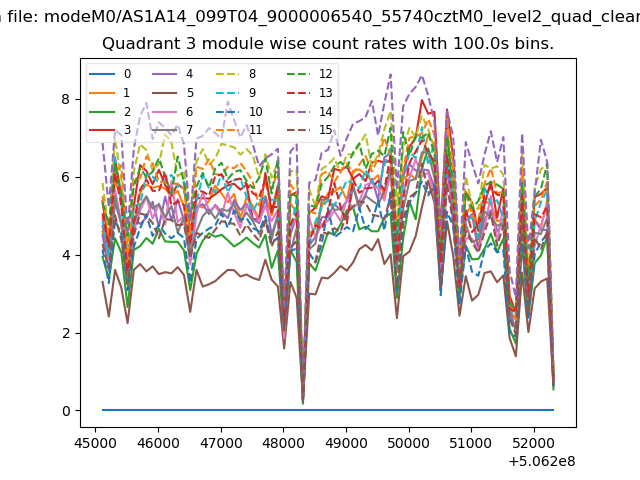
| Module-wise count rates for Quadrant C Data is divided into 100 sec bins |
 |
 |
| Module-wise count rates for Quadrant D Data is divided into 100 sec bins |
 |
 |
| Parameter | Plot |
|---|---|
| CZT HV Monitor | 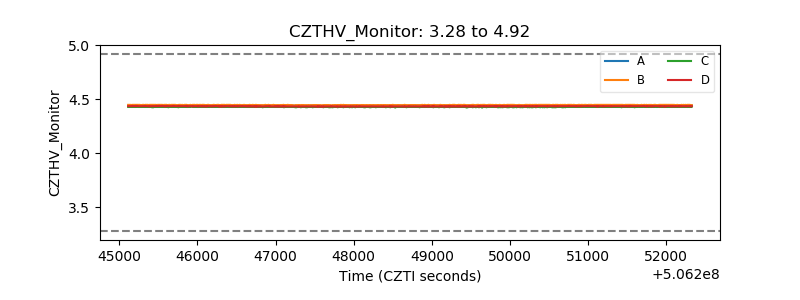 |
| D_VDD | 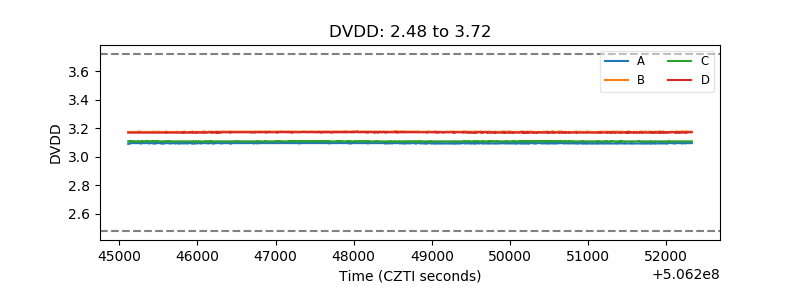 |
| Temperature 1 | 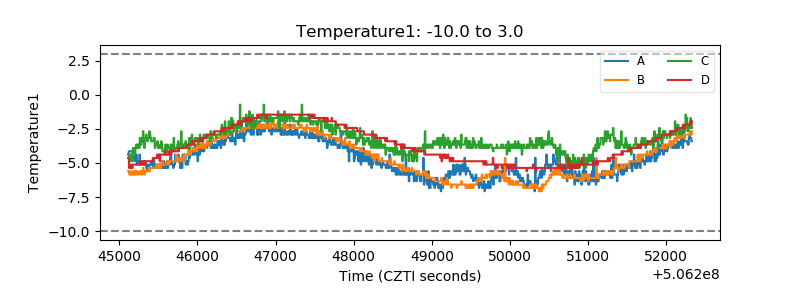 |
| Veto HV Monitor | 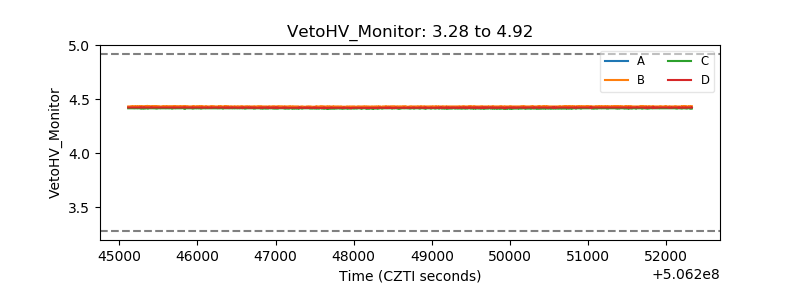 |
| Veto LLD | 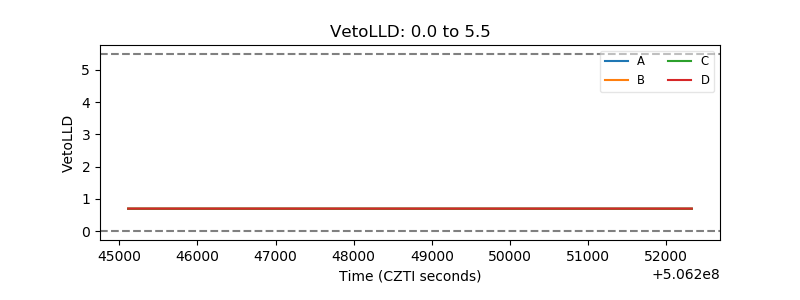 |
| Alpha Counter | 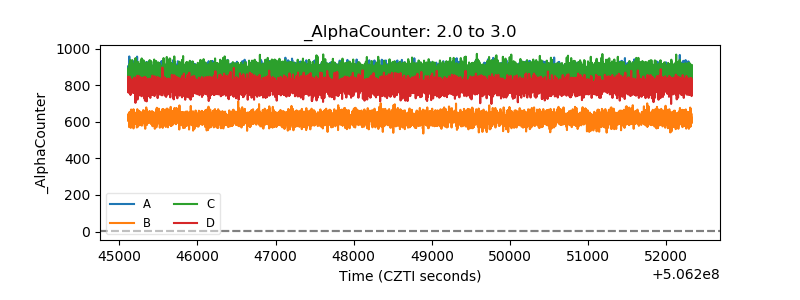 |
| _CPM_Rate | 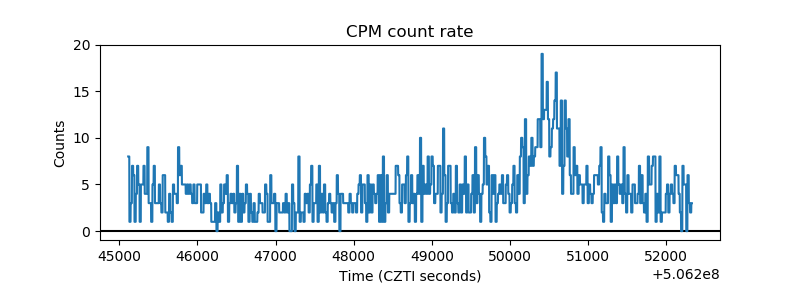 |
| CZT Counter | 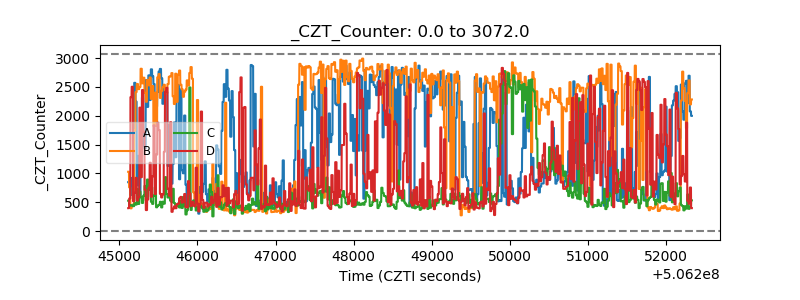 |
| +2.5 Volts monitor |  |
| +5 Volts monitor |  |
| _ROLL_ROT | 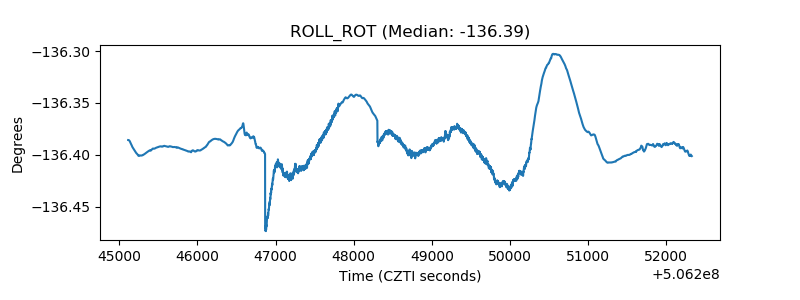 |
| _Roll_DEC | 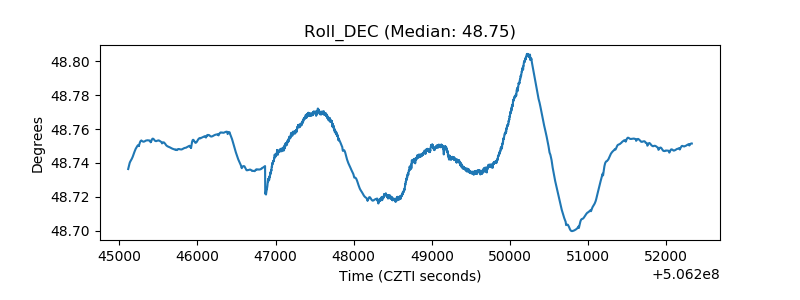 |
| _Roll_RA | 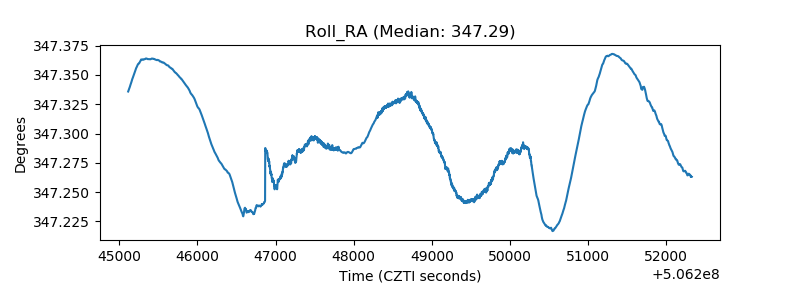 |
| Veto Counter | 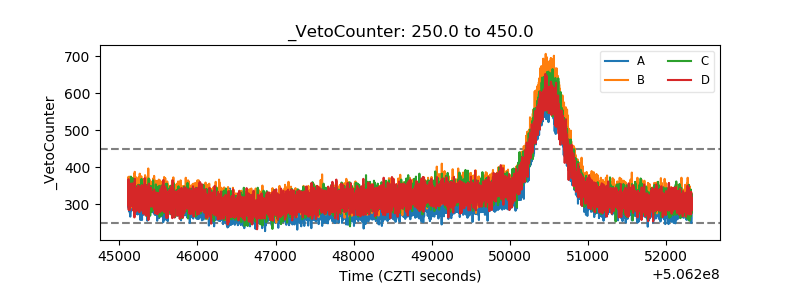 |