| Param | Original file | Final file |
|---|---|---|
| Filename | modeM0/AS1A14_099T04_9000006540_55741cztM0_level2.fits | modeM0/AS1A14_099T04_9000006540_55741cztM0_level2_quad_clean.evt |
| Size (bytes) | 813,709,440 | 89,245,440 |
| Size | 776.0 MB | 85.1 MB |
| Events in quadrant A | 9,319,016 | 506,256 |
| Events in quadrant B | 5,514,939 | 620,708 |
| Events in quadrant C | 5,900,808 | 615,042 |
| Events in quadrant D | 8,832,324 | 461,768 |
| Mode M0 | |||
|---|---|---|---|
| Quadrant | BADHDUFLAG | Total packets | Discarded packets |
| A | 0 | 32629 | 0 |
| B | 0 | 21705 | 0 |
| C | 0 | 22338 | 0 |
| D | 0 | 31250 | 0 |
| Mode SS | |||
|---|---|---|---|
| Quadrant | BADHDUFLAG | Total packets | Discarded packets |
| A | 0 | 142 | 0 |
| B | 0 | 142 | 0 |
| C | 0 | 142 | 0 |
| D | 0 | 142 | 0 |
| Quadrant | Total seconds | Saturated seconds | Saturation percentage |
|---|---|---|---|
| A | 7158 | 1889 | 26.390053% |
| B | 7158 | 966 | 13.495390% |
| C | 7158 | 406 | 5.671975% |
| D | 7158 | 1779 | 24.853311% |
Noise dominated data is calculated using 1-second bins in cleaned event files. If a bin has >2000 counts, and if more than 50% of those come from <1% of pixels, then it is considered to be noise-dominated and hence unusable.
| Quadrant | # 1 sec bins | Bins with >0 counts | Bins with >2000 counts | High rate bins dominated by noise | Noise dominated (total time) | Noise dominated (detector-on time) | Marked lightcurve |
|---|---|---|---|---|---|---|---|
| A | 7158 | 7158 | 1537 | 1537 | 21.47% | 21.47% | 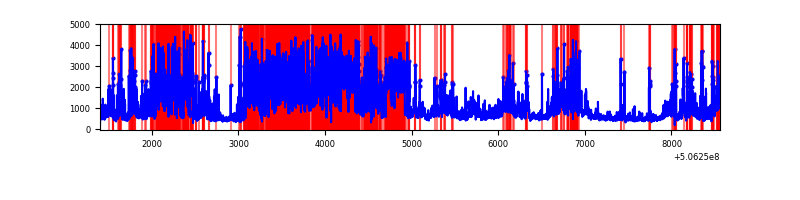 |
| B | 7158 | 7158 | 849 | 849 | 11.86% | 11.86% | 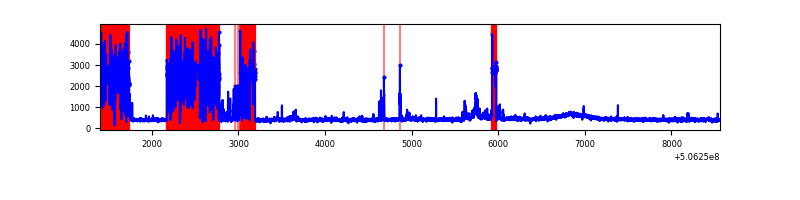 |
| C | 7158 | 7158 | 317 | 317 | 4.43% | 4.43% | 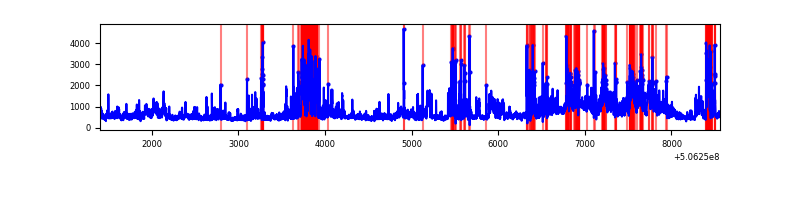 |
| D | 7158 | 7158 | 1666 | 1666 | 23.27% | 23.27% | 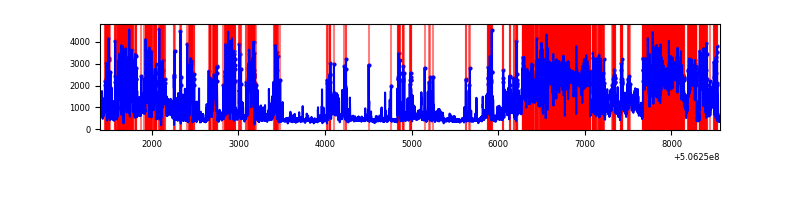 |
Top three noisy pixels from each quadrant. If the there are fewer than three noisy pixels in the level2.evt file, extra rows are filled as -1
| Pixel properties | Quadrant properties | ||||||
|---|---|---|---|---|---|---|---|
| Quadrant | DetID | PixID | Counts | Sigma | Mean | Median | Sigma |
| A | 15 | 32 | 4958625 | 29980.68 | 667 | 650 | 165.4 |
| A | 8 | 249 | 601150 | 3631.2 | 667 | 650 | 165.4 |
| A | 3 | 14 | 529578 | 3198.41 | 667 | 650 | 165.4 |
| B | 4 | 206 | 2711957 | 18200.56 | 691 | 667 | 149.0 |
| B | 0 | 199 | 40979 | 270.61 | 691 | 667 | 149.0 |
| B | 12 | 111 | 18488 | 119.63 | 691 | 667 | 149.0 |
| C | 9 | 38 | 1459321 | 7427.51 | 712 | 706 | 196.4 |
| C | 15 | 199 | 978935 | 4981.31 | 712 | 706 | 196.4 |
| C | 13 | 3 | 245766 | 1247.89 | 712 | 706 | 196.4 |
| D | 11 | 129 | 5476840 | 30479.75 | 633 | 604 | 179.7 |
| D | 8 | 245 | 566263 | 3148.35 | 633 | 604 | 179.7 |
| D | 8 | 160 | 156750 | 869.08 | 633 | 604 | 179.7 |
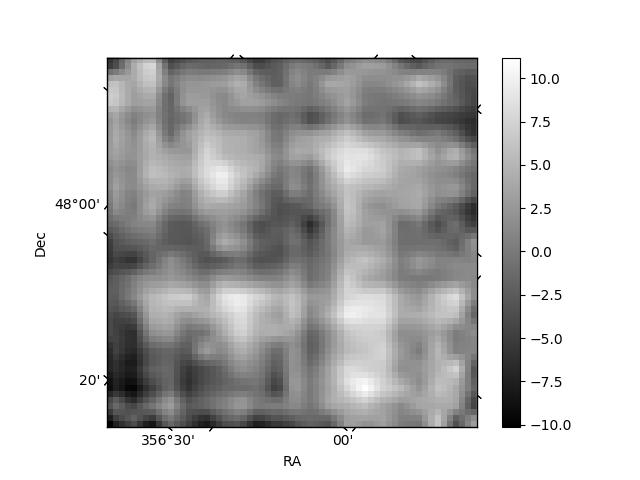
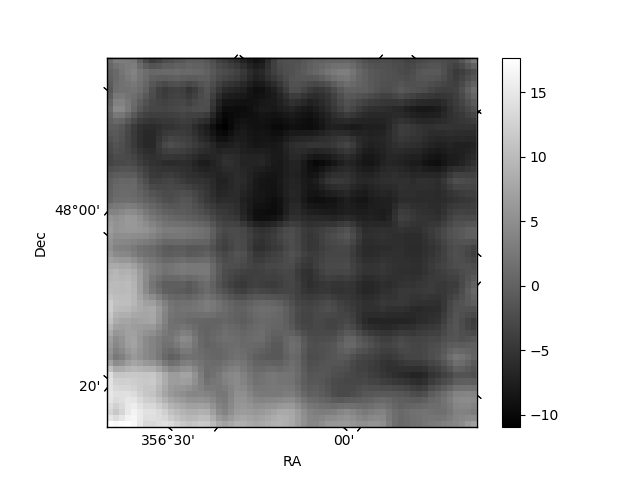
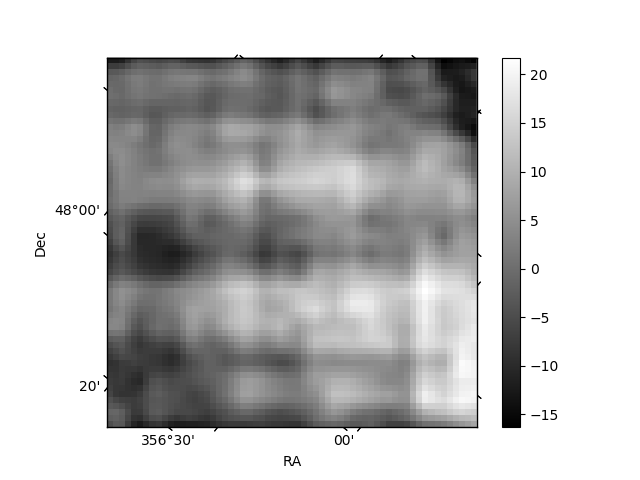
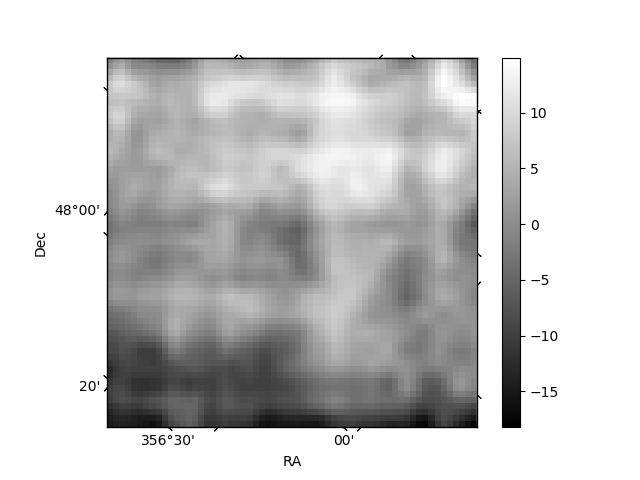
Histogram calculated using DETX and DETY for each event in the final _common_clean file
| Quadrant A | 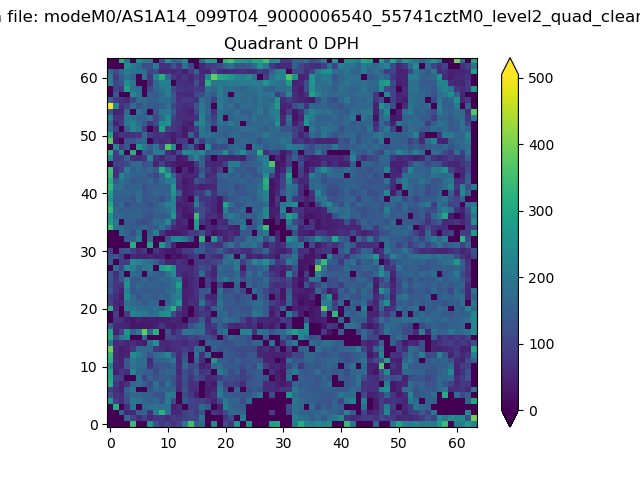 |
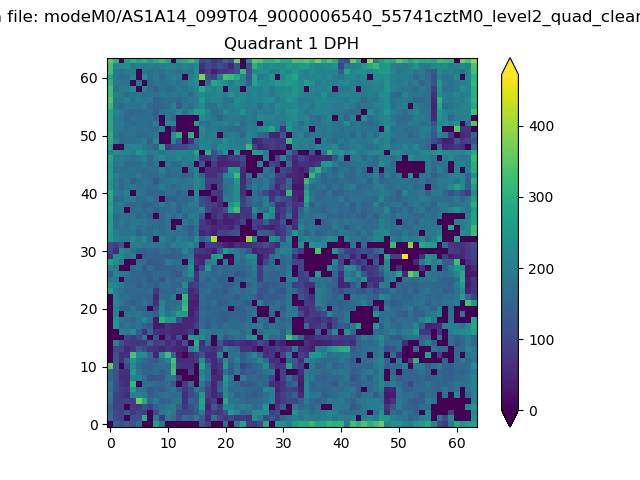 |
Quadrant B |
|---|---|---|---|
| Quadrant D | 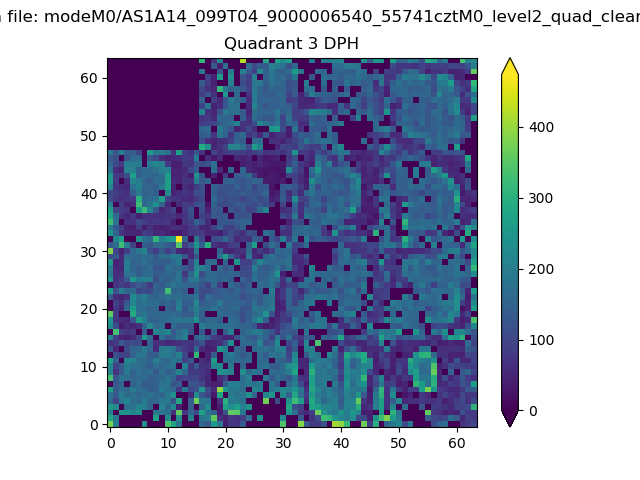 |
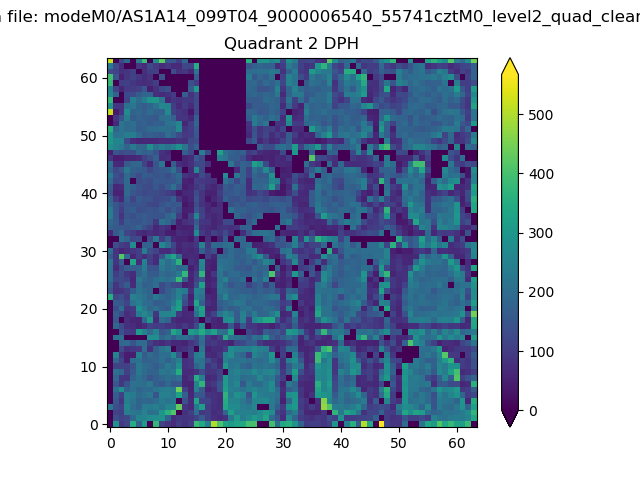 |
Quadrant C |
| Plot type | Count rate plots | Images |
|---|---|---|
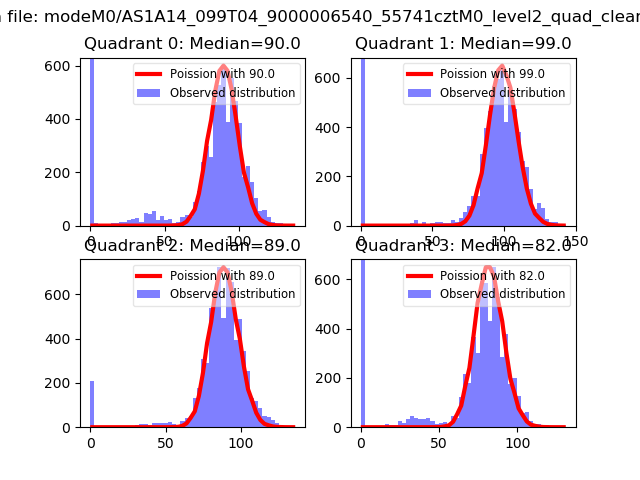
| Comparison with Poisson distribution Blue bars denote a histogram of data divided into 1 sec bins. Red curve is a Poisson curve with rate = median count rate of data. |
 |
 |
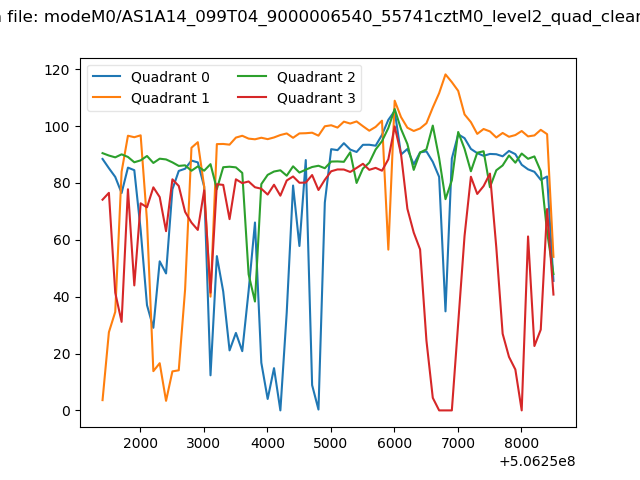
| Quadrant-wise count rates Data is divided into 100 sec bins |
 |
|
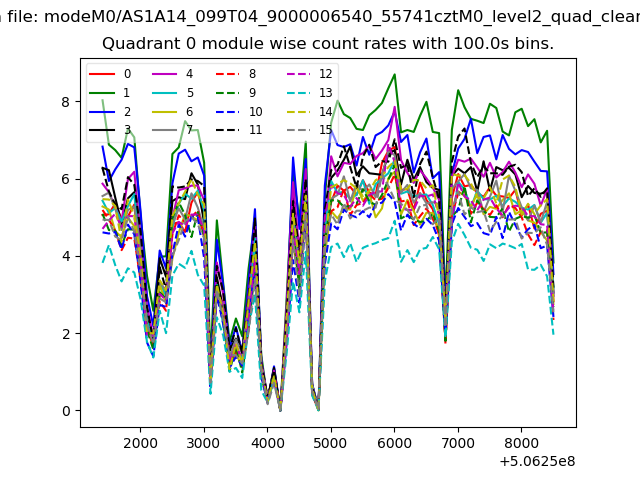
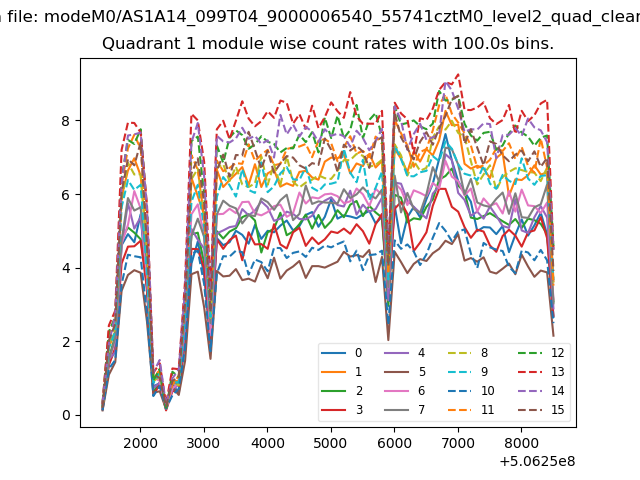
| Module-wise count rates for Quadrant A Data is divided into 100 sec bins |
 |
 |
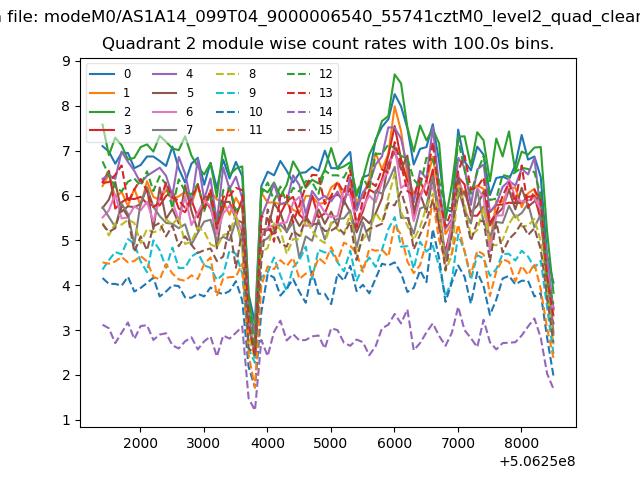
| Module-wise count rates for Quadrant B Data is divided into 100 sec bins |
 |
 |
| Module-wise count rates for Quadrant C Data is divided into 100 sec bins |
 |
 |
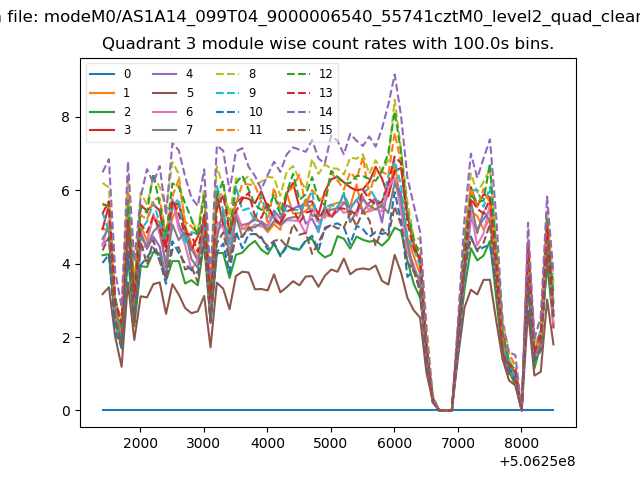
| Module-wise count rates for Quadrant D Data is divided into 100 sec bins |
 |
 |
| Parameter | Plot |
|---|---|
| CZT HV Monitor | 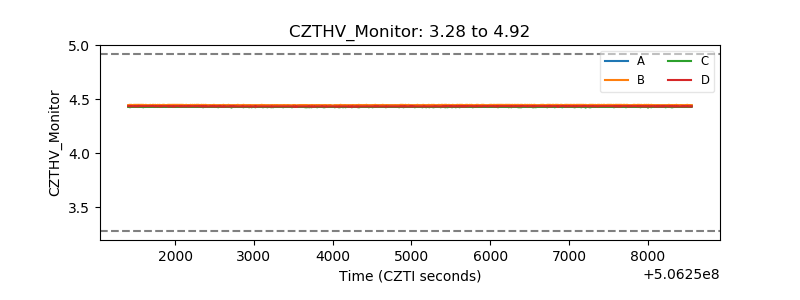 |
| D_VDD | 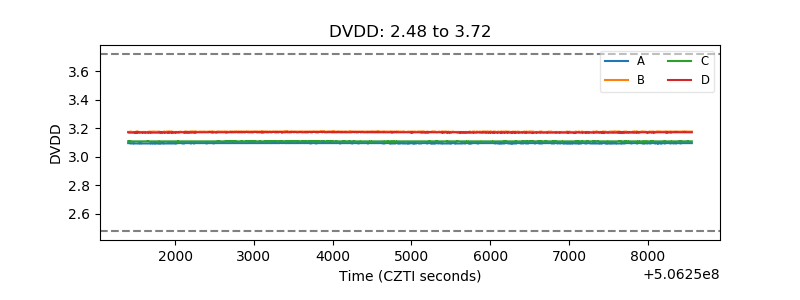 |
| Temperature 1 | 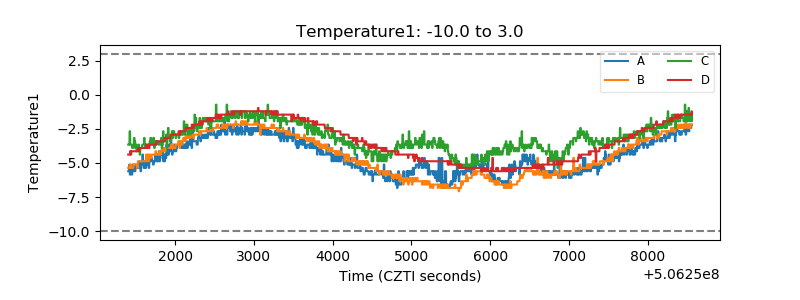 |
| Veto HV Monitor |  |
| Veto LLD | 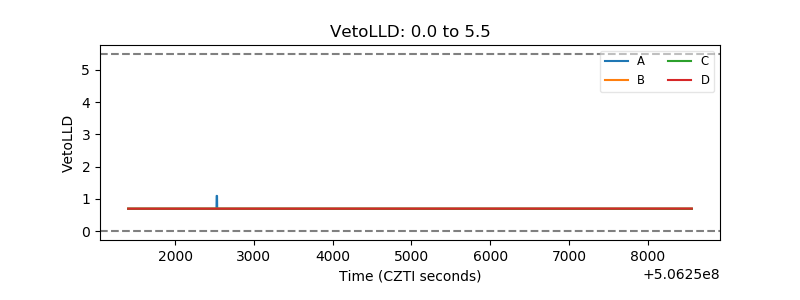 |
| Alpha Counter | 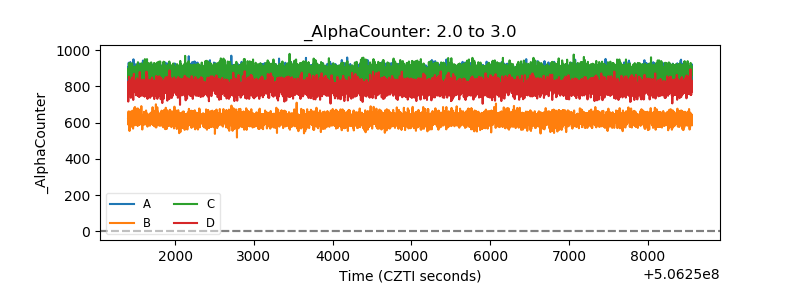 |
| _CPM_Rate | 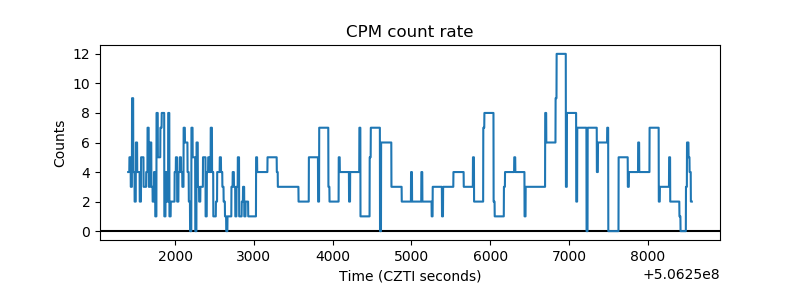 |
| CZT Counter | 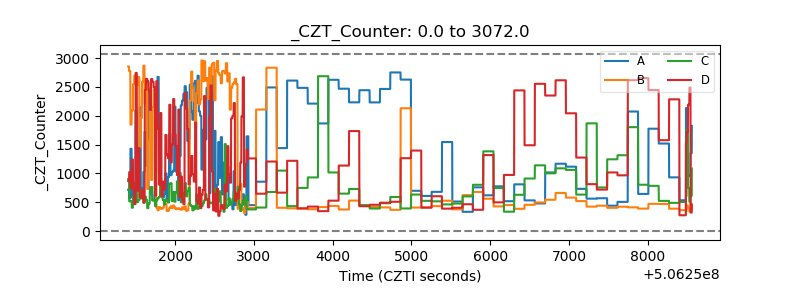 |
| +2.5 Volts monitor |  |
| +5 Volts monitor |  |
| _ROLL_ROT | 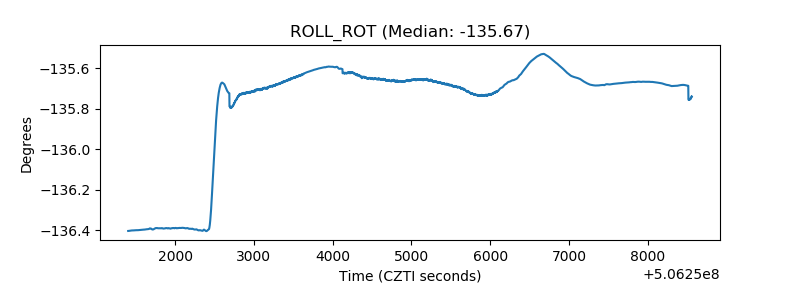 |
| _Roll_DEC | 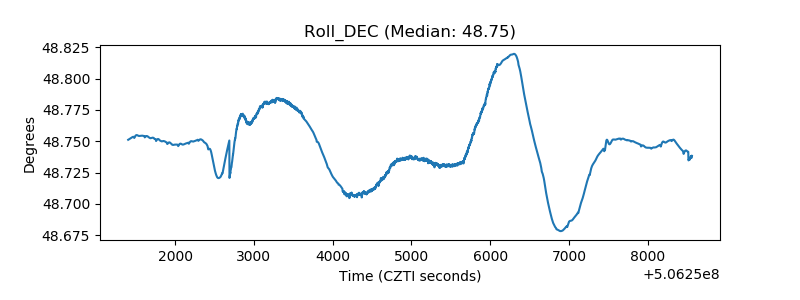 |
| _Roll_RA | 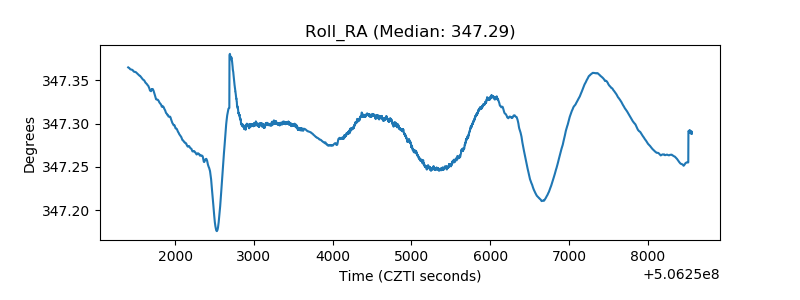 |
| Veto Counter | 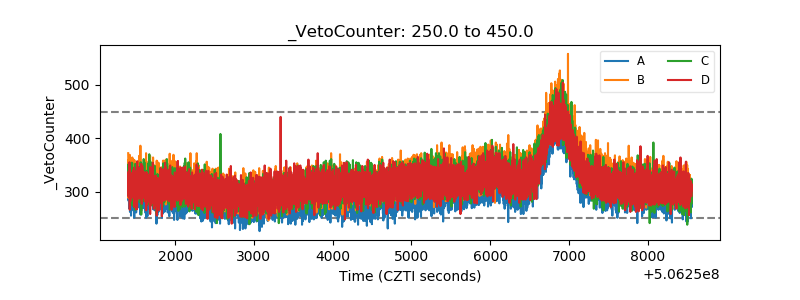 |