| Param | Original file | Final file |
|---|---|---|
| Filename | modeM0/AS1A14_099T04_9000006540_55742cztM0_level2.fits | modeM0/AS1A14_099T04_9000006540_55742cztM0_level2_quad_clean.evt |
| Size (bytes) | 721,739,520 | 99,066,240 |
| Size | 688.3 MB | 94.5 MB |
| Events in quadrant A | 9,196,804 | 563,000 |
| Events in quadrant B | 3,153,310 | 746,943 |
| Events in quadrant C | 7,766,354 | 593,335 |
| Events in quadrant D | 6,017,963 | 573,378 |
| Mode M0 | |||
|---|---|---|---|
| Quadrant | BADHDUFLAG | Total packets | Discarded packets |
| A | 0 | 32411 | 4 |
| B | 0 | 15292 | 0 |
| C | 0 | 28172 | 0 |
| D | 0 | 23220 | 0 |
| Mode SS | |||
|---|---|---|---|
| Quadrant | BADHDUFLAG | Total packets | Discarded packets |
| A | 0 | 150 | 0 |
| B | 0 | 150 | 0 |
| C | 0 | 150 | 0 |
| D | 0 | 150 | 0 |
| Quadrant | Total seconds | Saturated seconds | Saturation percentage |
|---|---|---|---|
| A | 7512 | 1651 | 21.978168% |
| B | 7513 | 11 | 0.146413% |
| C | 7513 | 1051 | 13.989086% |
| D | 7513 | 748 | 9.956076% |
Noise dominated data is calculated using 1-second bins in cleaned event files. If a bin has >2000 counts, and if more than 50% of those come from <1% of pixels, then it is considered to be noise-dominated and hence unusable.
| Quadrant | # 1 sec bins | Bins with >0 counts | Bins with >2000 counts | High rate bins dominated by noise | Noise dominated (total time) | Noise dominated (detector-on time) | Marked lightcurve |
|---|---|---|---|---|---|---|---|
| A | 7512 | 7512 | 1361 | 1361 | 18.12% | 18.12% | 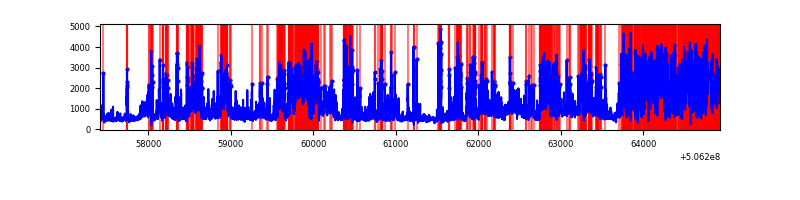 |
| B | 7513 | 7513 | 2 | 2 | 0.03% | 0.03% | 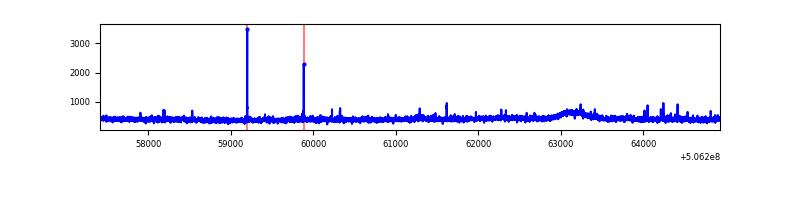 |
| C | 7513 | 7513 | 910 | 910 | 12.11% | 12.11% | 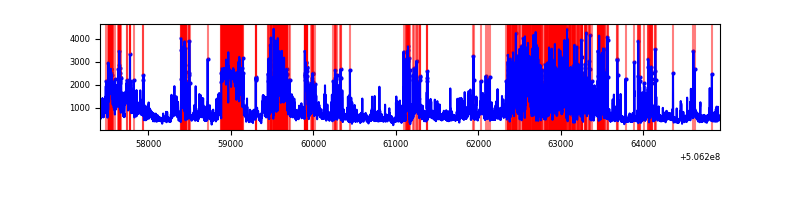 |
| D | 7513 | 7513 | 726 | 726 | 9.66% | 9.66% | 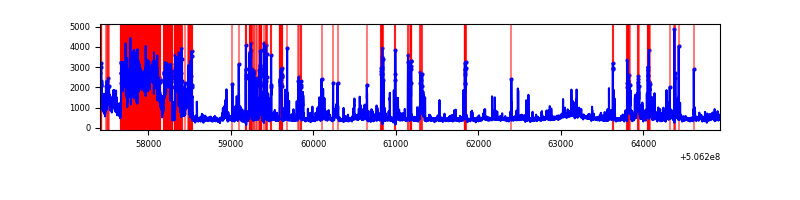 |
Top three noisy pixels from each quadrant. If the there are fewer than three noisy pixels in the level2.evt file, extra rows are filled as -1
| Pixel properties | Quadrant properties | ||||||
|---|---|---|---|---|---|---|---|
| Quadrant | DetID | PixID | Counts | Sigma | Mean | Median | Sigma |
| A | 15 | 32 | 5088471 | 29043.86 | 709 | 693 | 175.2 |
| A | 8 | 249 | 500683 | 2854.22 | 709 | 693 | 175.2 |
| A | 0 | 8 | 282733 | 1610.04 | 709 | 693 | 175.2 |
| B | 4 | 206 | 34523 | 201.75 | 775 | 746 | 167.4 |
| B | 12 | 111 | 20553 | 118.3 | 775 | 746 | 167.4 |
| B | 11 | 111 | 19252 | 110.53 | 775 | 746 | 167.4 |
| C | 15 | 199 | 1775933 | 9080.21 | 709 | 702 | 195.5 |
| C | 9 | 38 | 1348724 | 6895.06 | 709 | 702 | 195.5 |
| C | 15 | 164 | 1034593 | 5288.3 | 709 | 702 | 195.5 |
| D | 11 | 129 | 2496728 | 12123.7 | 731 | 698 | 205.9 |
| D | 6 | 42 | 189302 | 916.09 | 731 | 698 | 205.9 |
| D | 8 | 245 | 134175 | 648.32 | 731 | 698 | 205.9 |
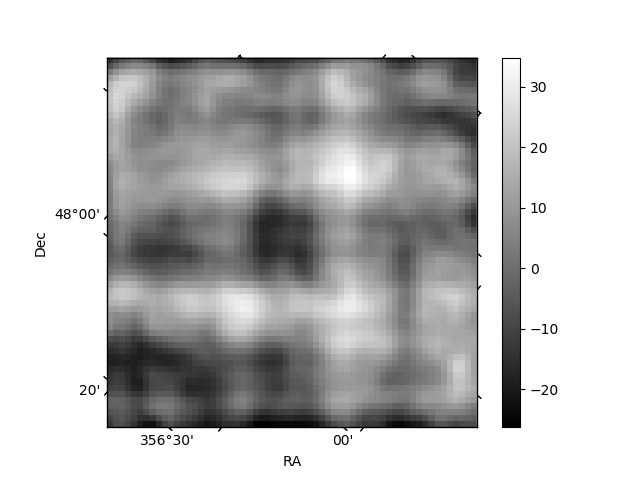
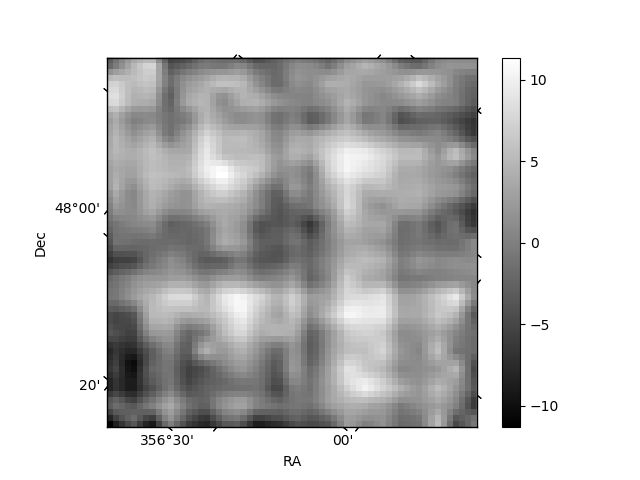
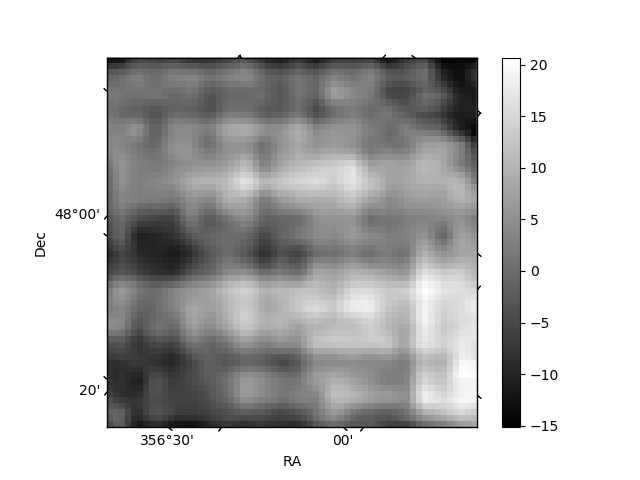
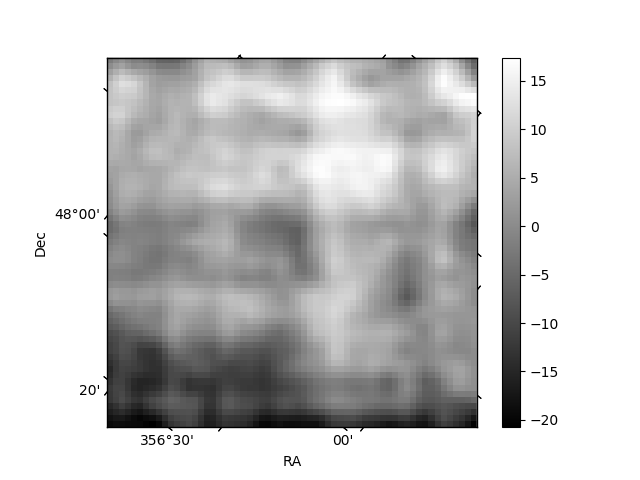
Histogram calculated using DETX and DETY for each event in the final _common_clean file
| Quadrant A | 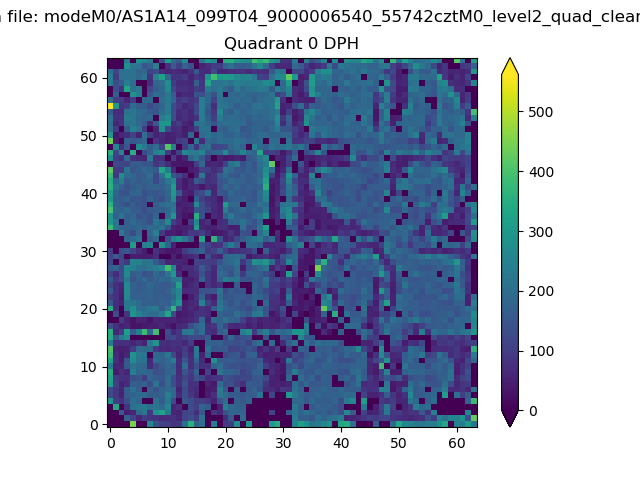 |
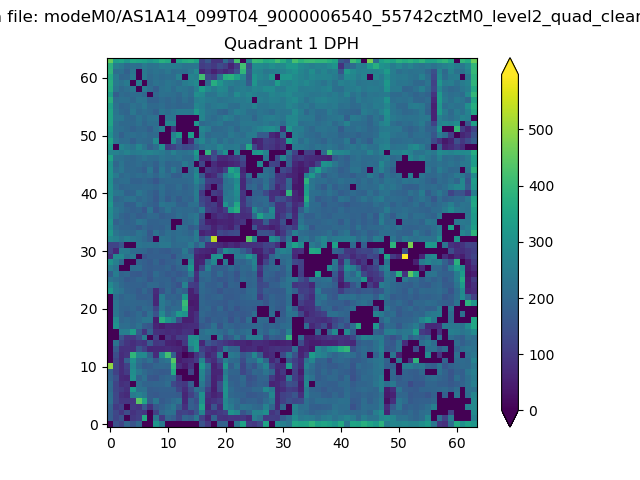 |
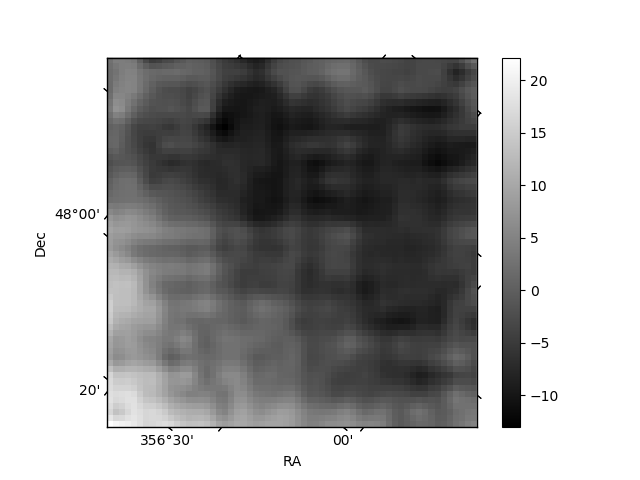
Quadrant B |
|---|---|---|---|
| Quadrant D | 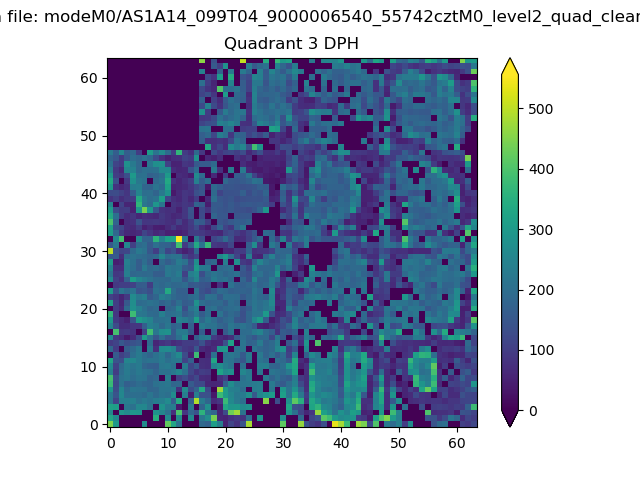 |
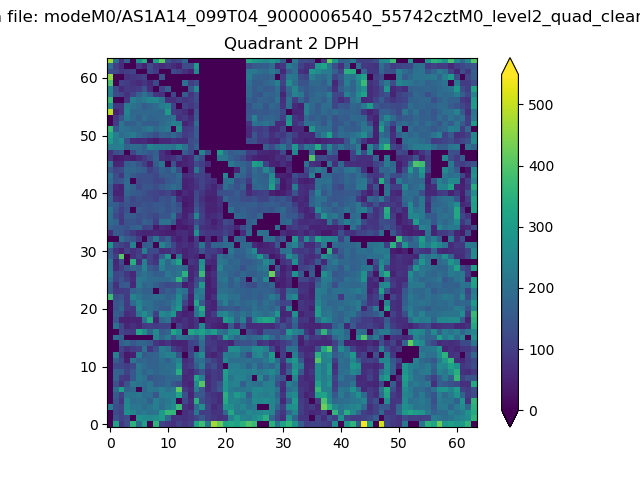 |
Quadrant C |
| Plot type | Count rate plots | Images |
|---|---|---|
| Comparison with Poisson distribution Blue bars denote a histogram of data divided into 1 sec bins. Red curve is a Poisson curve with rate = median count rate of data. |
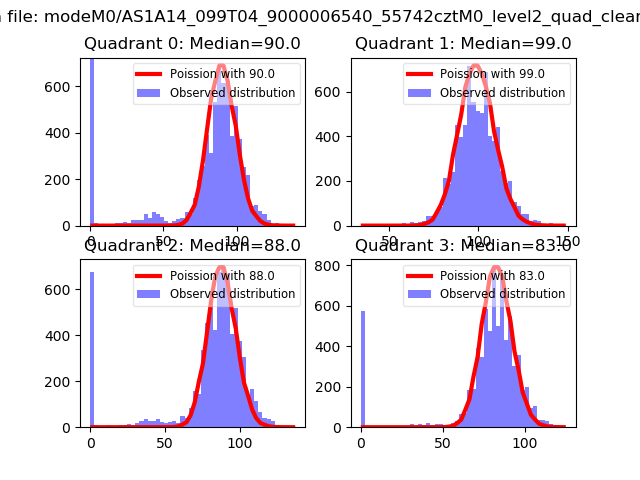 |
 |
| Quadrant-wise count rates Data is divided into 100 sec bins |
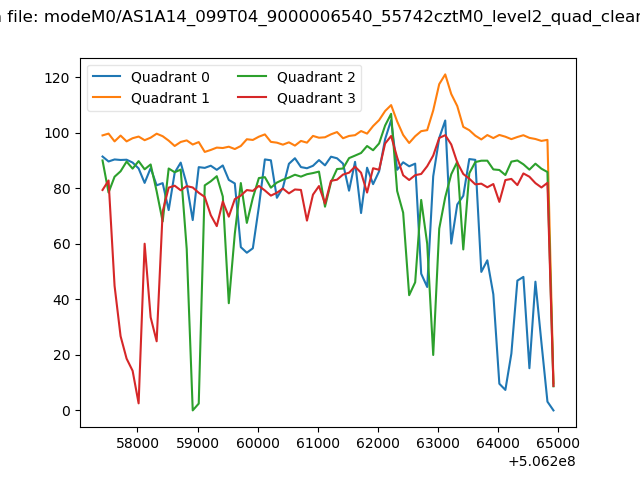 |
|
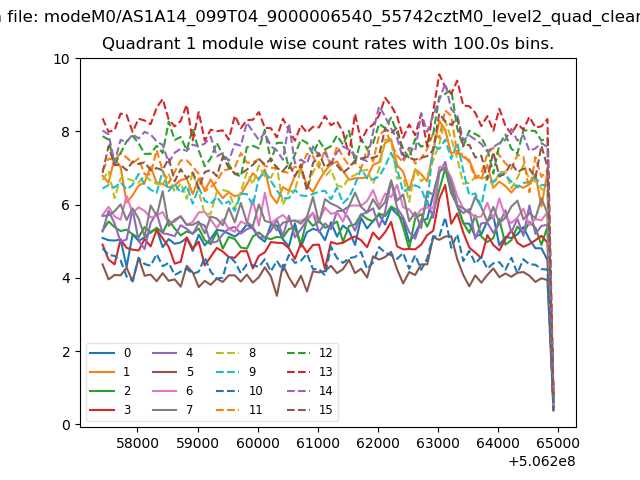
| Module-wise count rates for Quadrant A Data is divided into 100 sec bins |
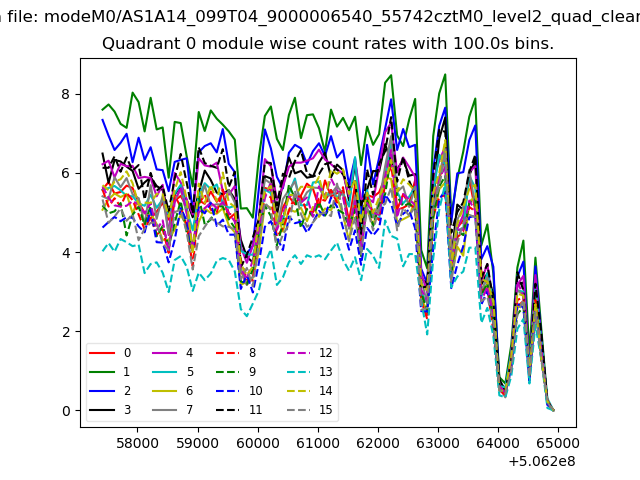 |
 |
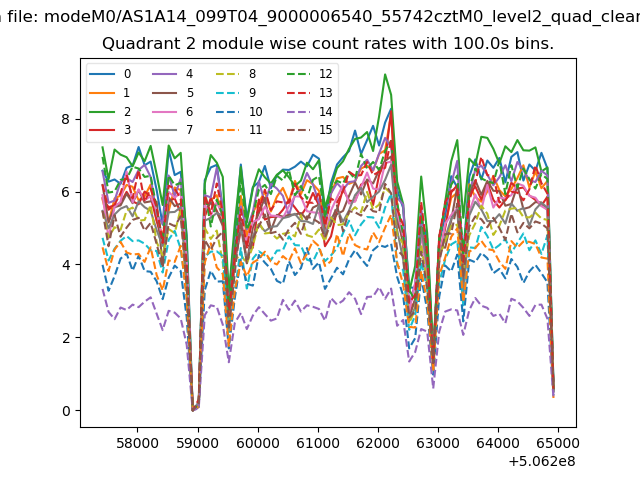
| Module-wise count rates for Quadrant B Data is divided into 100 sec bins |
 |
 |
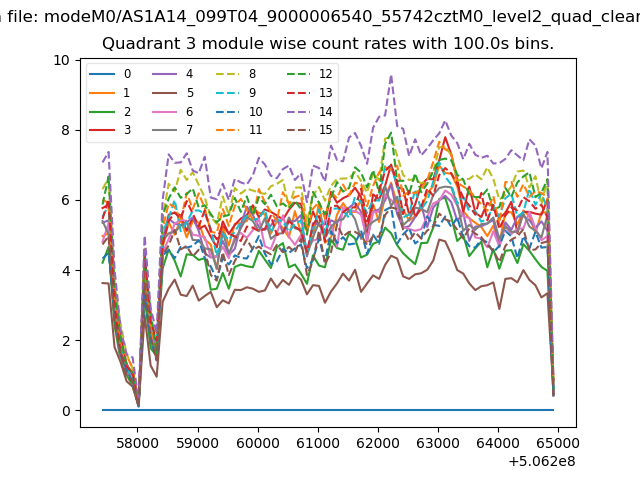
| Module-wise count rates for Quadrant C Data is divided into 100 sec bins |
 |
 |
| Module-wise count rates for Quadrant D Data is divided into 100 sec bins |
 |
 |
| Parameter | Plot |
|---|---|
| CZT HV Monitor |  |
| D_VDD | 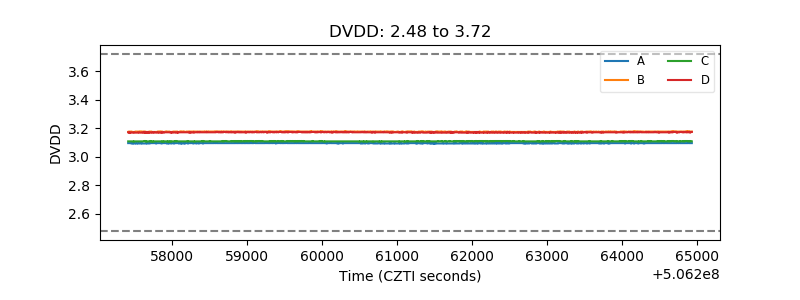 |
| Temperature 1 | 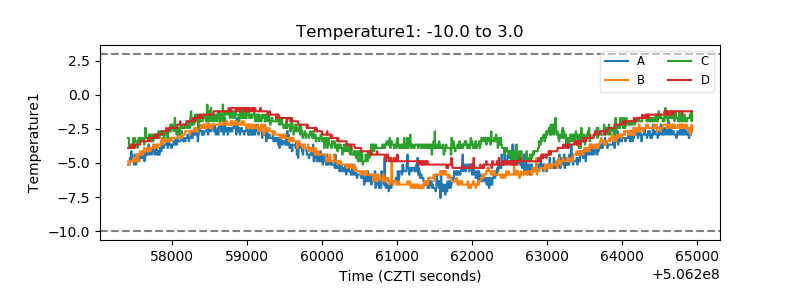 |
| Veto HV Monitor | 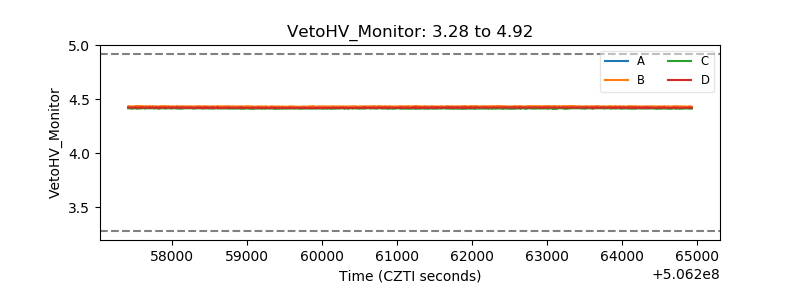 |
| Veto LLD | 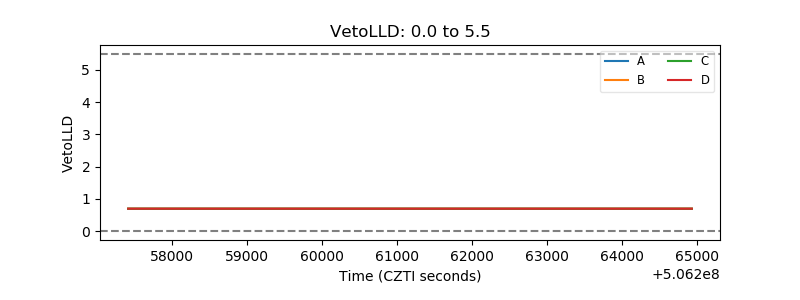 |
| Alpha Counter | 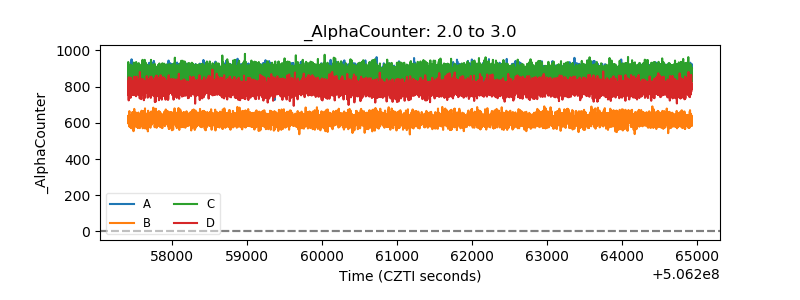 |
| _CPM_Rate | 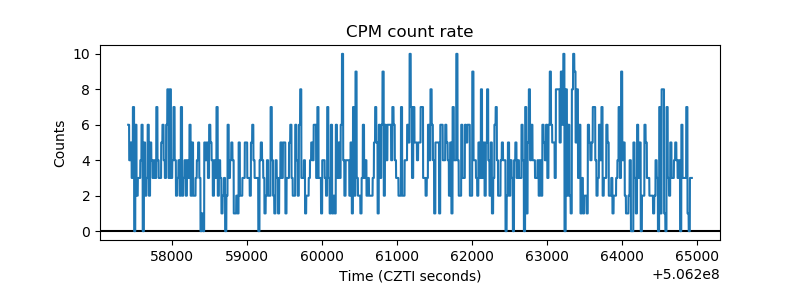 |
| CZT Counter | 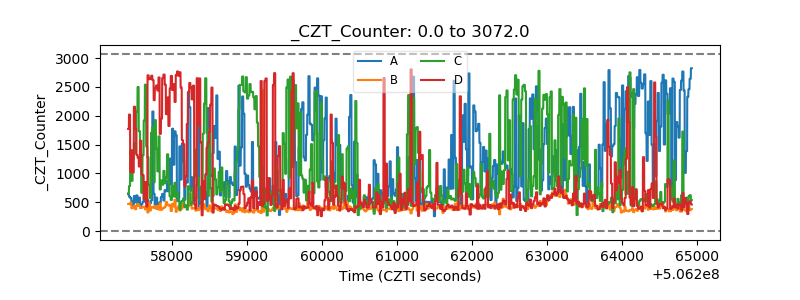 |
| +2.5 Volts monitor |  |
| +5 Volts monitor |  |
| _ROLL_ROT | 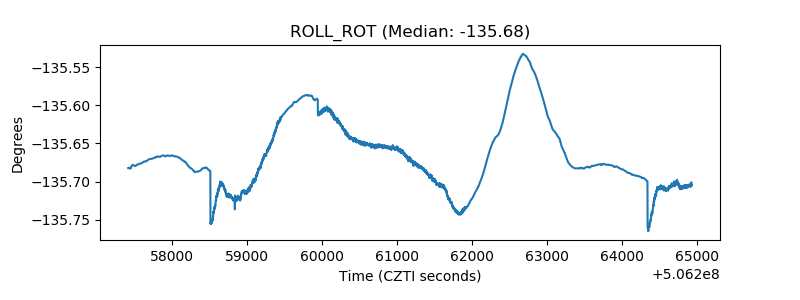 |
| _Roll_DEC | 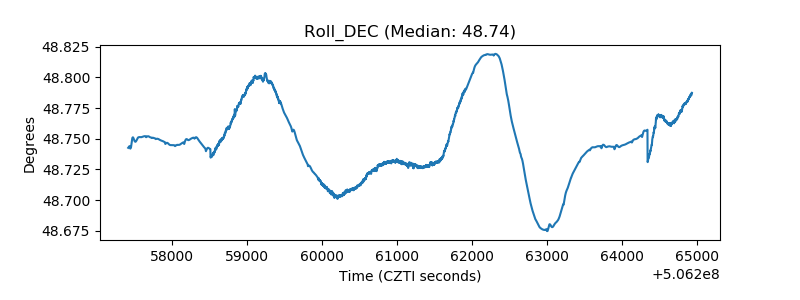 |
| _Roll_RA | 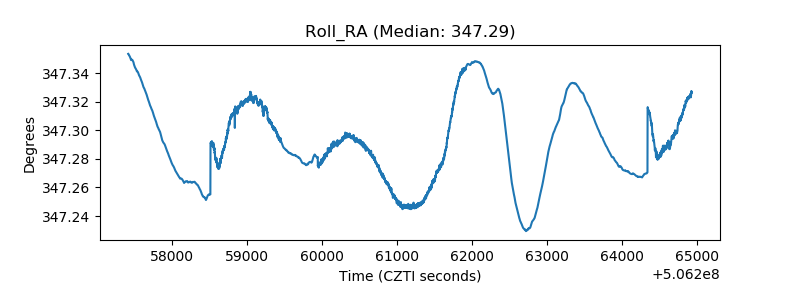 |
| Veto Counter | 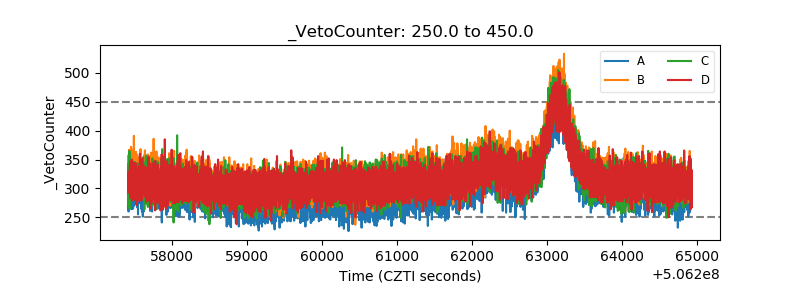 |