| Param | Original file | Final file |
|---|---|---|
| Filename | modeM0/AS1A14_099T04_9000006540_55745cztM0_level2.fits | modeM0/AS1A14_099T04_9000006540_55745cztM0_level2_quad_clean.evt |
| Size (bytes) | 1,981,313,280 | 232,053,120 |
| Size | 1.8 GB | 221.3 MB |
| Events in quadrant A | 31,507,953 | 933,939 |
| Events in quadrant B | 10,337,885 | 1,847,754 |
| Events in quadrant C | 15,126,248 | 1,498,437 |
| Events in quadrant D | 14,919,866 | 1,450,651 |
| Mode M0 | |||
|---|---|---|---|
| Quadrant | BADHDUFLAG | Total packets | Discarded packets |
| A | 0 | 106458 | 12 |
| B | 0 | 44240 | 4 |
| C | 0 | 57603 | 4 |
| D | 0 | 57855 | 4 |
| Mode M9 | |||
|---|---|---|---|
| Quadrant | BADHDUFLAG | Total packets | Discarded packets |
| A | 0 | 12 | 0 |
| B | 0 | 12 | 0 |
| C | 0 | 12 | 0 |
| D | 0 | 12 | 0 |
| Mode SS | |||
|---|---|---|---|
| Quadrant | BADHDUFLAG | Total packets | Discarded packets |
| A | 0 | 382 | 0 |
| B | 0 | 382 | 0 |
| C | 0 | 382 | 0 |
| D | 0 | 382 | 0 |
| Quadrant | Total seconds | Saturated seconds | Saturation percentage |
|---|---|---|---|
| A | 18781 | 8988 | 47.856877% |
| B | 18782 | 275 | 1.464168% |
| C | 18782 | 1921 | 10.227878% |
| D | 18782 | 1526 | 8.124800% |
Noise dominated data is calculated using 1-second bins in cleaned event files. If a bin has >2000 counts, and if more than 50% of those come from <1% of pixels, then it is considered to be noise-dominated and hence unusable.
| Quadrant | # 1 sec bins | Bins with >0 counts | Bins with >2000 counts | High rate bins dominated by noise | Noise dominated (total time) | Noise dominated (detector-on time) | Marked lightcurve |
|---|---|---|---|---|---|---|---|
| A | 19926 | 18785 | 7685 | 7685 | 38.57% | 40.91% | 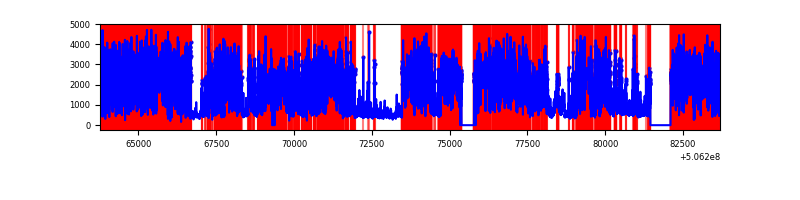 |
| B | 19927 | 18788 | 99 | 99 | 0.50% | 0.53% | 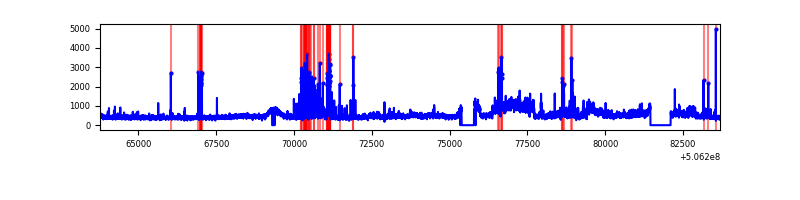 |
| C | 19927 | 18787 | 1116 | 1116 | 5.60% | 5.94% | 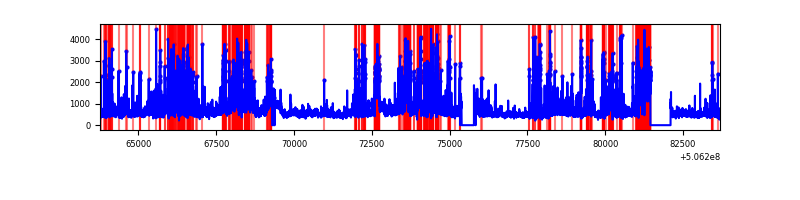 |
| D | 19927 | 18788 | 1404 | 1404 | 7.05% | 7.47% | 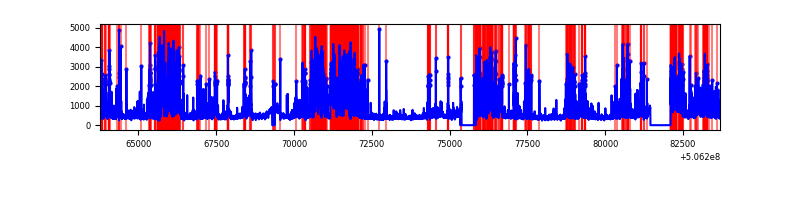 |
Top three noisy pixels from each quadrant. If the there are fewer than three noisy pixels in the level2.evt file, extra rows are filled as -1
| Pixel properties | Quadrant properties | ||||||
|---|---|---|---|---|---|---|---|
| Quadrant | DetID | PixID | Counts | Sigma | Mean | Median | Sigma |
| A | 15 | 32 | 20625570 | 56578.48 | 1479 | 1446 | 364.5 |
| A | 12 | 115 | 1978135 | 5422.68 | 1479 | 1446 | 364.5 |
| A | 8 | 249 | 1171114 | 3208.77 | 1479 | 1446 | 364.5 |
| B | 4 | 206 | 1464156 | 3466.69 | 1953 | 1875 | 421.8 |
| B | 7 | 0 | 999997 | 2366.29 | 1953 | 1875 | 421.8 |
| B | 4 | 169 | 66009 | 152.04 | 1953 | 1875 | 421.8 |
| C | 15 | 199 | 2716507 | 5466.81 | 1816 | 1795 | 496.6 |
| C | 9 | 38 | 2525733 | 5082.64 | 1816 | 1795 | 496.6 |
| C | 15 | 164 | 1129394 | 2270.73 | 1816 | 1795 | 496.6 |
| D | 11 | 129 | 6338878 | 12098.74 | 1872 | 1794 | 523.8 |
| D | 2 | 31 | 296532 | 562.71 | 1872 | 1794 | 523.8 |
| D | 8 | 245 | 242891 | 460.3 | 1872 | 1794 | 523.8 |
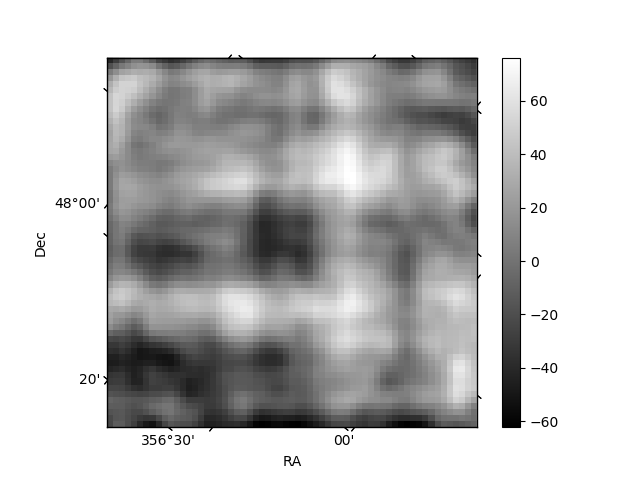
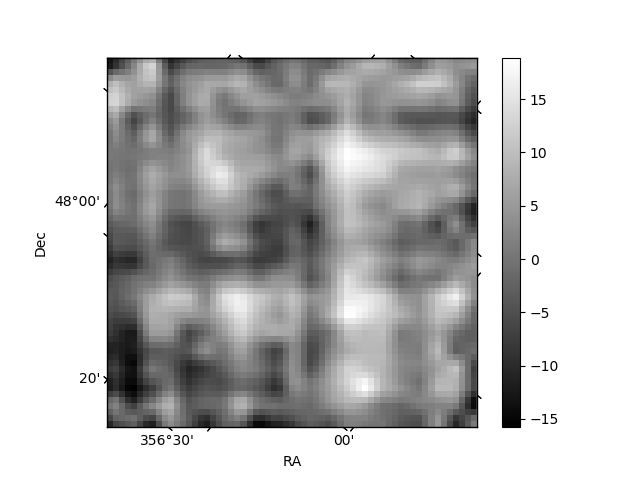
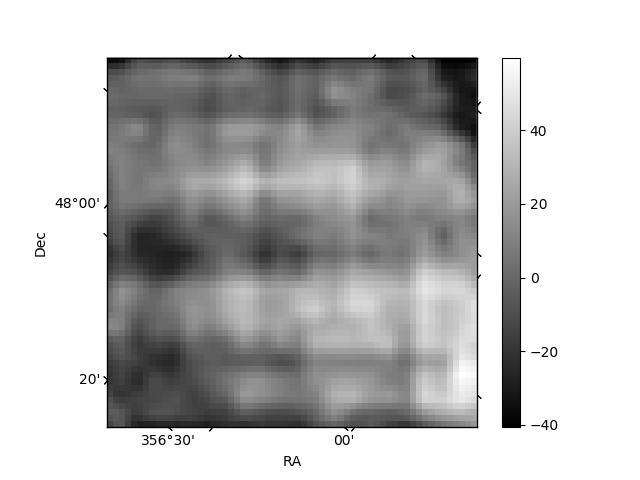
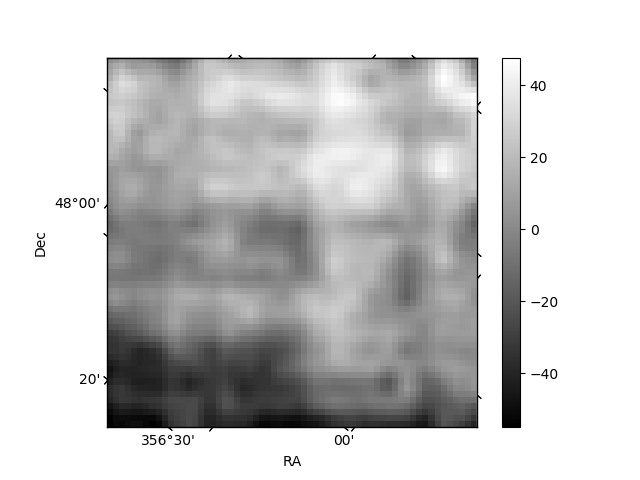
Histogram calculated using DETX and DETY for each event in the final _common_clean file
| Quadrant A | 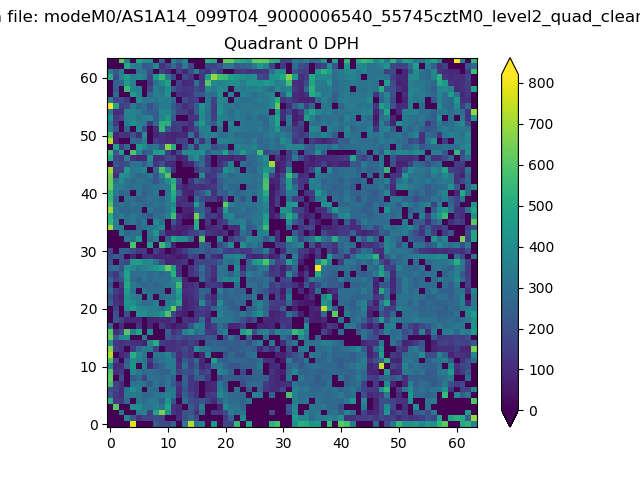 |
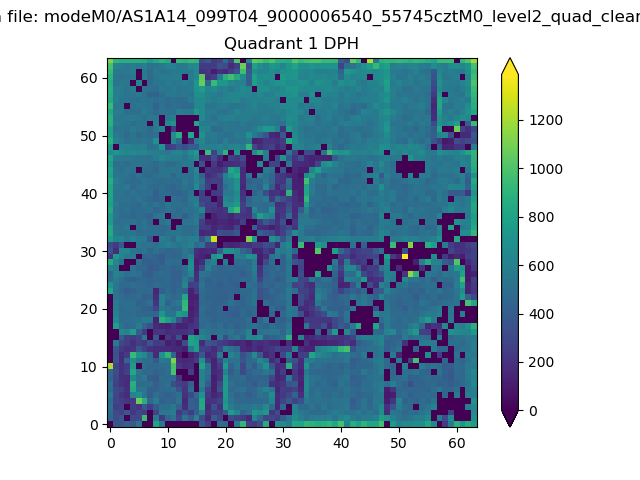 |
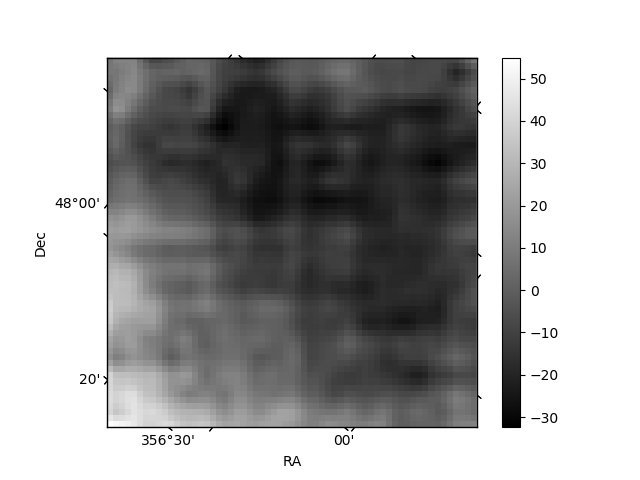
Quadrant B |
|---|---|---|---|
| Quadrant D | 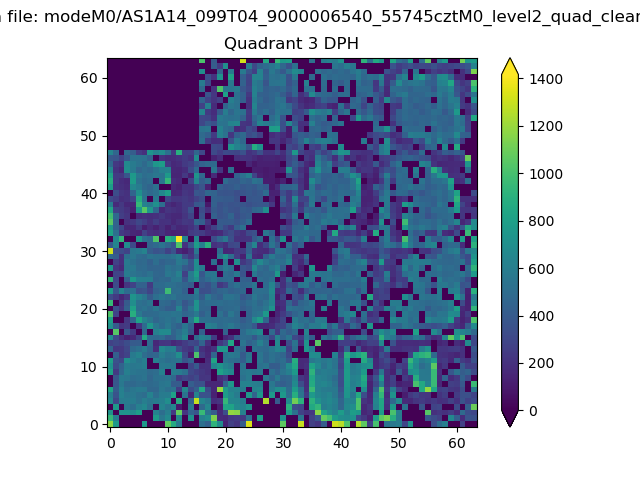 |
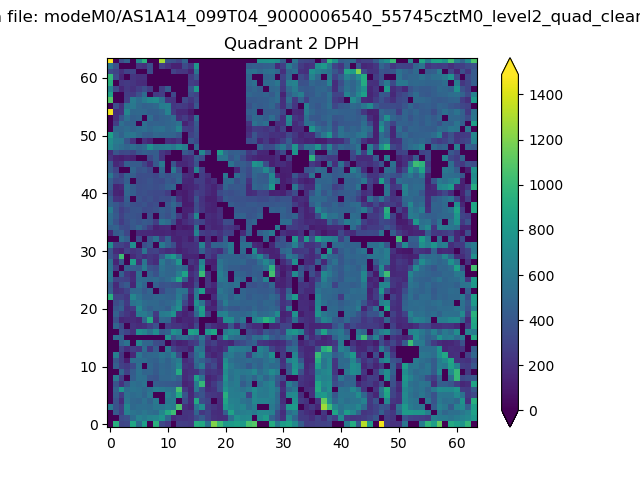 |
Quadrant C |
| Plot type | Count rate plots | Images |
|---|---|---|
| Comparison with Poisson distribution Blue bars denote a histogram of data divided into 1 sec bins. Red curve is a Poisson curve with rate = median count rate of data. |
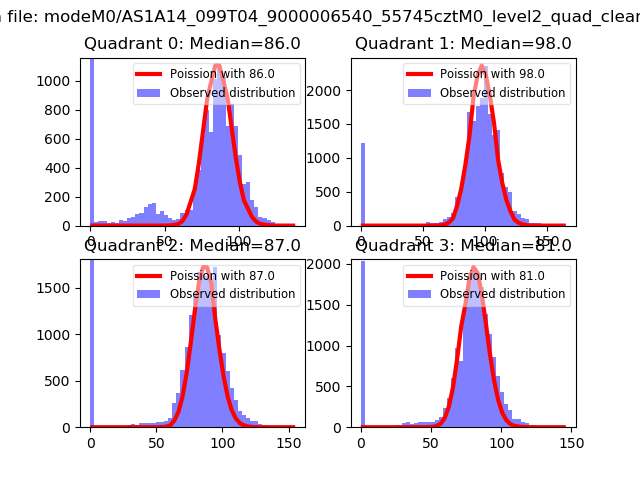 |
 |
| Quadrant-wise count rates Data is divided into 100 sec bins |
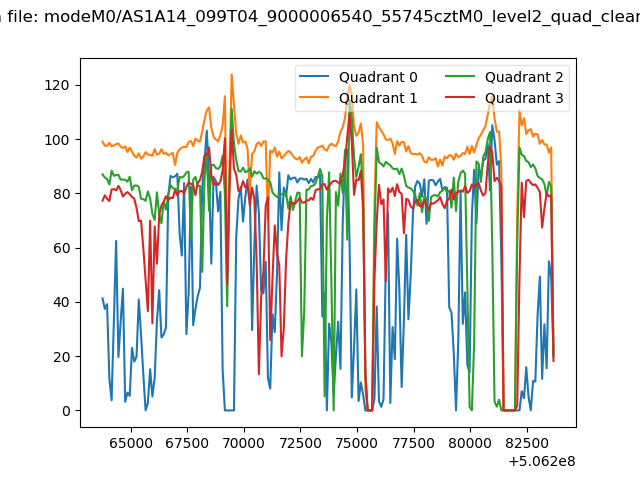 |
|
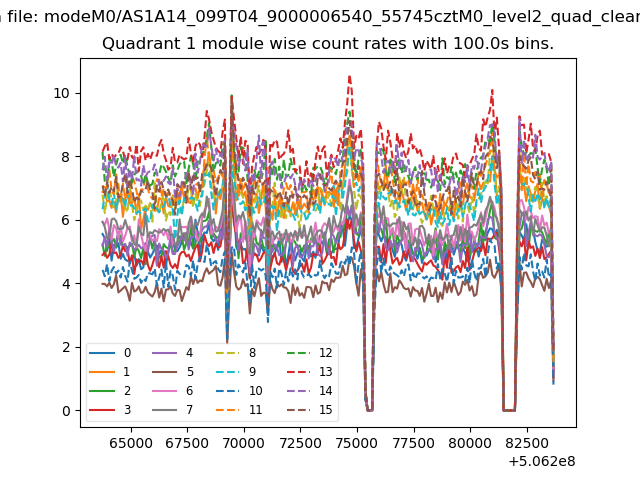
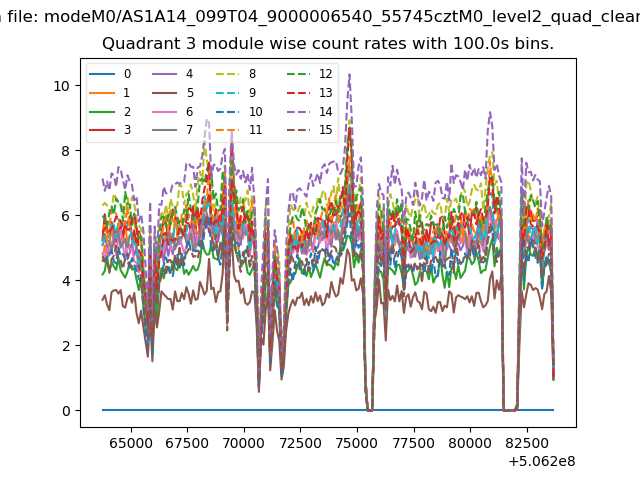
| Module-wise count rates for Quadrant A Data is divided into 100 sec bins |
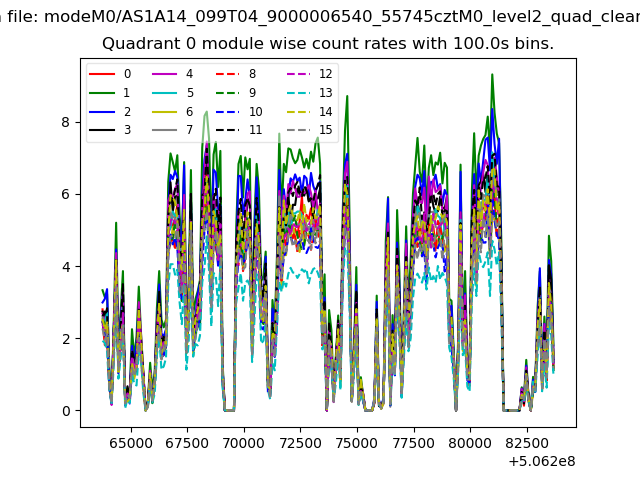 |
 |
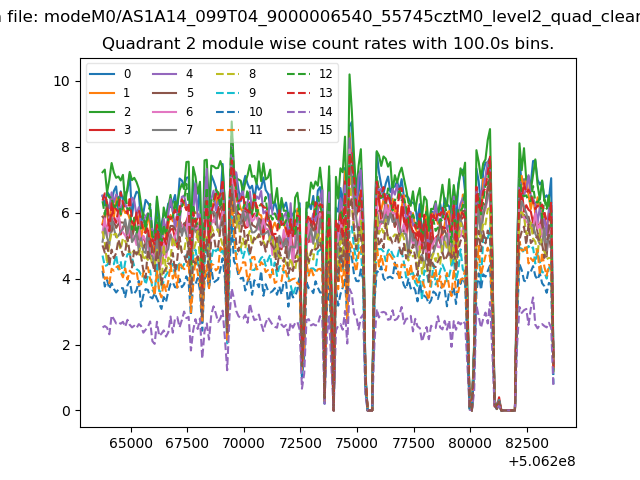
| Module-wise count rates for Quadrant B Data is divided into 100 sec bins |
 |
 |
| Module-wise count rates for Quadrant C Data is divided into 100 sec bins |
 |
 |
| Module-wise count rates for Quadrant D Data is divided into 100 sec bins |
 |
 |
| Parameter | Plot |
|---|---|
| CZT HV Monitor |  |
| D_VDD | 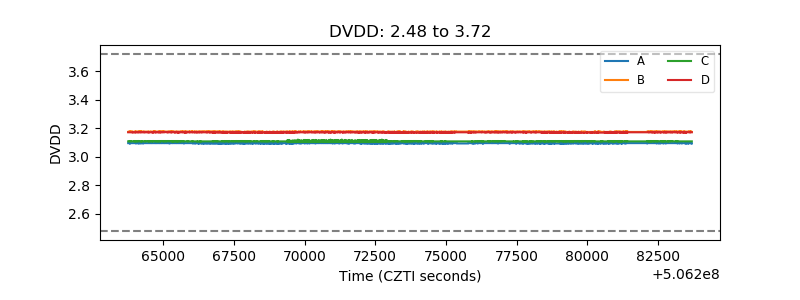 |
| Temperature 1 | 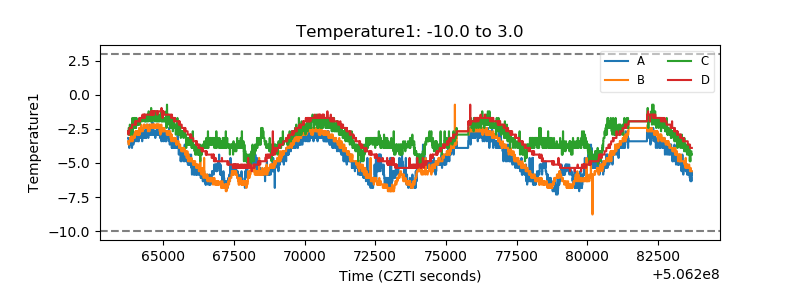 |
| Veto HV Monitor | 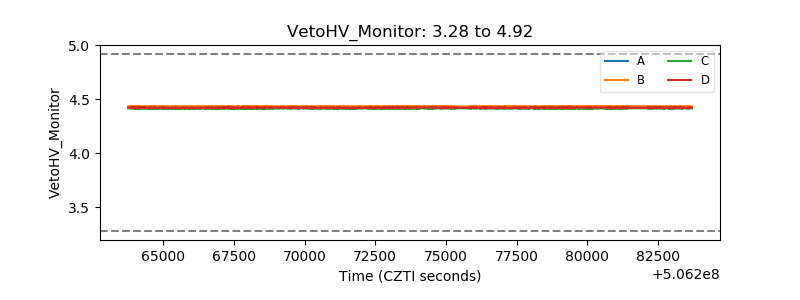 |
| Veto LLD | 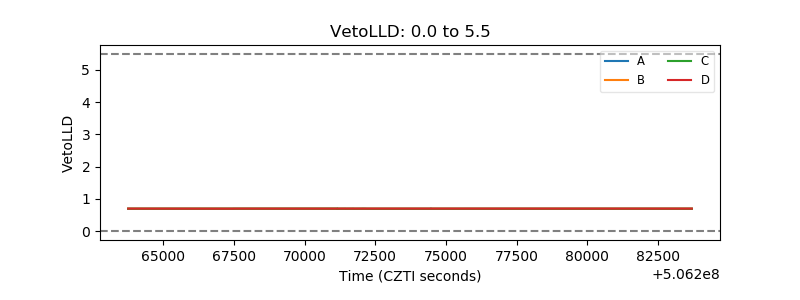 |
| Alpha Counter | 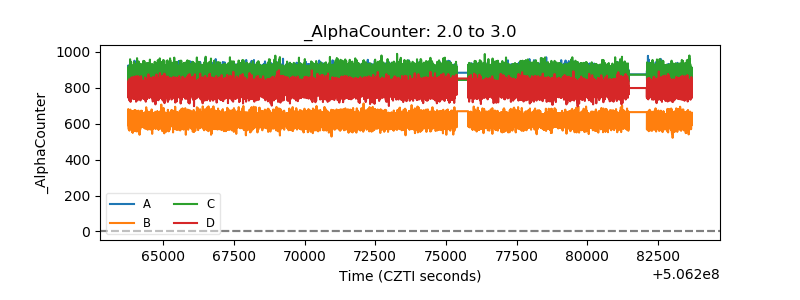 |
| _CPM_Rate | 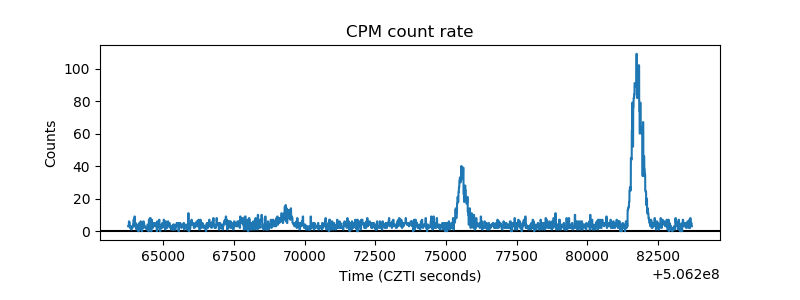 |
| CZT Counter | 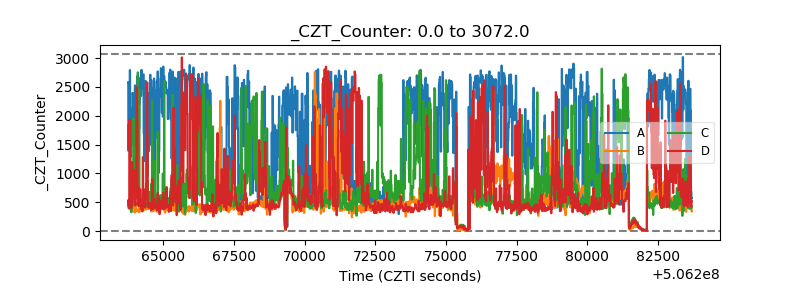 |
| +2.5 Volts monitor |  |
| +5 Volts monitor |  |
| _ROLL_ROT | 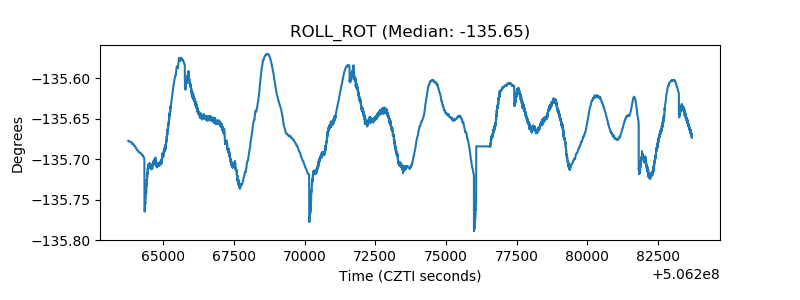 |
| _Roll_DEC | 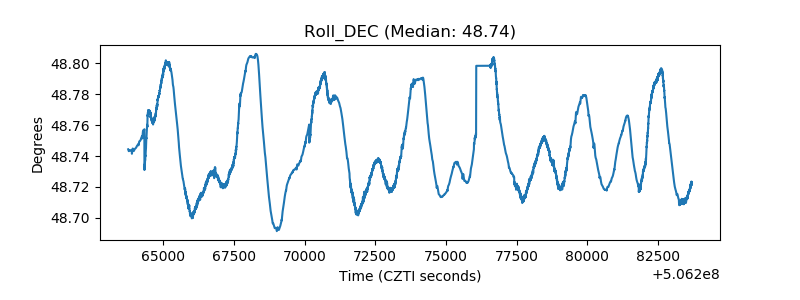 |
| _Roll_RA | 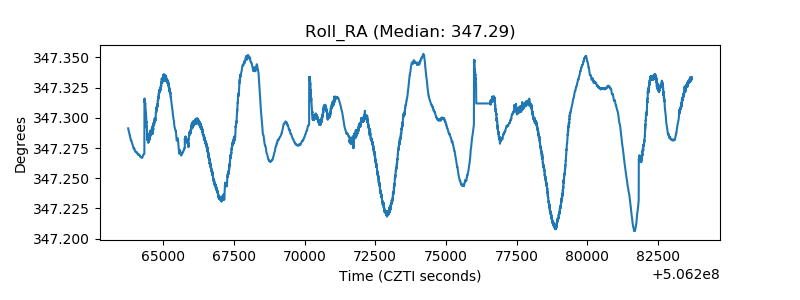 |
| Veto Counter | 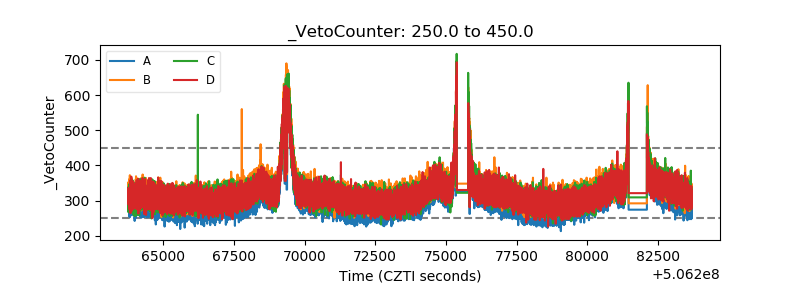 |