| Param | Original file | Final file |
|---|---|---|
| Filename | modeM0/AS1A14_099T04_9000006540_55746cztM0_level2.fits | modeM0/AS1A14_099T04_9000006540_55746cztM0_level2_quad_clean.evt |
| Size (bytes) | 635,431,680 | 87,589,440 |
| Size | 606.0 MB | 83.5 MB |
| Events in quadrant A | 8,042,844 | 449,819 |
| Events in quadrant B | 2,885,676 | 686,392 |
| Events in quadrant C | 6,728,138 | 512,869 |
| Events in quadrant D | 5,373,060 | 560,789 |
| Mode M0 | |||
|---|---|---|---|
| Quadrant | BADHDUFLAG | Total packets | Discarded packets |
| A | 0 | 28270 | 1 |
| B | 0 | 13391 | 1 |
| C | 0 | 24353 | 1 |
| D | 0 | 20351 | 1 |
| Mode M9 | |||
|---|---|---|---|
| Quadrant | BADHDUFLAG | Total packets | Discarded packets |
| A | 0 | 9 | 0 |
| B | 0 | 9 | 0 |
| C | 0 | 9 | 0 |
| D | 0 | 9 | 0 |
| Mode SS | |||
|---|---|---|---|
| Quadrant | BADHDUFLAG | Total packets | Discarded packets |
| A | 0 | 128 | 0 |
| B | 0 | 128 | 0 |
| C | 0 | 128 | 0 |
| D | 0 | 128 | 0 |
| Quadrant | Total seconds | Saturated seconds | Saturation percentage |
|---|---|---|---|
| A | 6339 | 1865 | 29.421044% |
| B | 6339 | 17 | 0.268181% |
| C | 6339 | 1276 | 20.129358% |
| D | 6339 | 468 | 7.382868% |
Noise dominated data is calculated using 1-second bins in cleaned event files. If a bin has >2000 counts, and if more than 50% of those come from <1% of pixels, then it is considered to be noise-dominated and hence unusable.
| Quadrant | # 1 sec bins | Bins with >0 counts | Bins with >2000 counts | High rate bins dominated by noise | Noise dominated (total time) | Noise dominated (detector-on time) | Marked lightcurve |
|---|---|---|---|---|---|---|---|
| A | 7184 | 6339 | 1548 | 1548 | 21.55% | 24.42% | 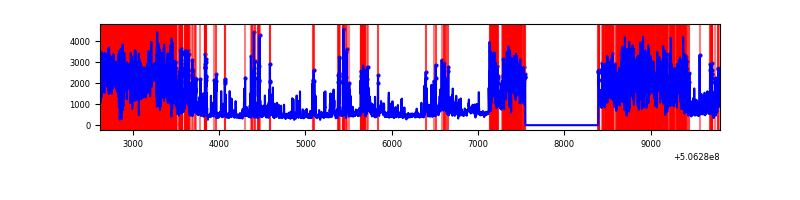 |
| B | 7184 | 6340 | 8 | 8 | 0.11% | 0.13% | 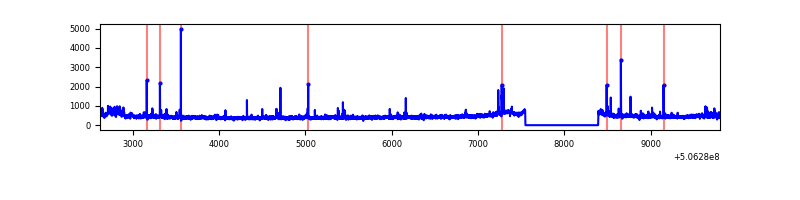 |
| C | 7184 | 6340 | 1091 | 1091 | 15.19% | 17.21% | 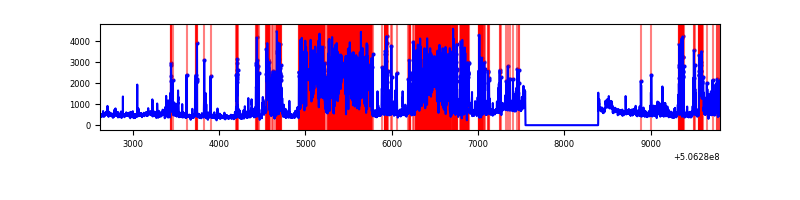 |
| D | 7184 | 6340 | 400 | 400 | 5.57% | 6.31% | 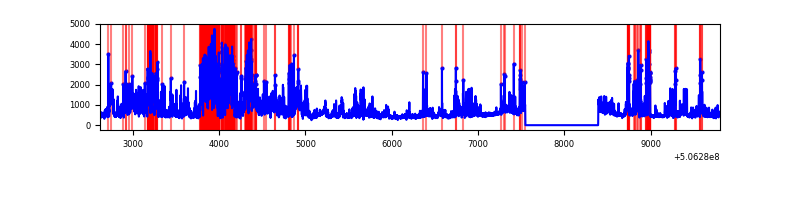 |
Top three noisy pixels from each quadrant. If the there are fewer than three noisy pixels in the level2.evt file, extra rows are filled as -1
| Pixel properties | Quadrant properties | ||||||
|---|---|---|---|---|---|---|---|
| Quadrant | DetID | PixID | Counts | Sigma | Mean | Median | Sigma |
| A | 15 | 32 | 4598325 | 30641.23 | 590 | 577 | 150.1 |
| A | 12 | 115 | 431265 | 2870.28 | 590 | 577 | 150.1 |
| A | 8 | 249 | 257863 | 1714.66 | 590 | 577 | 150.1 |
| B | 7 | 0 | 100391 | 681.05 | 672 | 650 | 146.5 |
| B | 10 | 247 | 58618 | 395.82 | 672 | 650 | 146.5 |
| B | 0 | 199 | 35122 | 235.38 | 672 | 650 | 146.5 |
| C | 15 | 199 | 3261555 | 19180.64 | 603 | 596 | 170.0 |
| C | 9 | 38 | 581953 | 3419.49 | 603 | 596 | 170.0 |
| C | 15 | 147 | 147255 | 862.63 | 603 | 596 | 170.0 |
| D | 11 | 129 | 2701458 | 14473.66 | 649 | 620 | 186.6 |
| D | 5 | 173 | 49498 | 261.93 | 649 | 620 | 186.6 |
| D | 7 | 129 | 27054 | 141.66 | 649 | 620 | 186.6 |
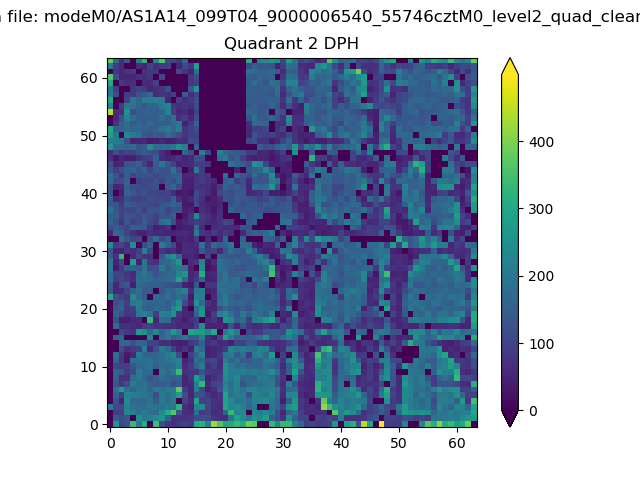
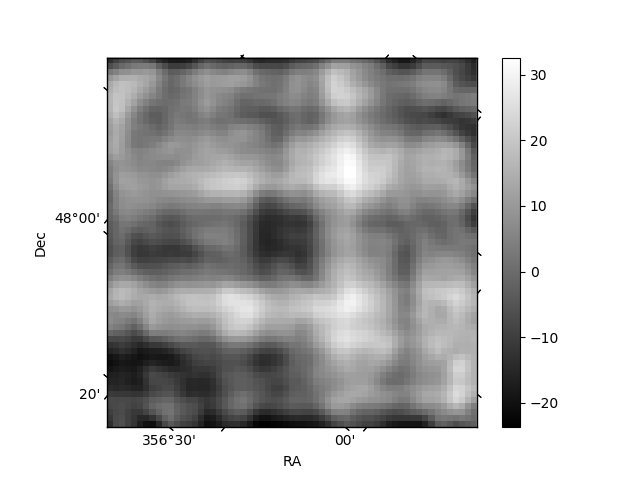
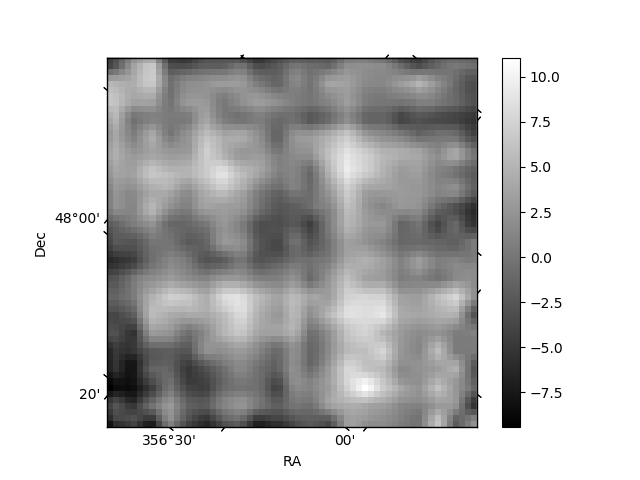
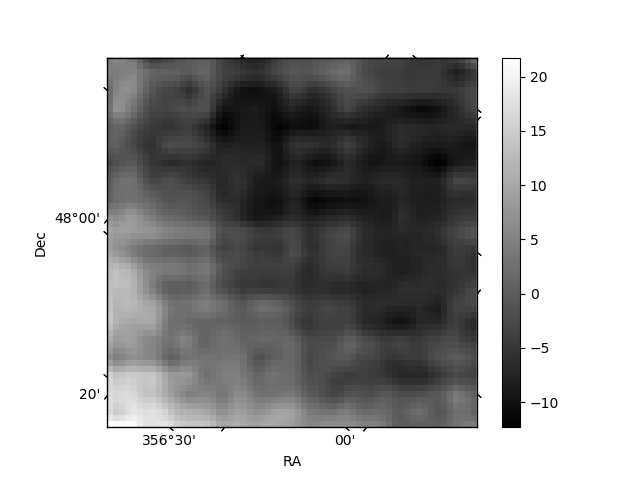
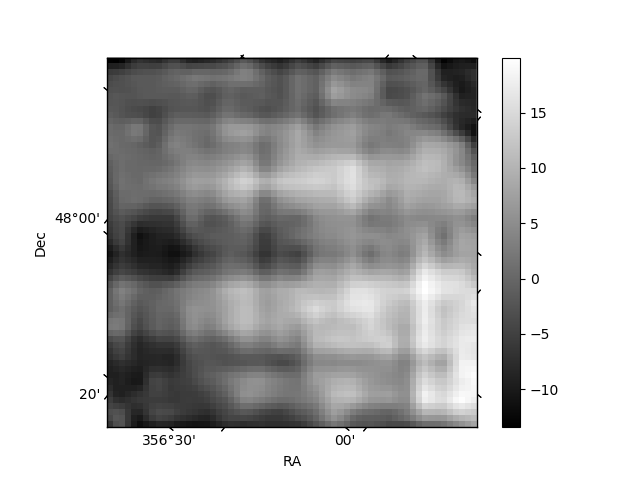
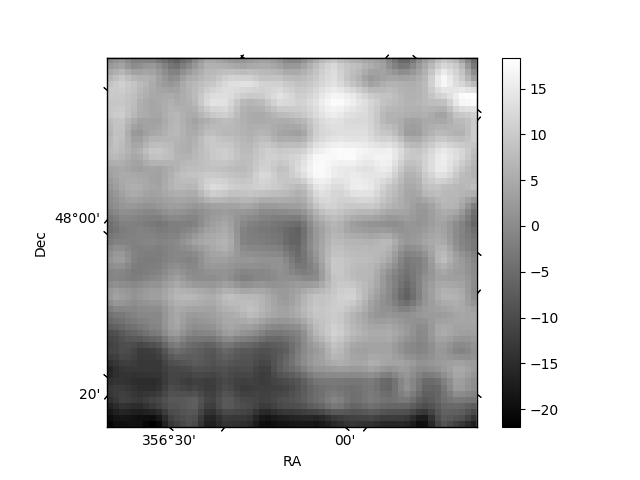
Histogram calculated using DETX and DETY for each event in the final _common_clean file
| Quadrant A | 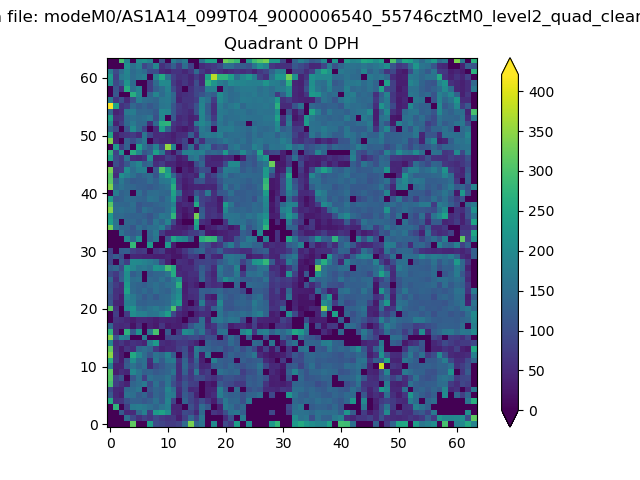 |
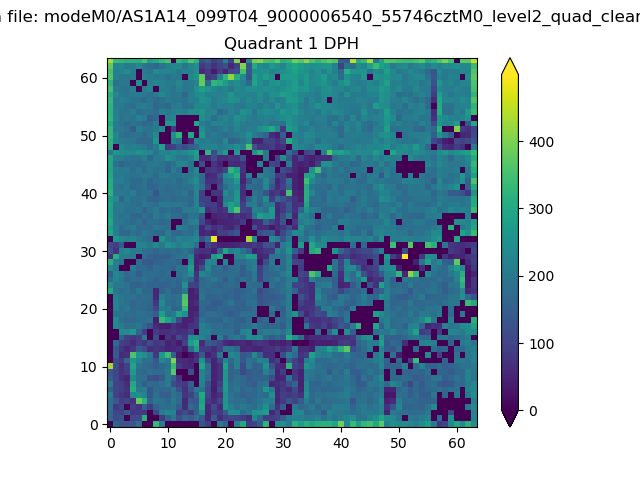 |
Quadrant B |
|---|---|---|---|
| Quadrant D | 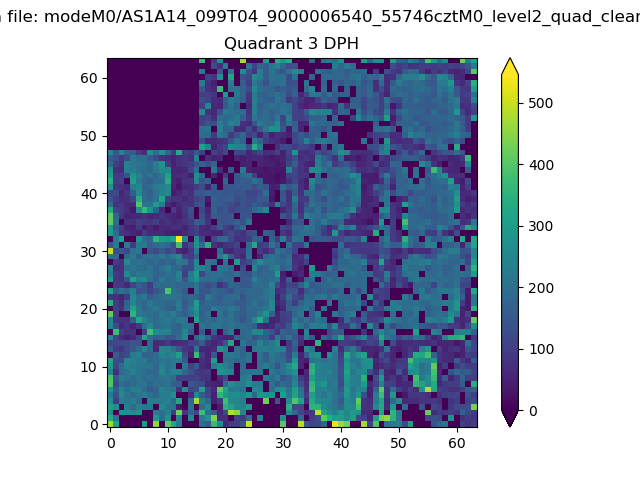 |
 |
Quadrant C |
| Plot type | Count rate plots | Images |
|---|---|---|
| Comparison with Poisson distribution Blue bars denote a histogram of data divided into 1 sec bins. Red curve is a Poisson curve with rate = median count rate of data. |
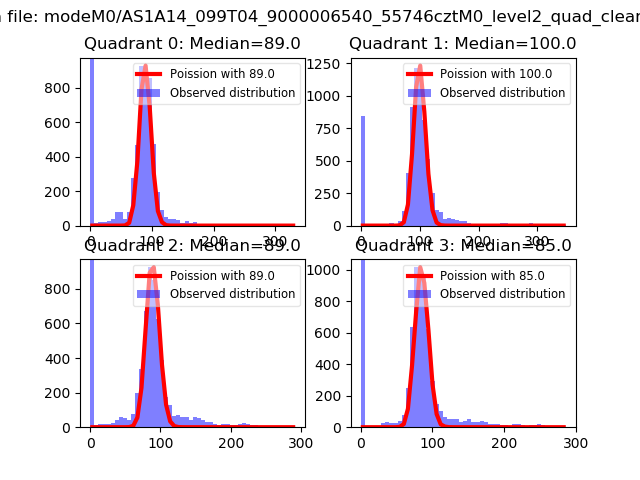 |
 |
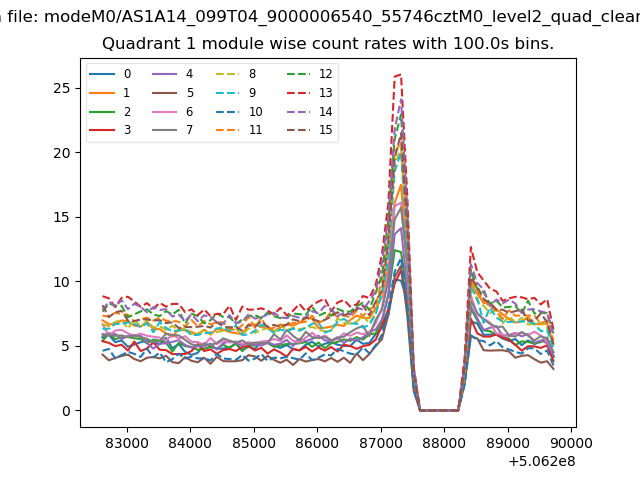
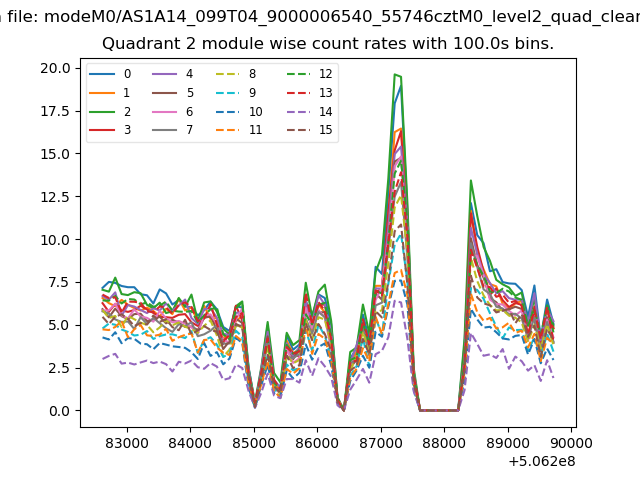
| Quadrant-wise count rates Data is divided into 100 sec bins |
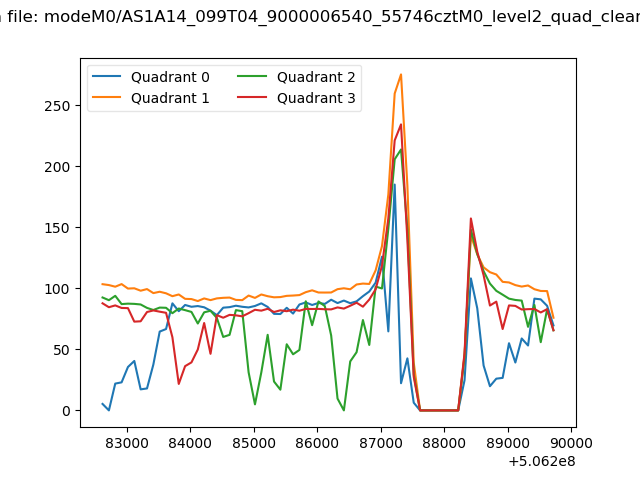 |
|
| Module-wise count rates for Quadrant A Data is divided into 100 sec bins |
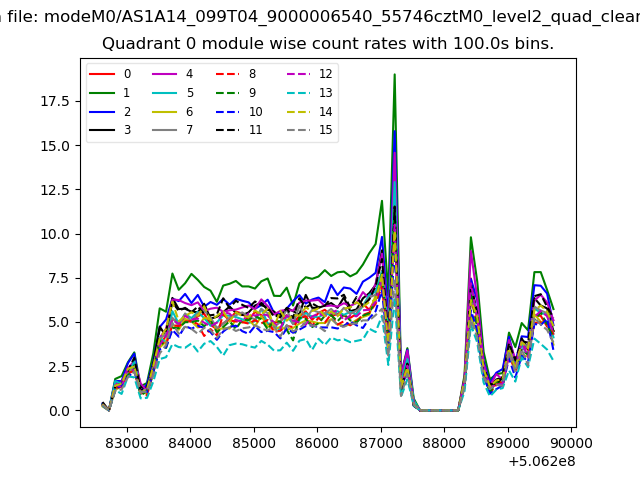 |
 |
| Module-wise count rates for Quadrant B Data is divided into 100 sec bins |
 |
 |
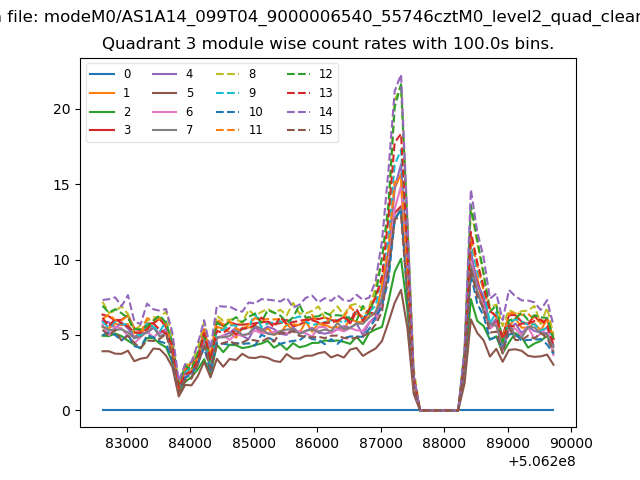
| Module-wise count rates for Quadrant C Data is divided into 100 sec bins |
 |
 |
| Module-wise count rates for Quadrant D Data is divided into 100 sec bins |
 |
 |
| Parameter | Plot |
|---|---|
| CZT HV Monitor | 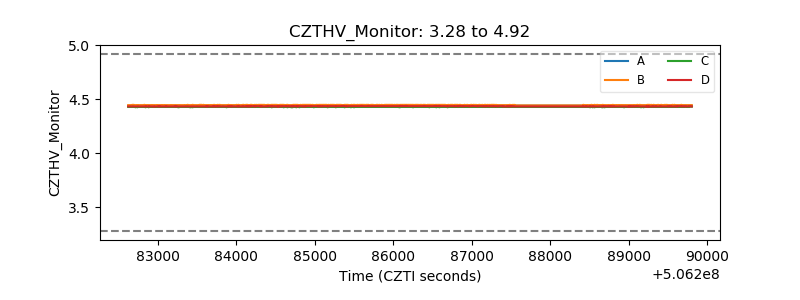 |
| D_VDD | 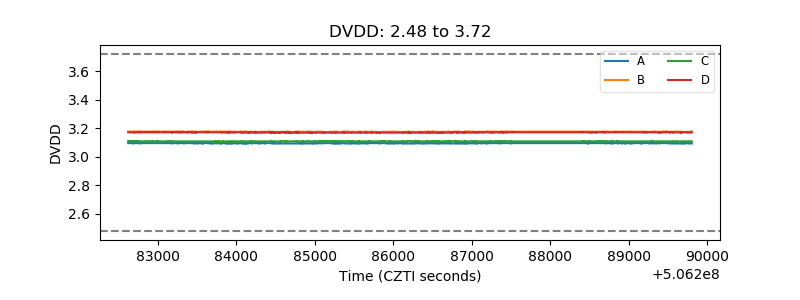 |
| Temperature 1 | 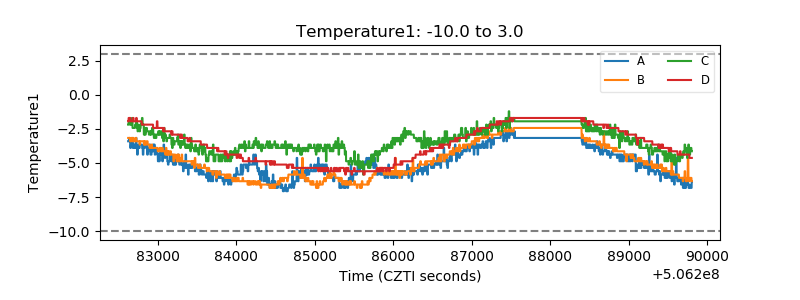 |
| Veto HV Monitor | 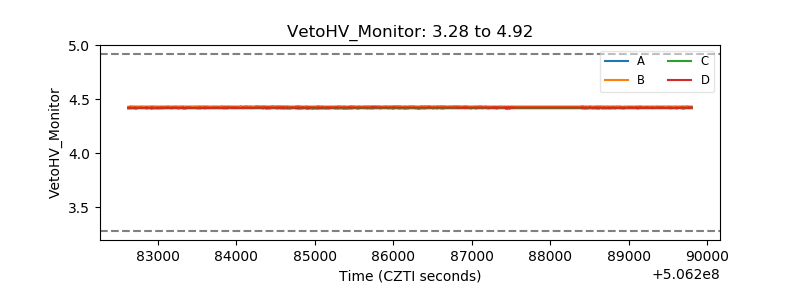 |
| Veto LLD | 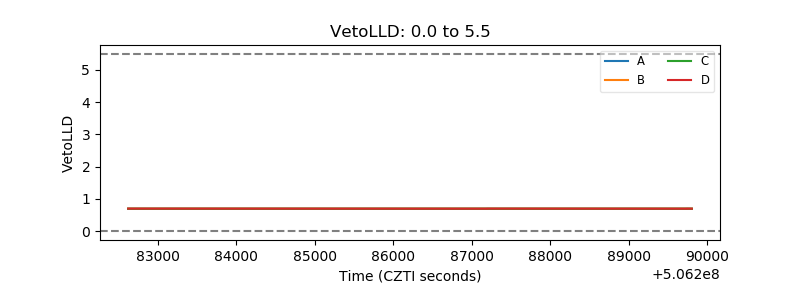 |
| Alpha Counter | 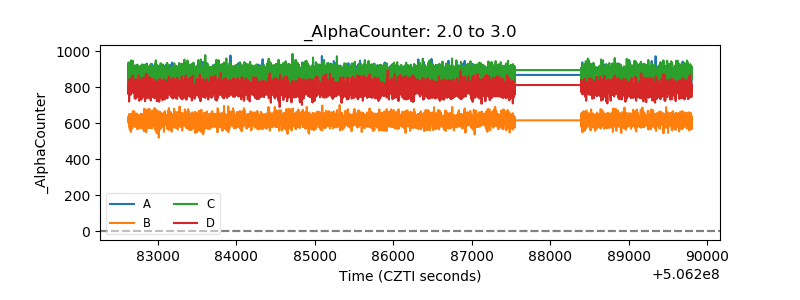 |
| _CPM_Rate | 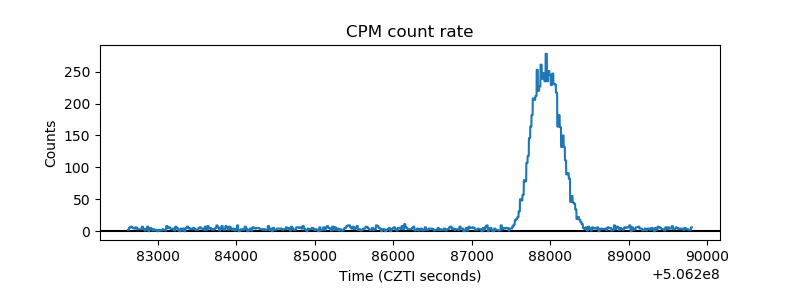 |
| CZT Counter | 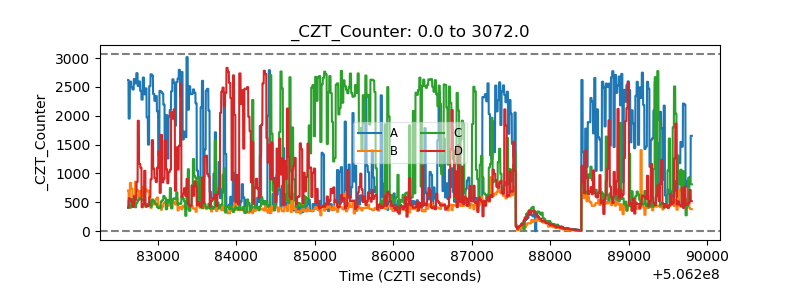 |
| +2.5 Volts monitor |  |
| +5 Volts monitor |  |
| _ROLL_ROT | 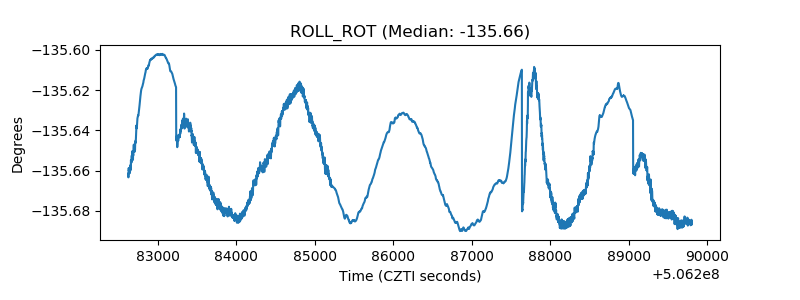 |
| _Roll_DEC | 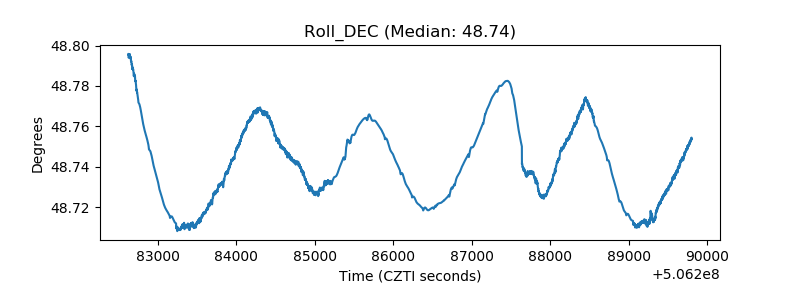 |
| _Roll_RA | 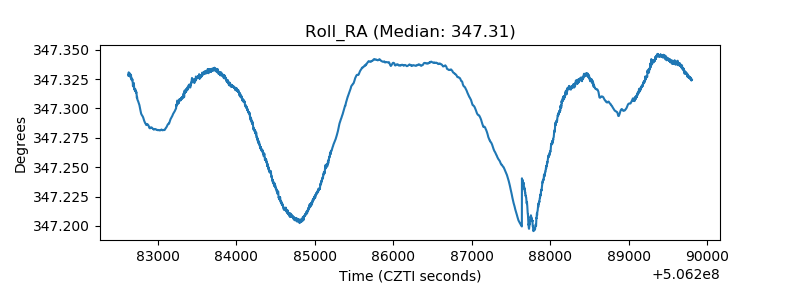 |
| Veto Counter | 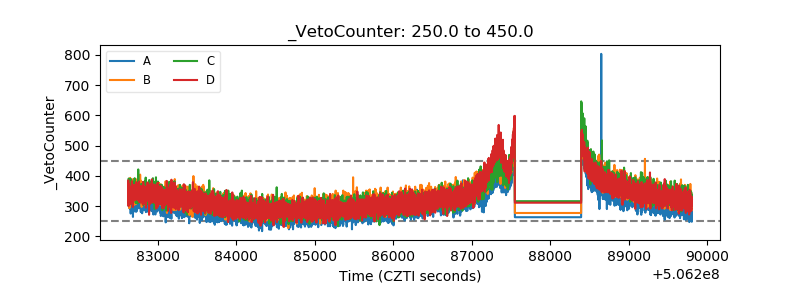 |