| Param | Original file | Final file |
|---|---|---|
| Filename | modeM0/AS1A14_099T04_9000006540_55747cztM0_level2.fits | modeM0/AS1A14_099T04_9000006540_55747cztM0_level2_quad_clean.evt |
| Size (bytes) | 676,722,240 | 98,081,280 |
| Size | 645.4 MB | 93.5 MB |
| Events in quadrant A | 8,870,113 | 528,293 |
| Events in quadrant B | 3,216,018 | 752,418 |
| Events in quadrant C | 6,267,274 | 617,188 |
| Events in quadrant D | 6,167,227 | 595,529 |
| Mode M0 | |||
|---|---|---|---|
| Quadrant | BADHDUFLAG | Total packets | Discarded packets |
| A | 0 | 31027 | 2 |
| B | 0 | 14550 | 2 |
| C | 0 | 23332 | 2 |
| D | 0 | 23231 | 4 |
| Mode M9 | |||
|---|---|---|---|
| Quadrant | BADHDUFLAG | Total packets | Discarded packets |
| A | 0 | 9 | 0 |
| B | 0 | 9 | 0 |
| C | 0 | 9 | 0 |
| D | 0 | 9 | 0 |
| Mode SS | |||
|---|---|---|---|
| Quadrant | BADHDUFLAG | Total packets | Discarded packets |
| A | 0 | 140 | 0 |
| B | 0 | 140 | 0 |
| C | 0 | 140 | 0 |
| D | 0 | 140 | 0 |
| Quadrant | Total seconds | Saturated seconds | Saturation percentage |
|---|---|---|---|
| A | 6832 | 1858 | 27.195550% |
| B | 6832 | 59 | 0.863583% |
| C | 6833 | 855 | 12.512806% |
| D | 6832 | 770 | 11.270492% |
Noise dominated data is calculated using 1-second bins in cleaned event files. If a bin has >2000 counts, and if more than 50% of those come from <1% of pixels, then it is considered to be noise-dominated and hence unusable.
| Quadrant | # 1 sec bins | Bins with >0 counts | Bins with >2000 counts | High rate bins dominated by noise | Noise dominated (total time) | Noise dominated (detector-on time) | Marked lightcurve |
|---|---|---|---|---|---|---|---|
| A | 7797 | 6833 | 1467 | 1467 | 18.81% | 21.47% | 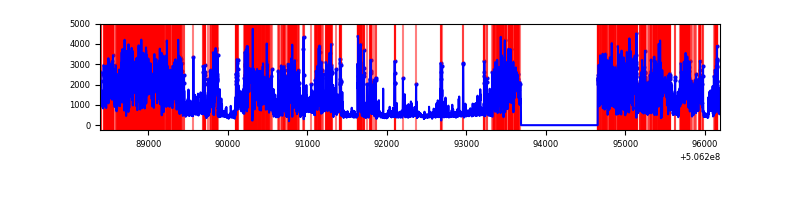 |
| B | 7797 | 6833 | 8 | 8 | 0.10% | 0.12% | 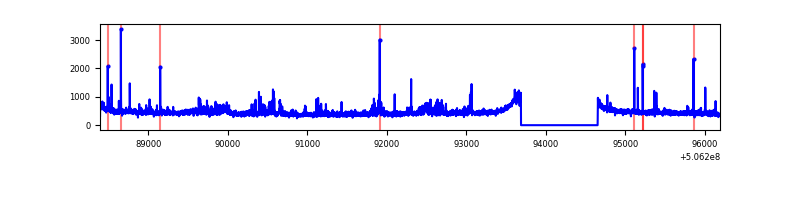 |
| C | 7798 | 6834 | 602 | 602 | 7.72% | 8.81% | 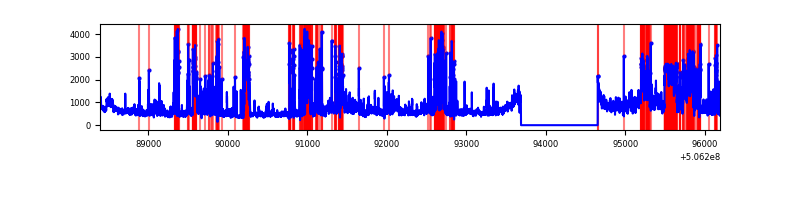 |
| D | 7797 | 6833 | 626 | 626 | 8.03% | 9.16% | 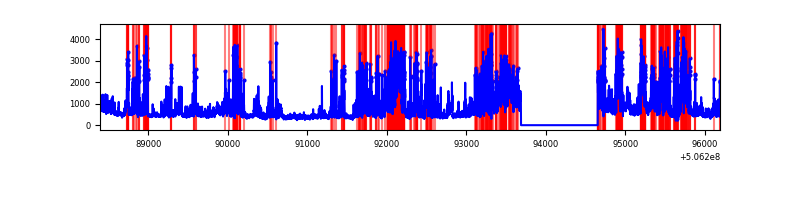 |
Top three noisy pixels from each quadrant. If the there are fewer than three noisy pixels in the level2.evt file, extra rows are filled as -1
| Pixel properties | Quadrant properties | ||||||
|---|---|---|---|---|---|---|---|
| Quadrant | DetID | PixID | Counts | Sigma | Mean | Median | Sigma |
| A | 15 | 32 | 5353101 | 32201.74 | 657 | 642 | 166.2 |
| A | 4 | 249 | 350451 | 2104.54 | 657 | 642 | 166.2 |
| A | 8 | 192 | 183773 | 1101.76 | 657 | 642 | 166.2 |
| B | 0 | 199 | 156221 | 974.66 | 739 | 714 | 159.6 |
| B | 7 | 0 | 61565 | 381.39 | 739 | 714 | 159.6 |
| B | 10 | 247 | 35074 | 215.36 | 739 | 714 | 159.6 |
| C | 15 | 199 | 1956229 | 10099.46 | 689 | 681 | 193.6 |
| C | 9 | 38 | 1215625 | 6274.6 | 689 | 681 | 193.6 |
| C | 15 | 147 | 111056 | 570.03 | 689 | 681 | 193.6 |
| D | 11 | 129 | 3223081 | 15750.58 | 708 | 675 | 204.6 |
| D | 5 | 38 | 52650 | 254.05 | 708 | 675 | 204.6 |
| D | 5 | 173 | 47846 | 230.56 | 708 | 675 | 204.6 |
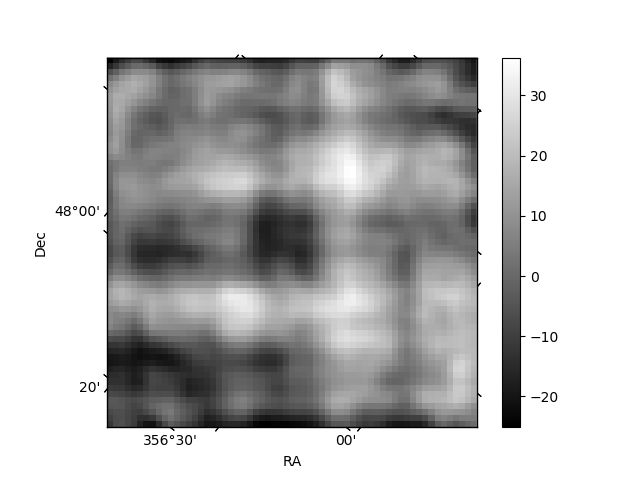
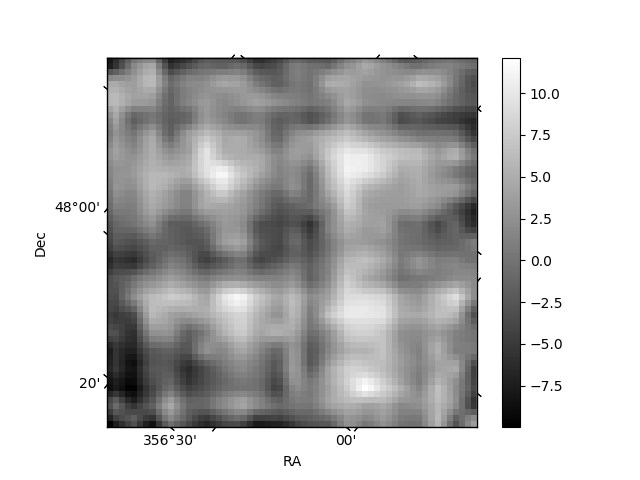
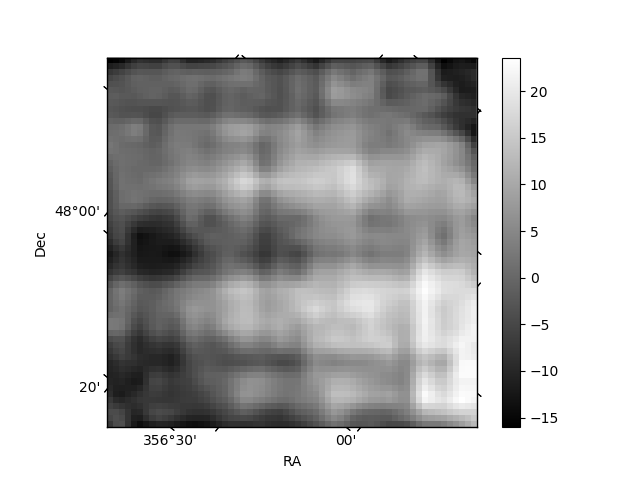
Histogram calculated using DETX and DETY for each event in the final _common_clean file
| Quadrant A | 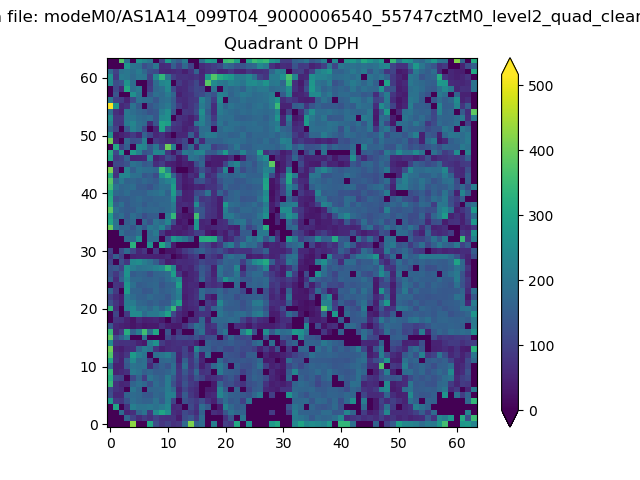 |
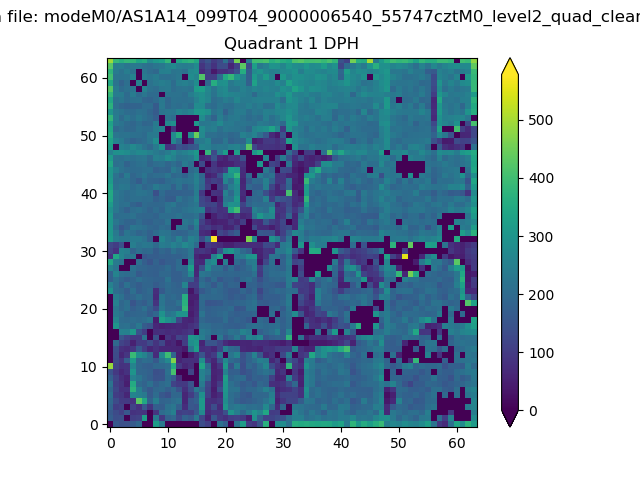 |
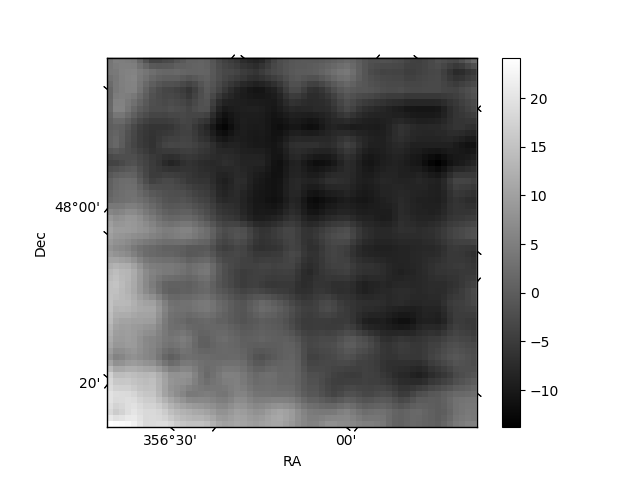
Quadrant B |
|---|---|---|---|
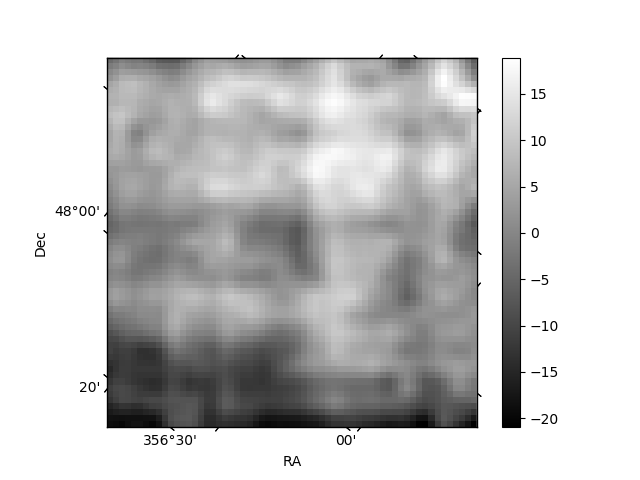
| Quadrant D | 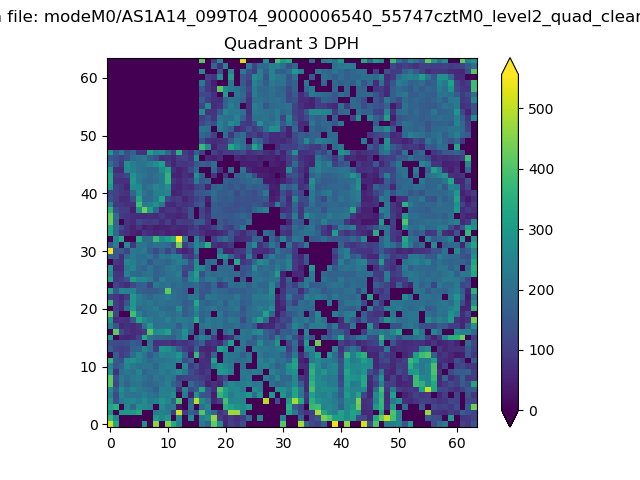 |
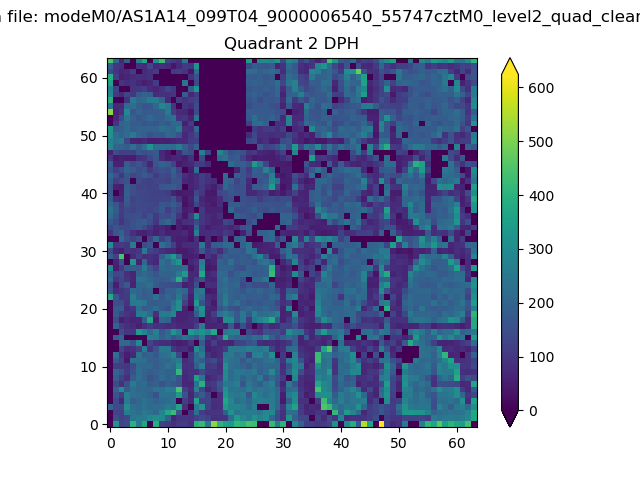 |
Quadrant C |
| Plot type | Count rate plots | Images |
|---|---|---|
| Comparison with Poisson distribution Blue bars denote a histogram of data divided into 1 sec bins. Red curve is a Poisson curve with rate = median count rate of data. |
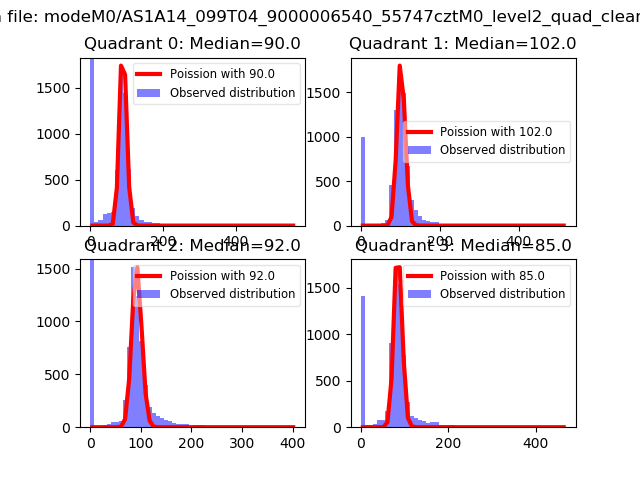 |
 |
| Quadrant-wise count rates Data is divided into 100 sec bins |
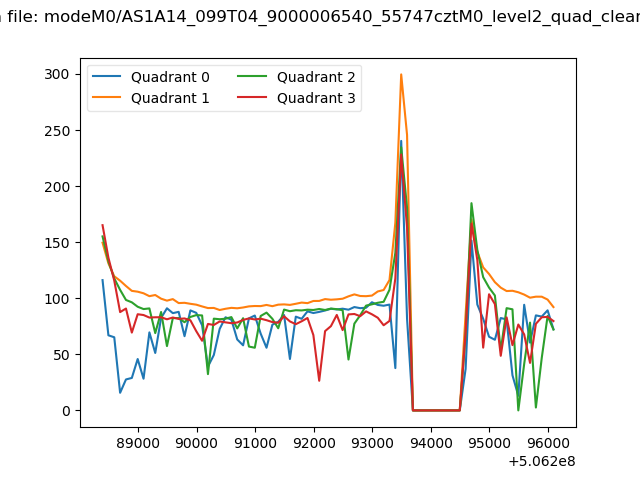 |
|
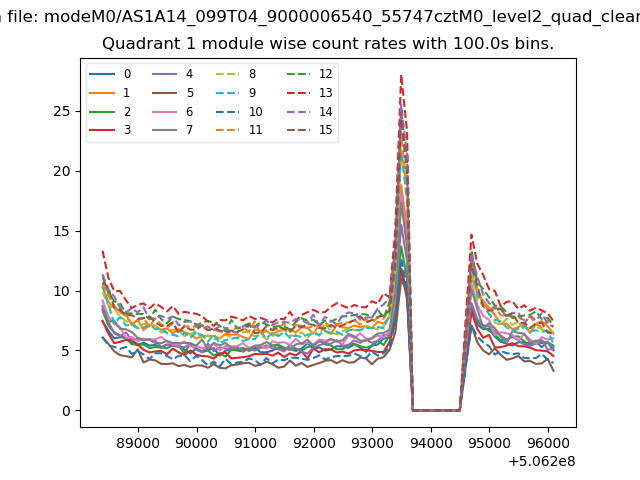
| Module-wise count rates for Quadrant A Data is divided into 100 sec bins |
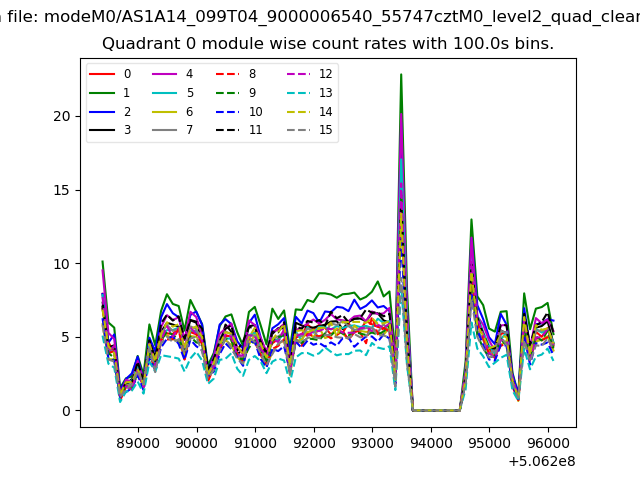 |
 |
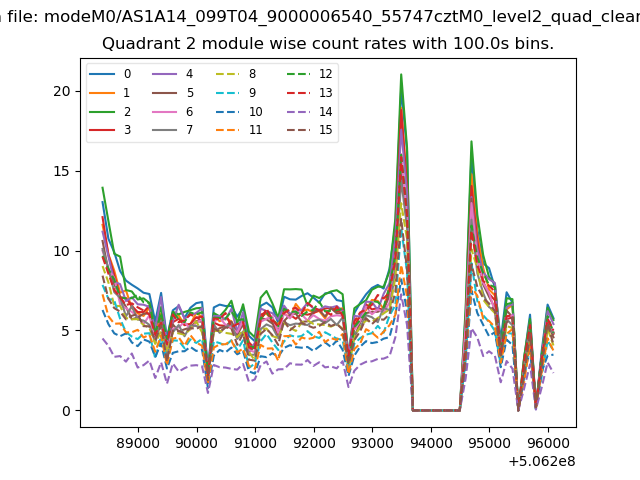
| Module-wise count rates for Quadrant B Data is divided into 100 sec bins |
 |
 |
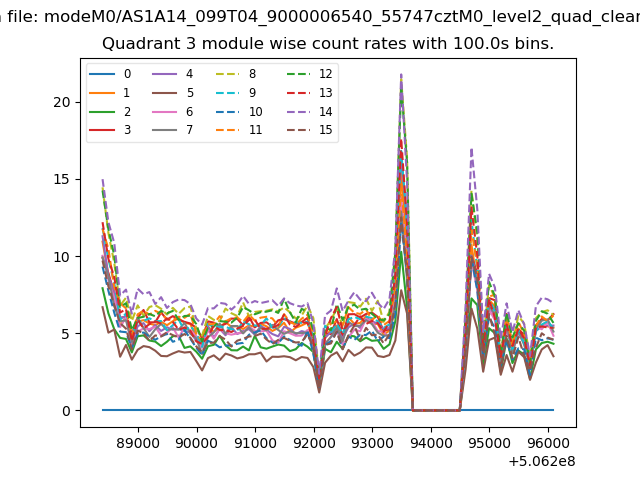
| Module-wise count rates for Quadrant C Data is divided into 100 sec bins |
 |
 |
| Module-wise count rates for Quadrant D Data is divided into 100 sec bins |
 |
 |
| Parameter | Plot |
|---|---|
| CZT HV Monitor | 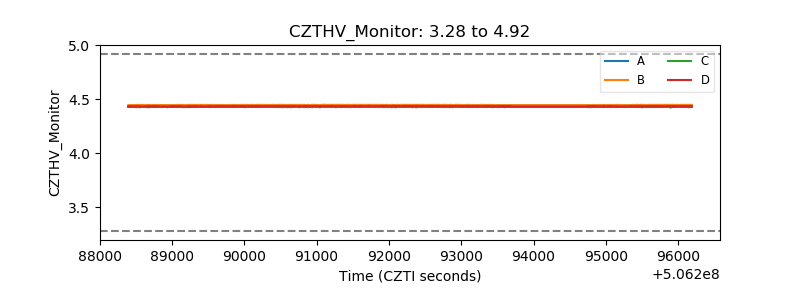 |
| D_VDD | 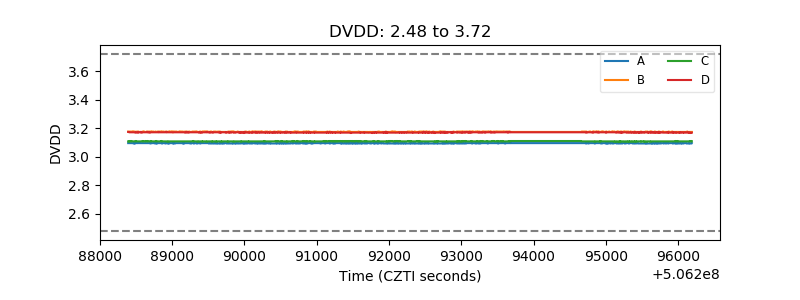 |
| Temperature 1 | 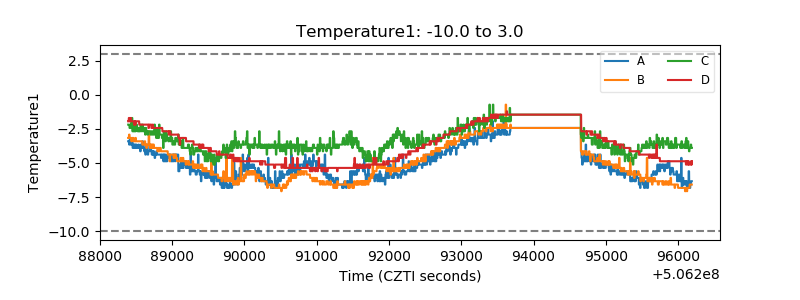 |
| Veto HV Monitor | 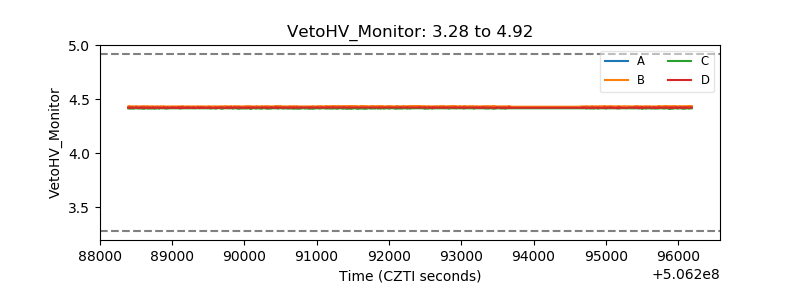 |
| Veto LLD | 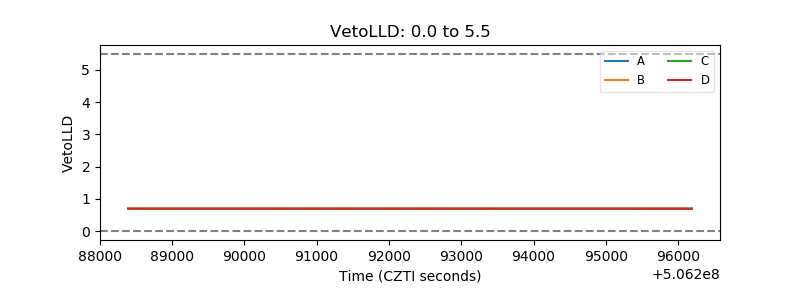 |
| Alpha Counter | 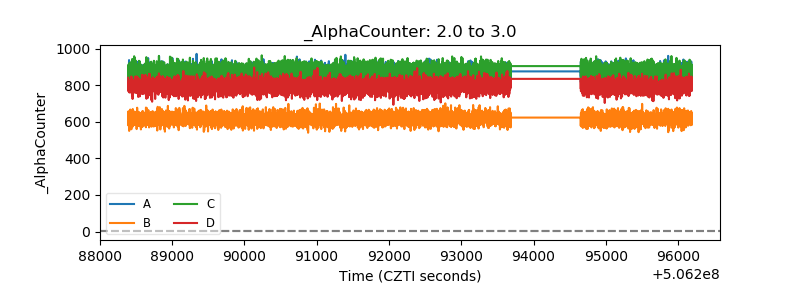 |
| _CPM_Rate | 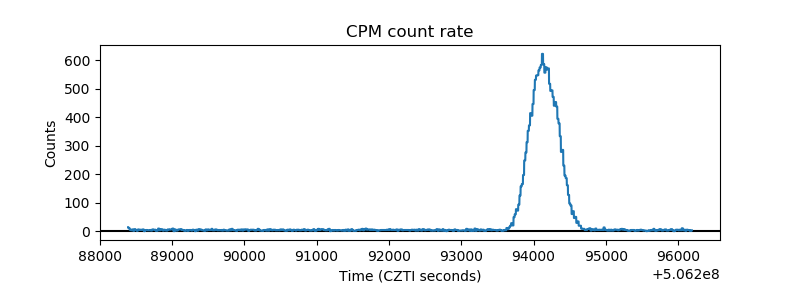 |
| CZT Counter | 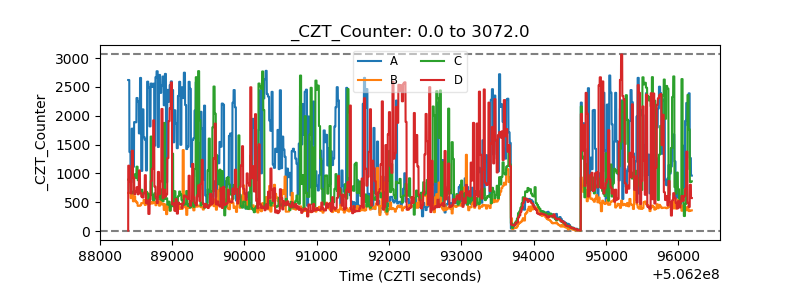 |
| +2.5 Volts monitor |  |
| +5 Volts monitor |  |
| _ROLL_ROT | 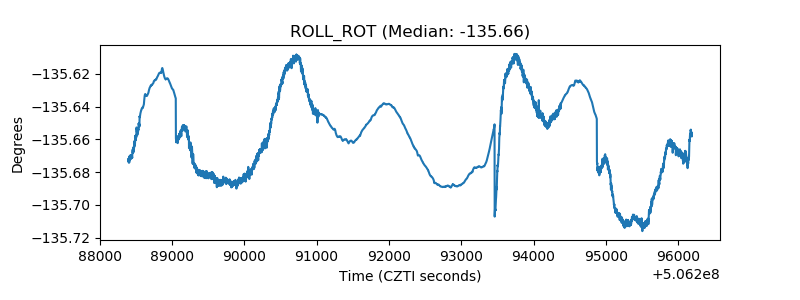 |
| _Roll_DEC | 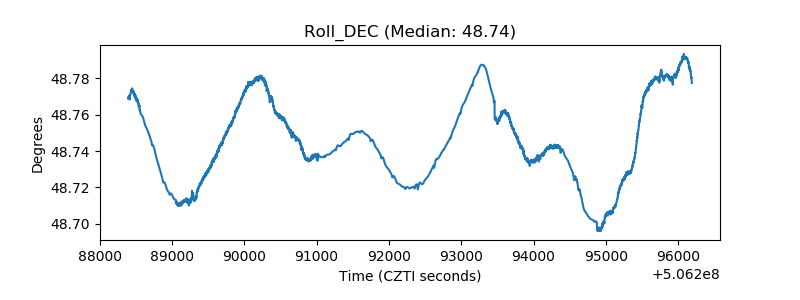 |
| _Roll_RA | 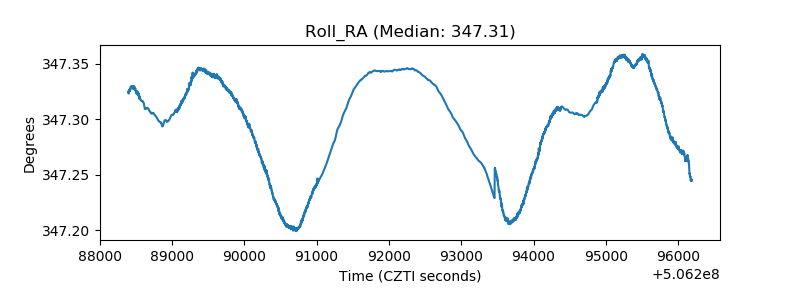 |
| Veto Counter | 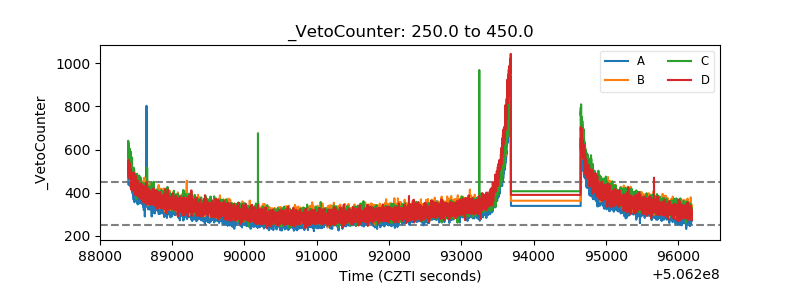 |