| Param | Original file | Final file |
|---|---|---|
| Filename | modeM0/AS1A14_099T04_9000006540_55749cztM0_level2.fits | modeM0/AS1A14_099T04_9000006540_55749cztM0_level2_quad_clean.evt |
| Size (bytes) | 667,068,480 | 91,981,440 |
| Size | 636.2 MB | 87.7 MB |
| Events in quadrant A | 7,918,250 | 545,995 |
| Events in quadrant B | 3,248,670 | 703,593 |
| Events in quadrant C | 5,454,596 | 577,716 |
| Events in quadrant D | 7,548,745 | 487,759 |
| Mode M0 | |||
|---|---|---|---|
| Quadrant | BADHDUFLAG | Total packets | Discarded packets |
| A | 0 | 28151 | 2 |
| B | 0 | 14632 | 2 |
| C | 0 | 21242 | 2 |
| D | 0 | 27147 | 2 |
| Mode M9 | |||
|---|---|---|---|
| Quadrant | BADHDUFLAG | Total packets | Discarded packets |
| A | 0 | 15 | 0 |
| B | 0 | 16 | 0 |
| C | 0 | 16 | 0 |
| D | 0 | 16 | 0 |
| Mode SS | |||
|---|---|---|---|
| Quadrant | BADHDUFLAG | Total packets | Discarded packets |
| A | 0 | 138 | 0 |
| B | 0 | 138 | 0 |
| C | 0 | 138 | 0 |
| D | 0 | 138 | 0 |
| Quadrant | Total seconds | Saturated seconds | Saturation percentage |
|---|---|---|---|
| A | 6736 | 1344 | 19.952494% |
| B | 6736 | 118 | 1.751781% |
| C | 6736 | 835 | 12.396081% |
| D | 6736 | 1561 | 23.173990% |
Noise dominated data is calculated using 1-second bins in cleaned event files. If a bin has >2000 counts, and if more than 50% of those come from <1% of pixels, then it is considered to be noise-dominated and hence unusable.
| Quadrant | # 1 sec bins | Bins with >0 counts | Bins with >2000 counts | High rate bins dominated by noise | Noise dominated (total time) | Noise dominated (detector-on time) | Marked lightcurve |
|---|---|---|---|---|---|---|---|
| A | 7836 | 6737 | 1055 | 1055 | 13.46% | 15.66% | 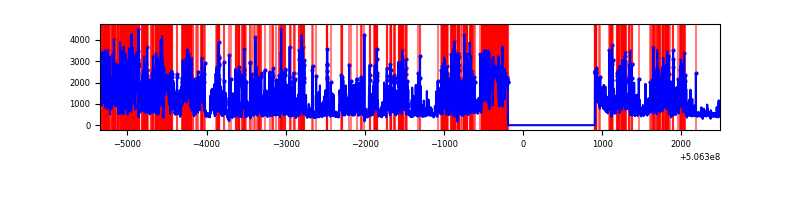 |
| B | 7836 | 6737 | 55 | 55 | 0.70% | 0.82% | 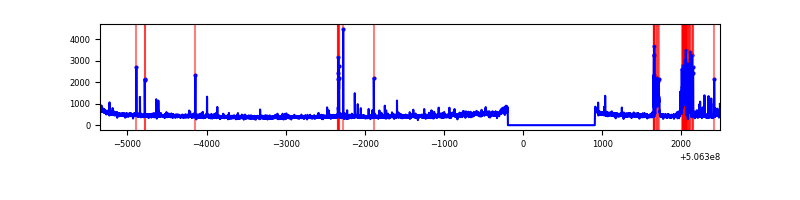 |
| C | 7836 | 6737 | 608 | 608 | 7.76% | 9.02% | 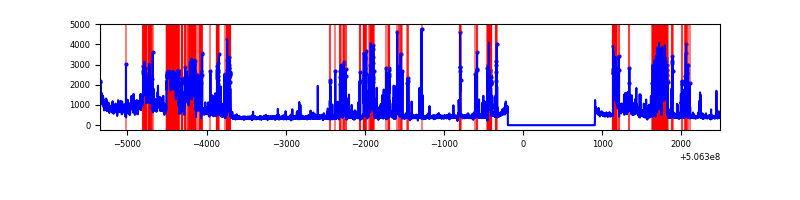 |
| D | 7836 | 6737 | 1380 | 1380 | 17.61% | 20.48% | 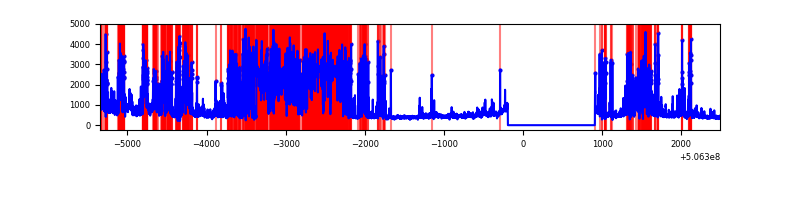 |
Top three noisy pixels from each quadrant. If the there are fewer than three noisy pixels in the level2.evt file, extra rows are filled as -1
| Pixel properties | Quadrant properties | ||||||
|---|---|---|---|---|---|---|---|
| Quadrant | DetID | PixID | Counts | Sigma | Mean | Median | Sigma |
| A | 15 | 32 | 3882289 | 24109.31 | 649 | 633 | 161.0 |
| A | 4 | 249 | 384875 | 2386.56 | 649 | 633 | 161.0 |
| A | 7 | 64 | 331286 | 2053.71 | 649 | 633 | 161.0 |
| B | 2 | 249 | 251895 | 1639.27 | 716 | 691 | 153.2 |
| B | 0 | 199 | 49110 | 315.96 | 716 | 691 | 153.2 |
| B | 1 | 207 | 33571 | 214.56 | 716 | 691 | 153.2 |
| C | 15 | 199 | 2089664 | 11405.3 | 663 | 657 | 183.2 |
| C | 9 | 38 | 478326 | 2607.92 | 663 | 657 | 183.2 |
| C | 6 | 223 | 91606 | 496.55 | 663 | 657 | 183.2 |
| D | 11 | 129 | 4864674 | 26732.78 | 636 | 609 | 182.0 |
| D | 3 | 12 | 61770 | 336.14 | 636 | 609 | 182.0 |
| D | 5 | 173 | 42372 | 229.53 | 636 | 609 | 182.0 |
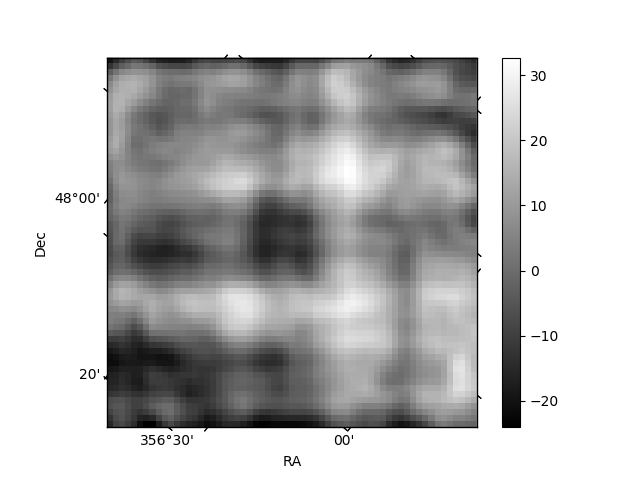
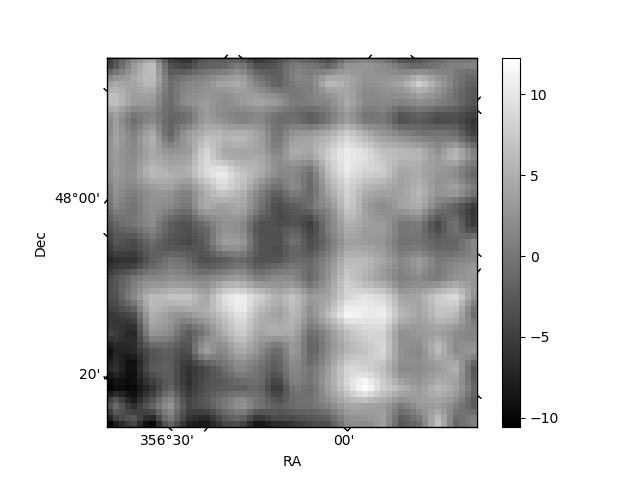
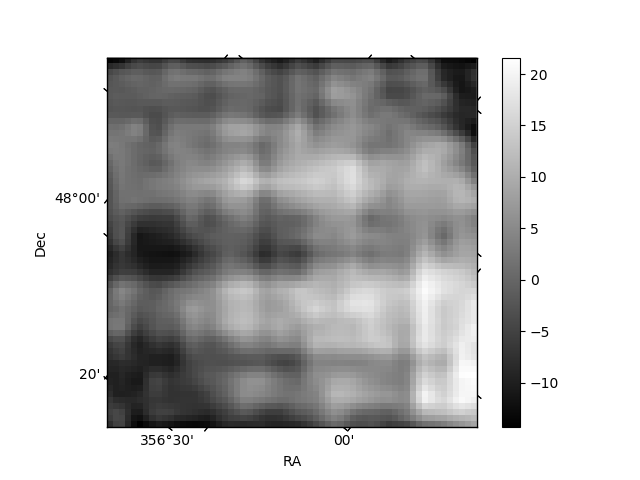
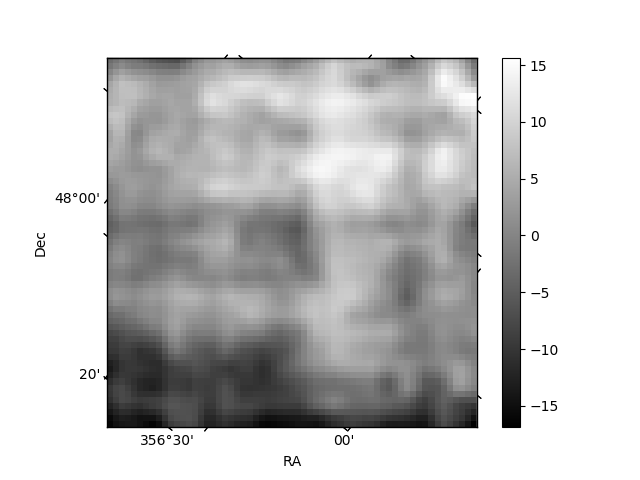
Histogram calculated using DETX and DETY for each event in the final _common_clean file
| Quadrant A | 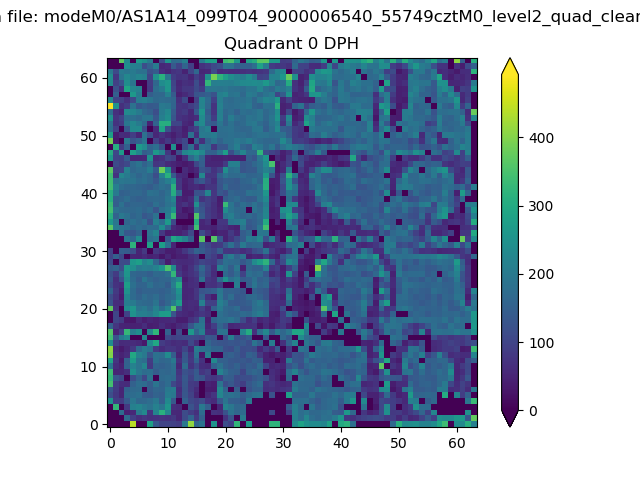 |
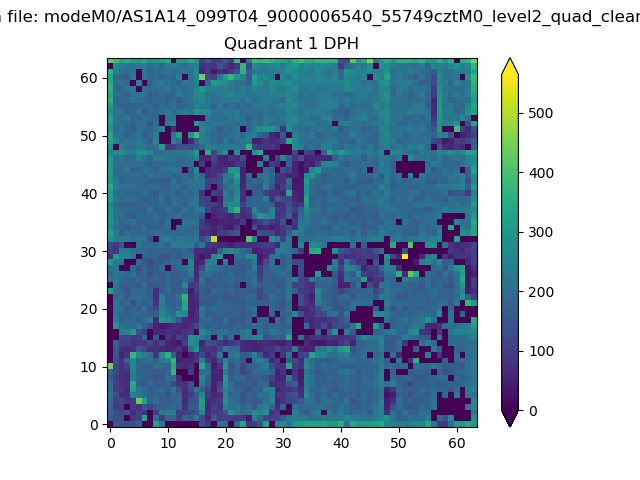 |
Quadrant B |
|---|---|---|---|
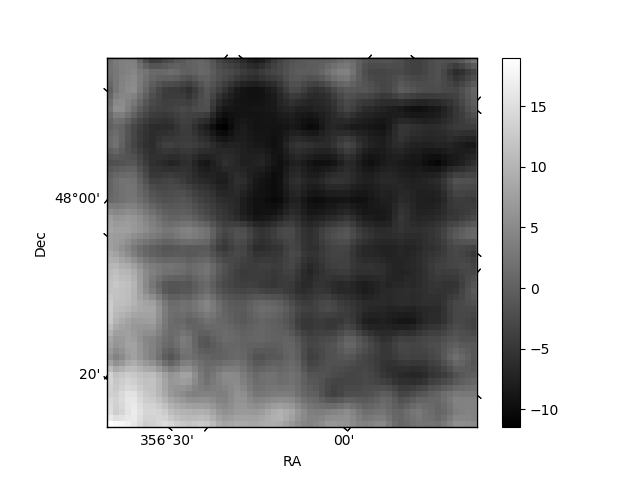
| Quadrant D | 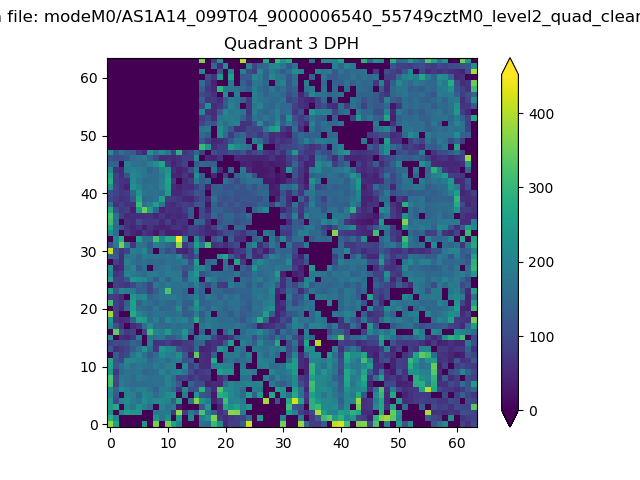 |
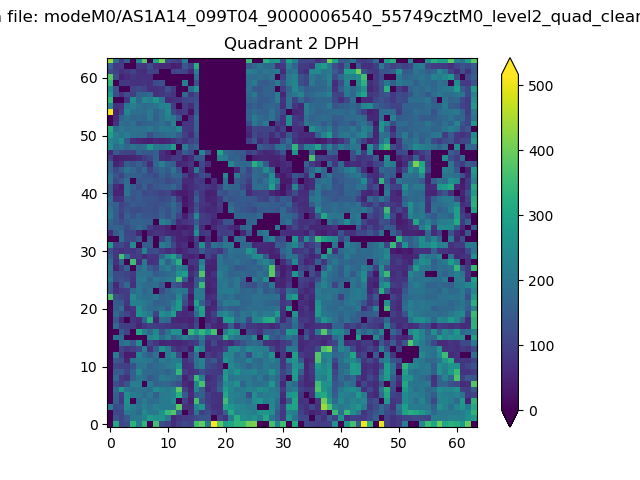 |
Quadrant C |
| Plot type | Count rate plots | Images |
|---|---|---|
| Comparison with Poisson distribution Blue bars denote a histogram of data divided into 1 sec bins. Red curve is a Poisson curve with rate = median count rate of data. |
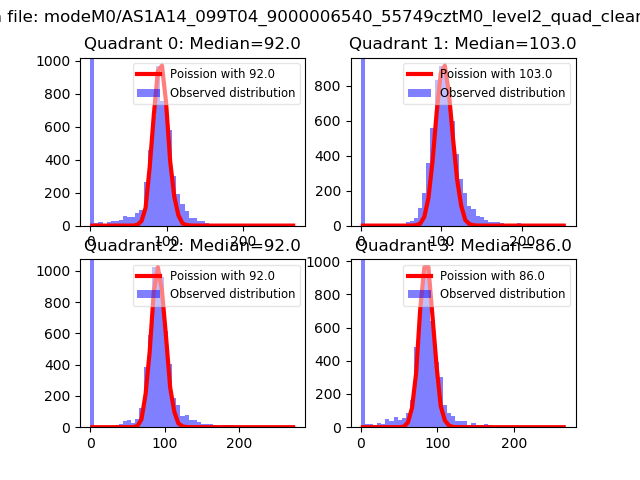 |
 |
| Quadrant-wise count rates Data is divided into 100 sec bins |
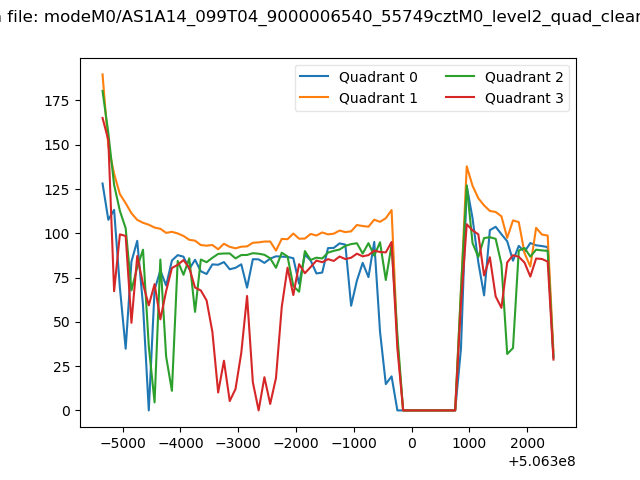 |
|
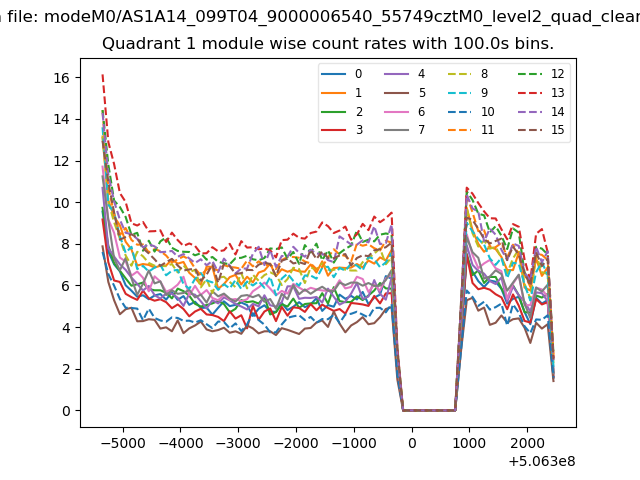
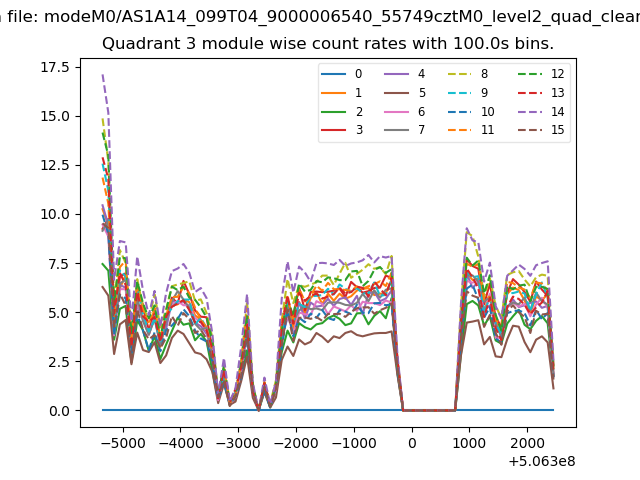
| Module-wise count rates for Quadrant A Data is divided into 100 sec bins |
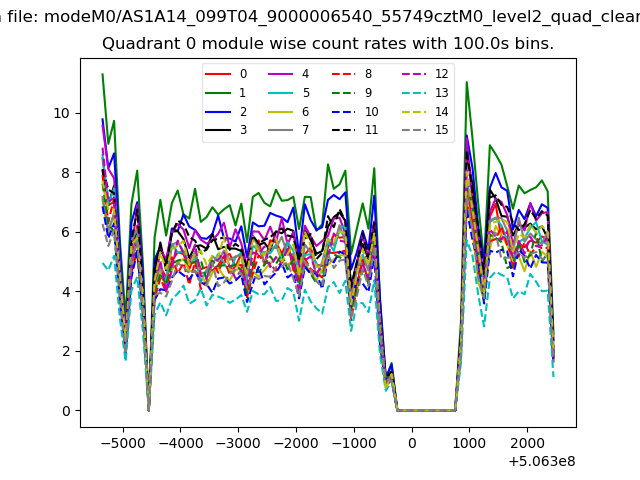 |
 |
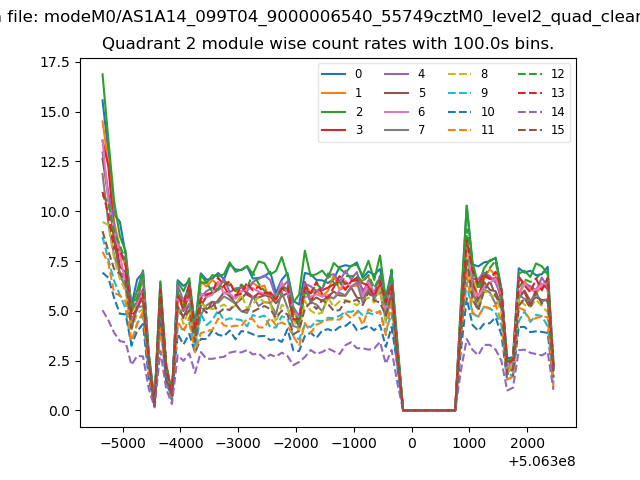
| Module-wise count rates for Quadrant B Data is divided into 100 sec bins |
 |
 |
| Module-wise count rates for Quadrant C Data is divided into 100 sec bins |
 |
 |
| Module-wise count rates for Quadrant D Data is divided into 100 sec bins |
 |
 |
| Parameter | Plot |
|---|---|
| CZT HV Monitor |  |
| D_VDD | 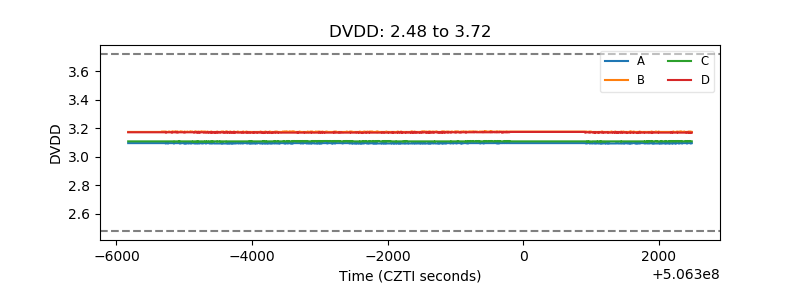 |
| Temperature 1 | 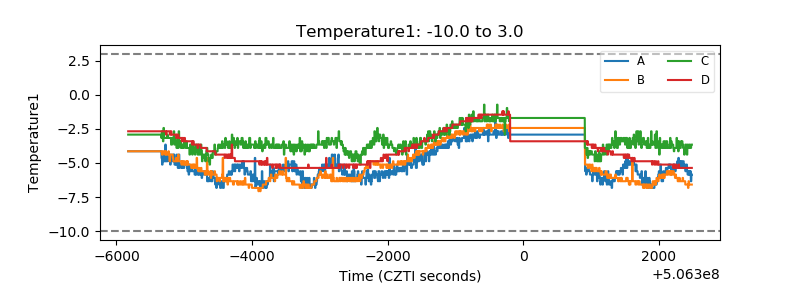 |
| Veto HV Monitor | 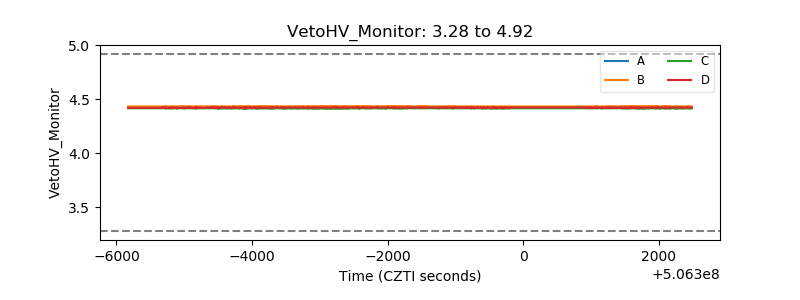 |
| Veto LLD | 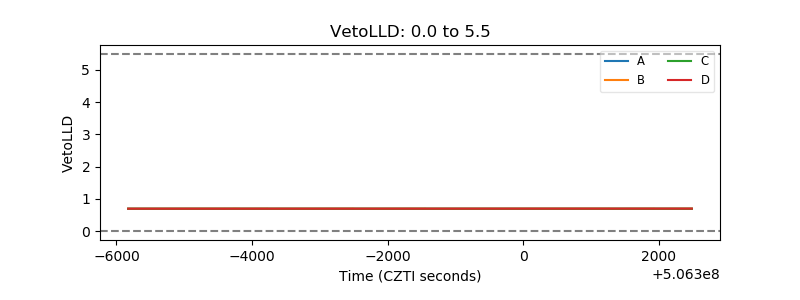 |
| Alpha Counter | 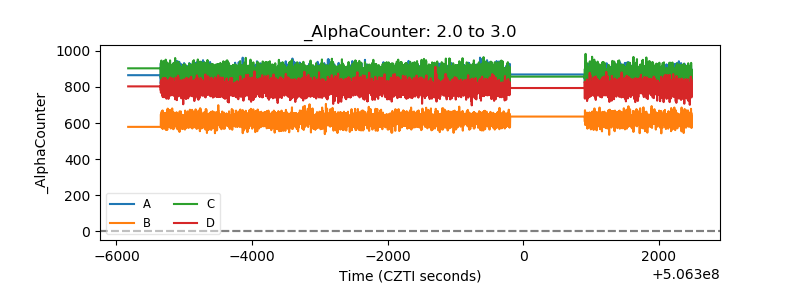 |
| _CPM_Rate | 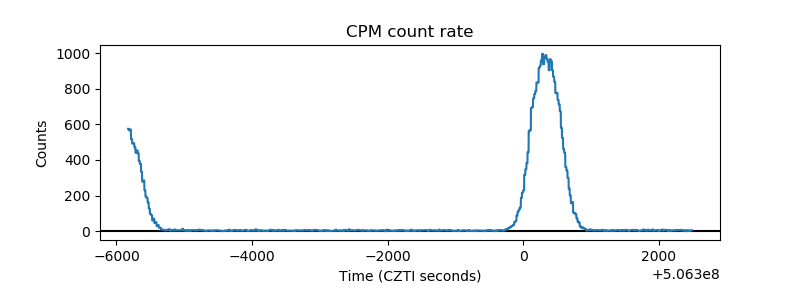 |
| CZT Counter | 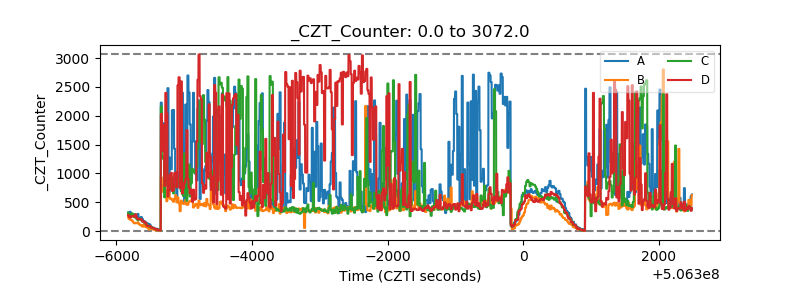 |
| +2.5 Volts monitor |  |
| +5 Volts monitor |  |
| _ROLL_ROT | 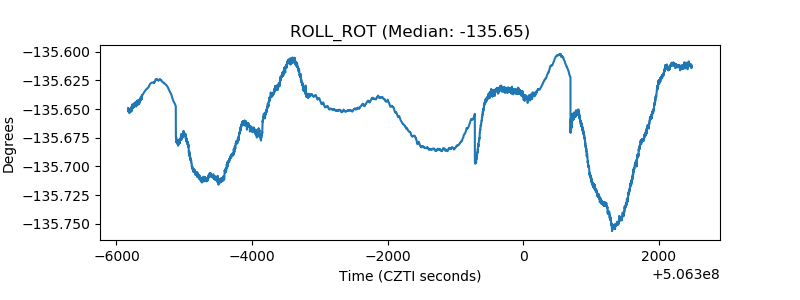 |
| _Roll_DEC | 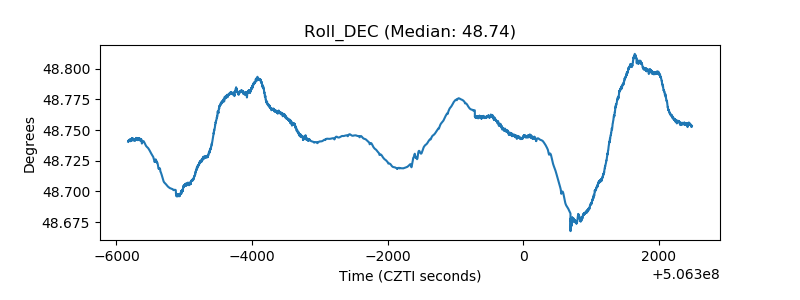 |
| _Roll_RA | 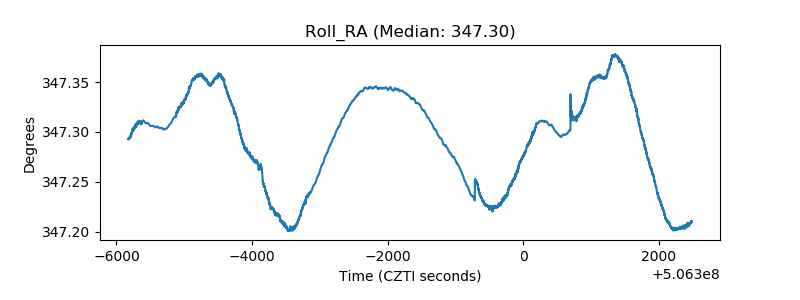 |
| Veto Counter | 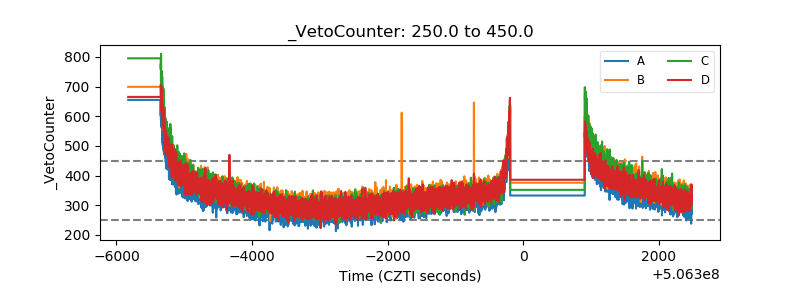 |