| Param | Original file | Final file |
|---|---|---|
| Filename | modeM0/AS1A14_099T04_9000006540_55750cztM0_level2.fits | modeM0/AS1A14_099T04_9000006540_55750cztM0_level2_quad_clean.evt |
| Size (bytes) | 604,448,640 | 92,390,400 |
| Size | 576.4 MB | 88.1 MB |
| Events in quadrant A | 6,712,265 | 582,163 |
| Events in quadrant B | 6,919,887 | 570,991 |
| Events in quadrant C | 4,280,177 | 600,371 |
| Events in quadrant D | 3,947,089 | 581,158 |
| Mode M0 | |||
|---|---|---|---|
| Quadrant | BADHDUFLAG | Total packets | Discarded packets |
| A | 0 | 24518 | 2 |
| B | 0 | 25130 | 2 |
| C | 0 | 17632 | 2 |
| D | 0 | 16514 | 2 |
| Mode M9 | |||
|---|---|---|---|
| Quadrant | BADHDUFLAG | Total packets | Discarded packets |
| A | 0 | 23 | 0 |
| B | 0 | 23 | 0 |
| C | 0 | 23 | 0 |
| D | 0 | 23 | 0 |
| Mode SS | |||
|---|---|---|---|
| Quadrant | BADHDUFLAG | Total packets | Discarded packets |
| A | 0 | 136 | 0 |
| B | 0 | 136 | 0 |
| C | 0 | 136 | 0 |
| D | 0 | 136 | 0 |
| Quadrant | Total seconds | Saturated seconds | Saturation percentage |
|---|---|---|---|
| A | 6638 | 869 | 13.091293% |
| B | 6639 | 1545 | 23.271577% |
| C | 6639 | 503 | 7.576442% |
| D | 6639 | 263 | 3.961440% |
Noise dominated data is calculated using 1-second bins in cleaned event files. If a bin has >2000 counts, and if more than 50% of those come from <1% of pixels, then it is considered to be noise-dominated and hence unusable.
| Quadrant | # 1 sec bins | Bins with >0 counts | Bins with >2000 counts | High rate bins dominated by noise | Noise dominated (total time) | Noise dominated (detector-on time) | Marked lightcurve |
|---|---|---|---|---|---|---|---|
| A | 8898 | 6639 | 707 | 707 | 7.95% | 10.65% | 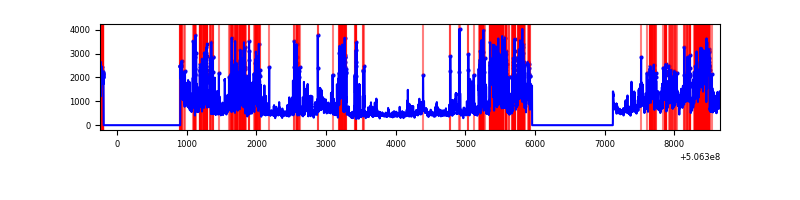 |
| B | 8899 | 6641 | 1041 | 1041 | 11.70% | 15.68% | 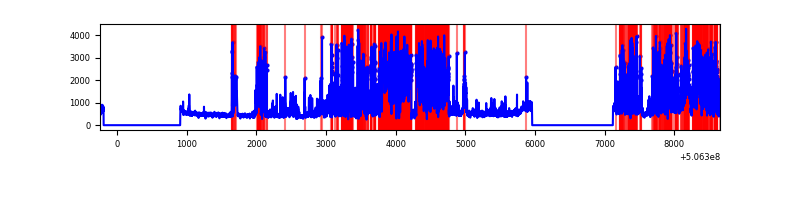 |
| C | 8899 | 6641 | 395 | 395 | 4.44% | 5.95% | 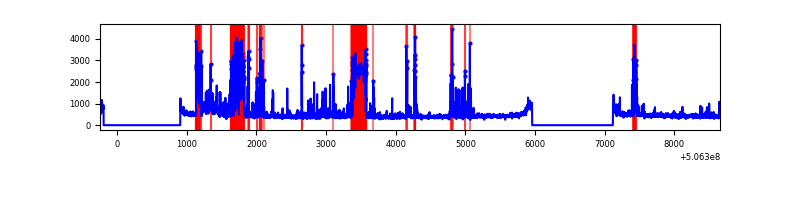 |
| D | 8899 | 6641 | 161 | 161 | 1.81% | 2.42% | 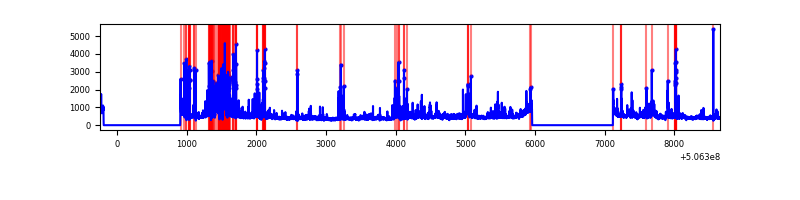 |
Top three noisy pixels from each quadrant. If the there are fewer than three noisy pixels in the level2.evt file, extra rows are filled as -1
| Pixel properties | Quadrant properties | ||||||
|---|---|---|---|---|---|---|---|
| Quadrant | DetID | PixID | Counts | Sigma | Mean | Median | Sigma |
| A | 15 | 32 | 1965588 | 11640.03 | 681 | 665 | 168.8 |
| A | 12 | 115 | 1302182 | 7710.07 | 681 | 665 | 168.8 |
| A | 7 | 64 | 326560 | 1930.57 | 681 | 665 | 168.8 |
| B | 2 | 249 | 4017594 | 28791.85 | 651 | 626 | 139.5 |
| B | 4 | 206 | 213891 | 1528.59 | 651 | 626 | 139.5 |
| B | 7 | 0 | 55566 | 393.79 | 651 | 626 | 139.5 |
| C | 15 | 199 | 1292392 | 6844.28 | 689 | 684 | 188.7 |
| C | 12 | 250 | 101299 | 533.12 | 689 | 684 | 188.7 |
| C | 1 | 16 | 83038 | 436.36 | 689 | 684 | 188.7 |
| D | 11 | 129 | 949414 | 4796.24 | 697 | 666 | 197.8 |
| D | 3 | 12 | 99681 | 500.55 | 697 | 666 | 197.8 |
| D | 7 | 129 | 59070 | 295.25 | 697 | 666 | 197.8 |
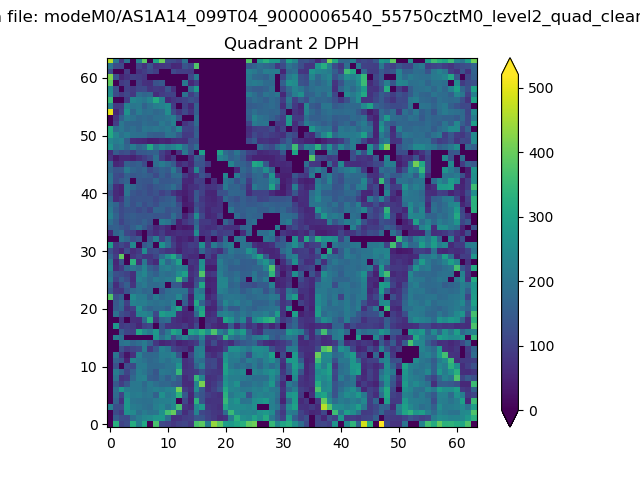
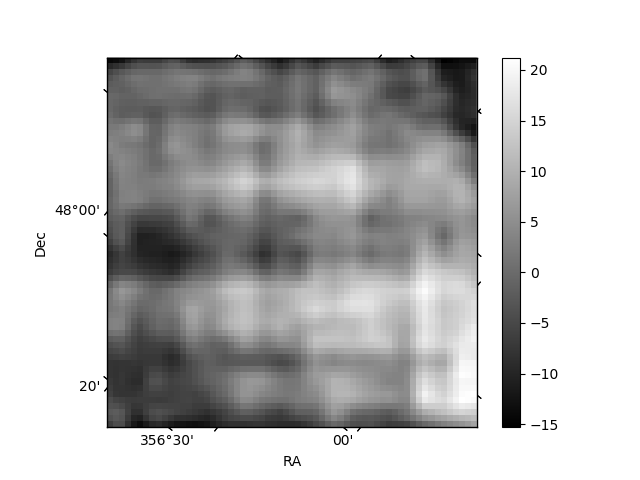
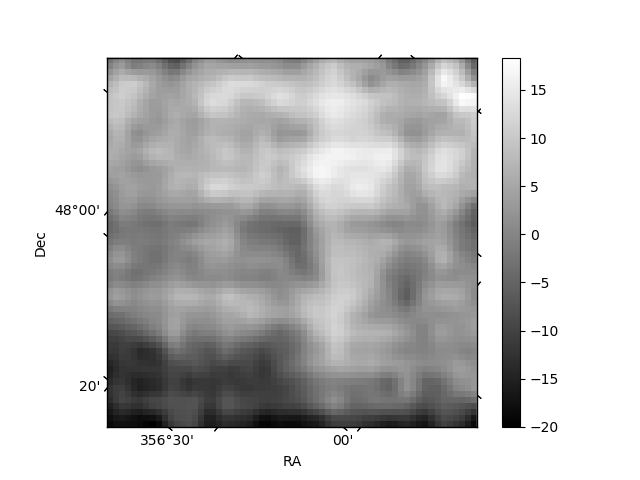
Histogram calculated using DETX and DETY for each event in the final _common_clean file
| Quadrant A | 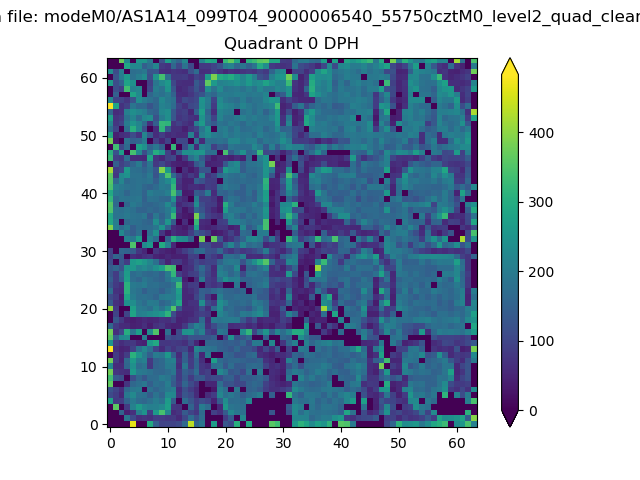 |
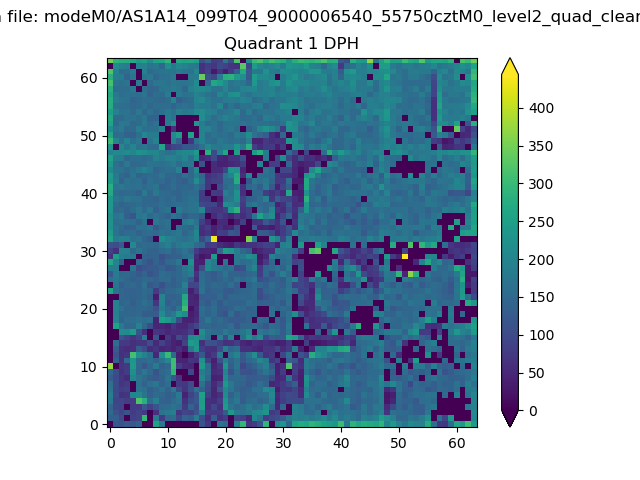 |
Quadrant B |
|---|---|---|---|
| Quadrant D | 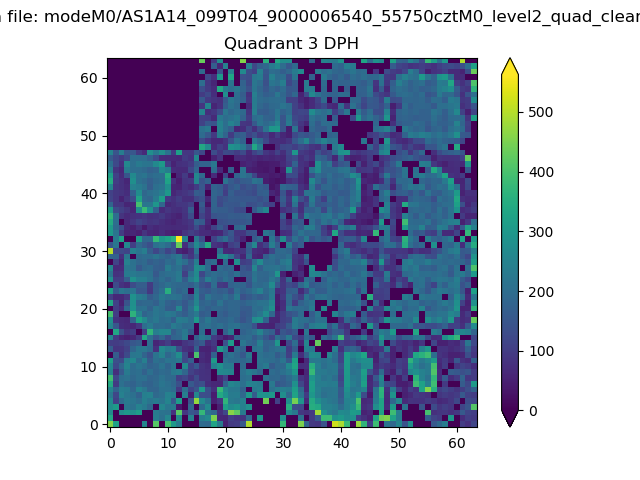 |
 |
Quadrant C |
| Plot type | Count rate plots | Images |
|---|---|---|
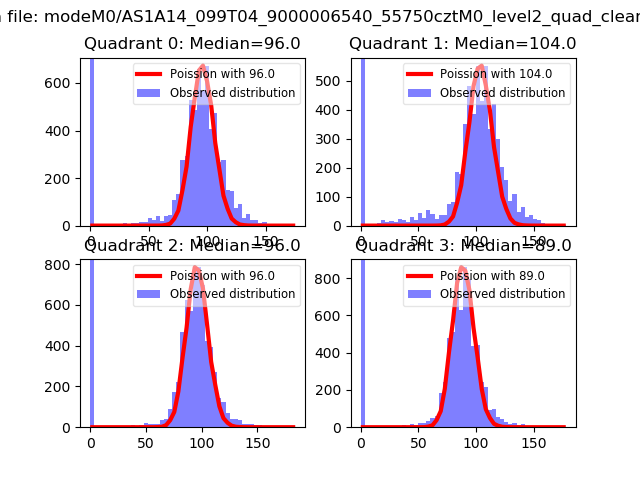
| Comparison with Poisson distribution Blue bars denote a histogram of data divided into 1 sec bins. Red curve is a Poisson curve with rate = median count rate of data. |
 |
 |
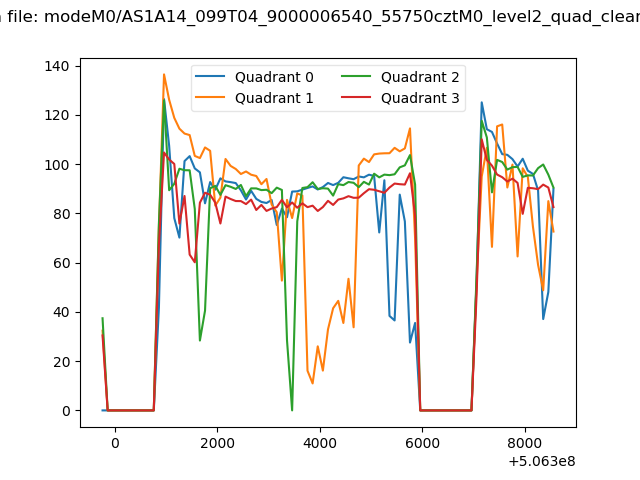
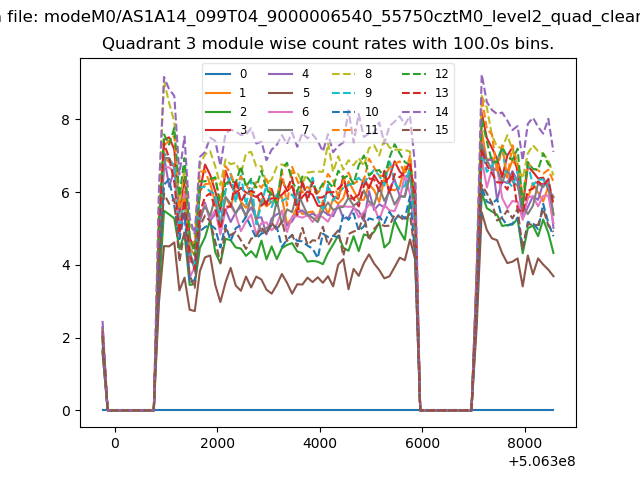
| Quadrant-wise count rates Data is divided into 100 sec bins |
 |
|
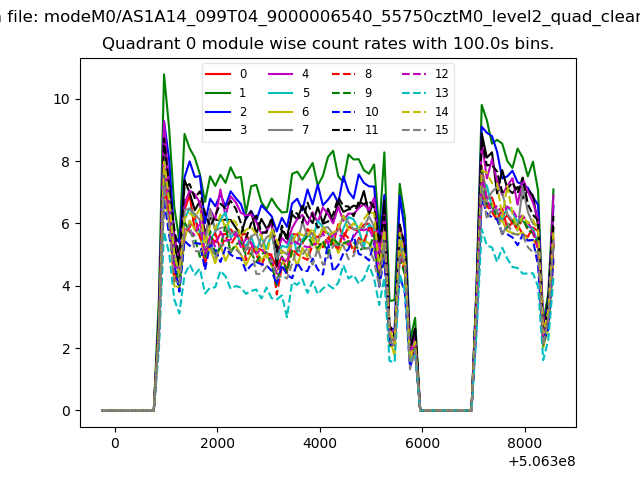
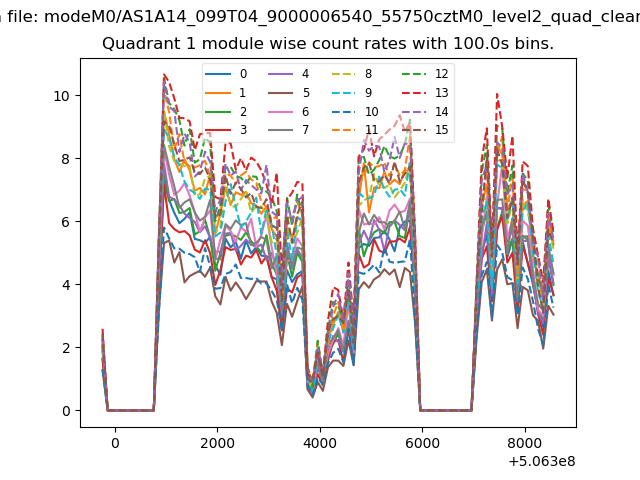
| Module-wise count rates for Quadrant A Data is divided into 100 sec bins |
 |
 |
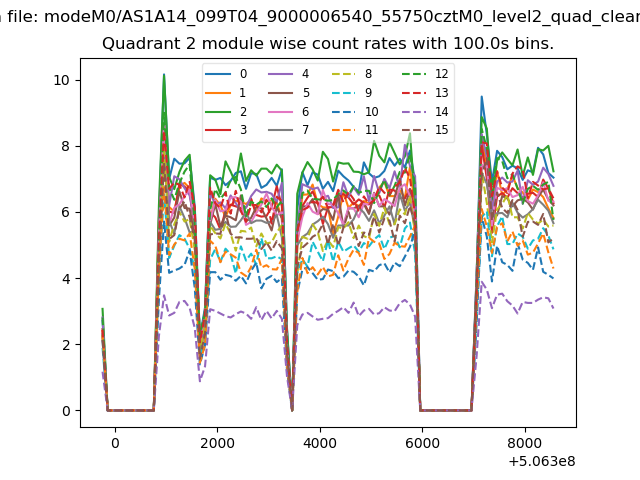
| Module-wise count rates for Quadrant B Data is divided into 100 sec bins |
 |
 |
| Module-wise count rates for Quadrant C Data is divided into 100 sec bins |
 |
 |
| Module-wise count rates for Quadrant D Data is divided into 100 sec bins |
 |
 |
| Parameter | Plot |
|---|---|
| CZT HV Monitor |  |
| D_VDD | 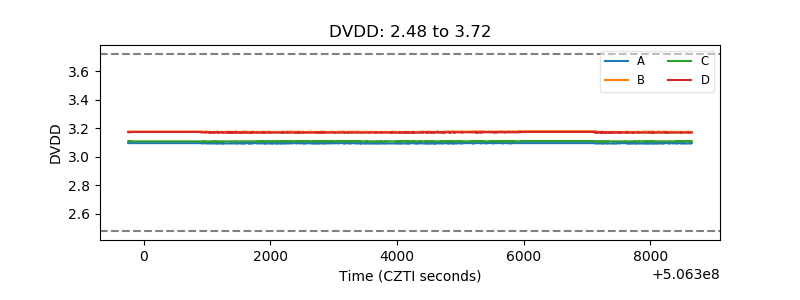 |
| Temperature 1 | 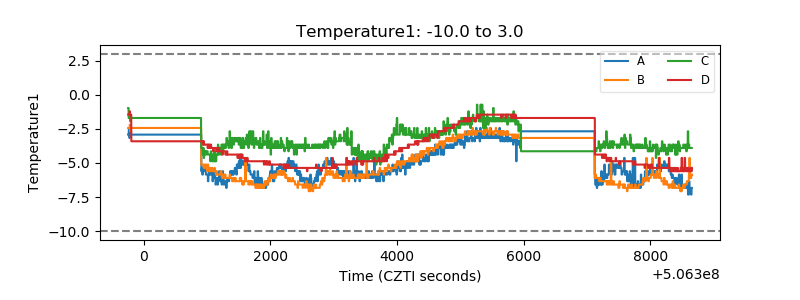 |
| Veto HV Monitor | 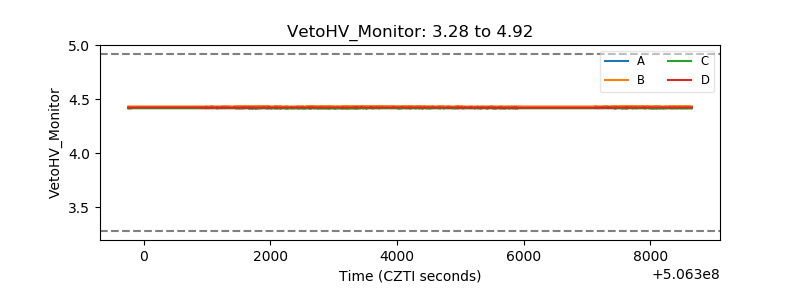 |
| Veto LLD | 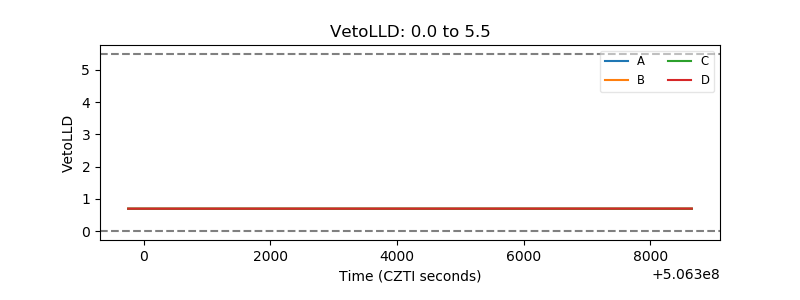 |
| Alpha Counter | 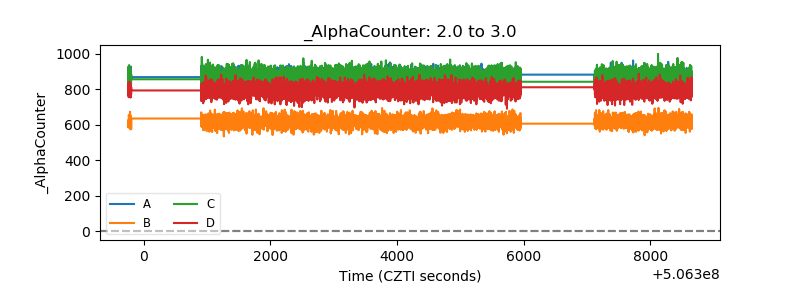 |
| _CPM_Rate | 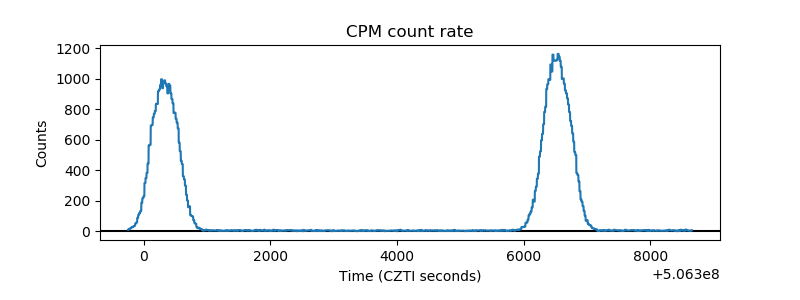 |
| CZT Counter | 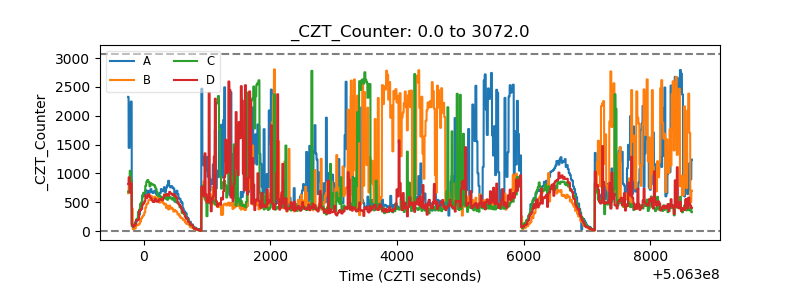 |
| +2.5 Volts monitor |  |
| +5 Volts monitor |  |
| _ROLL_ROT | 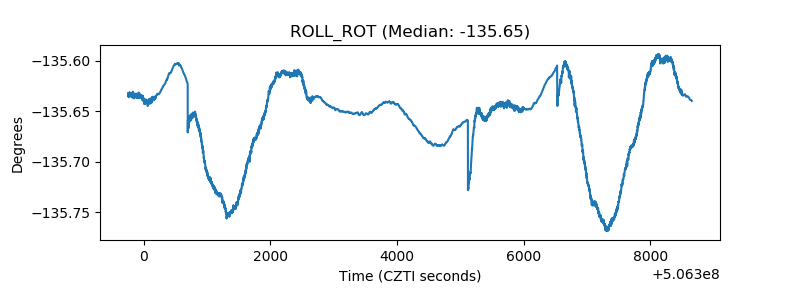 |
| _Roll_DEC | 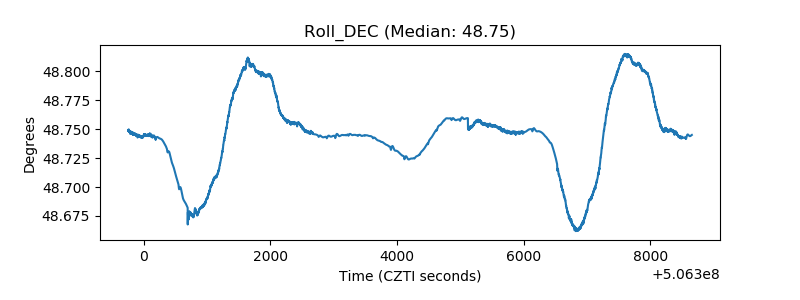 |
| _Roll_RA | 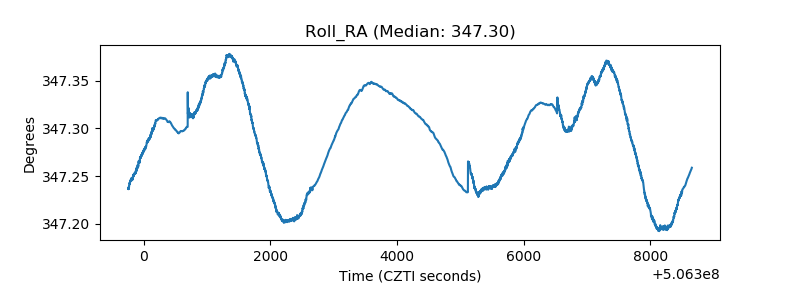 |
| Veto Counter | 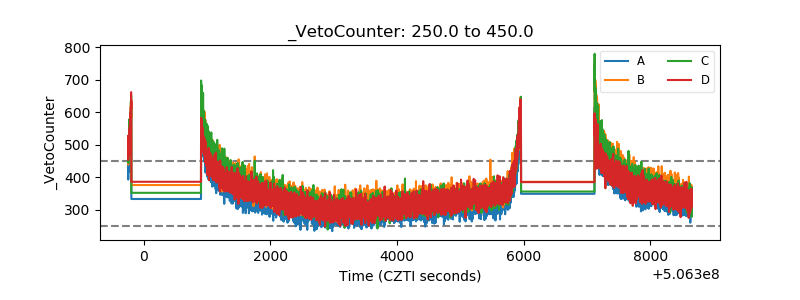 |