| Param | Original file | Final file |
|---|---|---|
| Filename | modeM0/AS1A14_099T04_9000006540_55751cztM0_level2.fits | modeM0/AS1A14_099T04_9000006540_55751cztM0_level2_quad_clean.evt |
| Size (bytes) | 656,210,880 | 90,302,400 |
| Size | 625.8 MB | 86.1 MB |
| Events in quadrant A | 7,143,611 | 577,786 |
| Events in quadrant B | 7,365,793 | 575,675 |
| Events in quadrant C | 3,373,058 | 630,238 |
| Events in quadrant D | 5,903,510 | 496,434 |
| Mode M0 | |||
|---|---|---|---|
| Quadrant | BADHDUFLAG | Total packets | Discarded packets |
| A | 0 | 25786 | 2 |
| B | 0 | 26424 | 2 |
| C | 0 | 14750 | 2 |
| D | 0 | 22365 | 3 |
| Mode M9 | |||
|---|---|---|---|
| Quadrant | BADHDUFLAG | Total packets | Discarded packets |
| A | 0 | 12 | 0 |
| B | 0 | 12 | 0 |
| C | 0 | 12 | 0 |
| D | 0 | 12 | 0 |
| Mode SS | |||
|---|---|---|---|
| Quadrant | BADHDUFLAG | Total packets | Discarded packets |
| A | 0 | 132 | 0 |
| B | 0 | 132 | 0 |
| C | 0 | 132 | 0 |
| D | 0 | 132 | 0 |
| Quadrant | Total seconds | Saturated seconds | Saturation percentage |
|---|---|---|---|
| A | 6512 | 852 | 13.083538% |
| B | 6512 | 1421 | 21.821253% |
| C | 6512 | 89 | 1.366708% |
| D | 6512 | 1076 | 16.523342% |
Noise dominated data is calculated using 1-second bins in cleaned event files. If a bin has >2000 counts, and if more than 50% of those come from <1% of pixels, then it is considered to be noise-dominated and hence unusable.
| Quadrant | # 1 sec bins | Bins with >0 counts | Bins with >2000 counts | High rate bins dominated by noise | Noise dominated (total time) | Noise dominated (detector-on time) | Marked lightcurve |
|---|---|---|---|---|---|---|---|
| A | 7726 | 6513 | 774 | 774 | 10.02% | 11.88% | 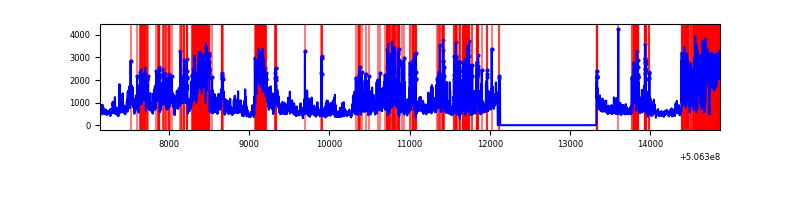 |
| B | 7727 | 6514 | 1013 | 1013 | 13.11% | 15.55% | 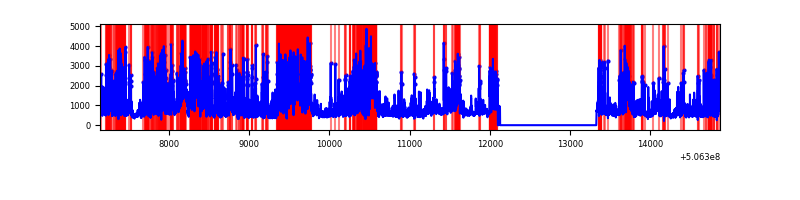 |
| C | 7727 | 6514 | 58 | 58 | 0.75% | 0.89% | 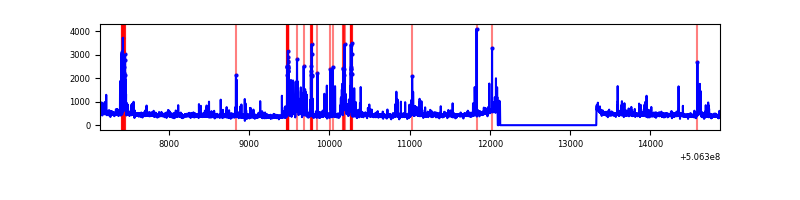 |
| D | 7727 | 6514 | 1018 | 1018 | 13.17% | 15.63% | 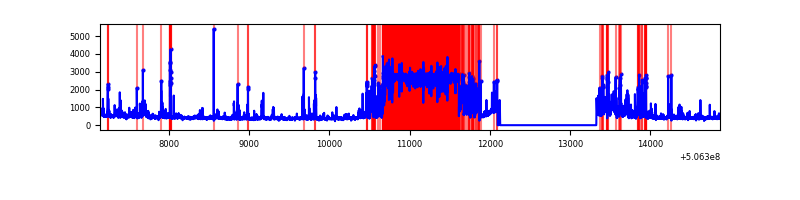 |
Top three noisy pixels from each quadrant. If the there are fewer than three noisy pixels in the level2.evt file, extra rows are filled as -1
| Pixel properties | Quadrant properties | ||||||
|---|---|---|---|---|---|---|---|
| Quadrant | DetID | PixID | Counts | Sigma | Mean | Median | Sigma |
| A | 12 | 115 | 2470371 | 14756.8 | 679 | 664 | 167.4 |
| A | 15 | 32 | 1456170 | 8696.83 | 679 | 664 | 167.4 |
| A | 7 | 64 | 285627 | 1702.69 | 679 | 664 | 167.4 |
| B | 2 | 249 | 4430371 | 32157.9 | 640 | 618 | 137.8 |
| B | 4 | 206 | 213100 | 1542.52 | 640 | 618 | 137.8 |
| B | 7 | 0 | 109818 | 792.74 | 640 | 618 | 137.8 |
| C | 15 | 199 | 481534 | 2520.76 | 691 | 684 | 190.8 |
| C | 12 | 252 | 57640 | 298.58 | 691 | 684 | 190.8 |
| C | 12 | 250 | 48917 | 252.85 | 691 | 684 | 190.8 |
| D | 11 | 129 | 3168388 | 17703.92 | 624 | 596 | 178.9 |
| D | 3 | 12 | 161352 | 898.42 | 624 | 596 | 178.9 |
| D | 7 | 129 | 59546 | 329.45 | 624 | 596 | 178.9 |
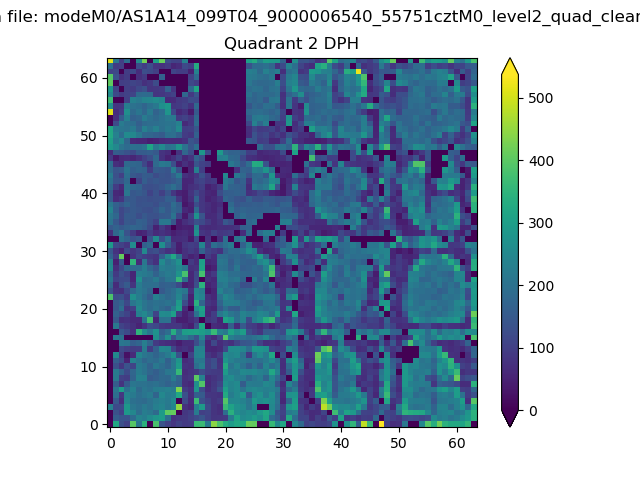
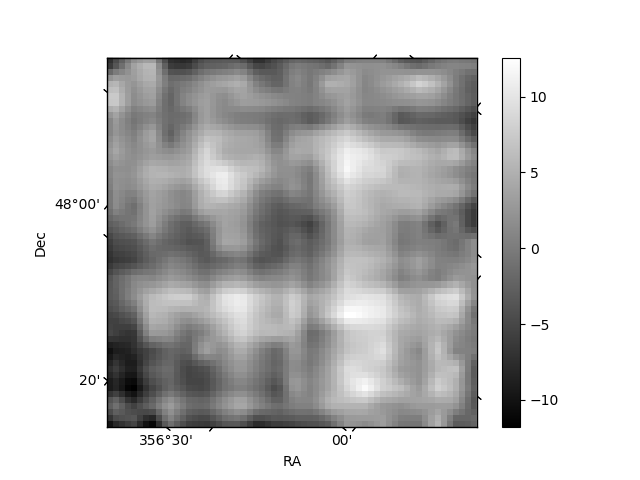
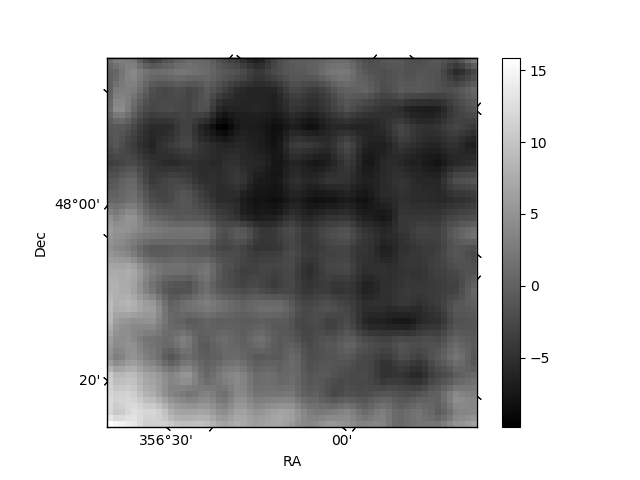
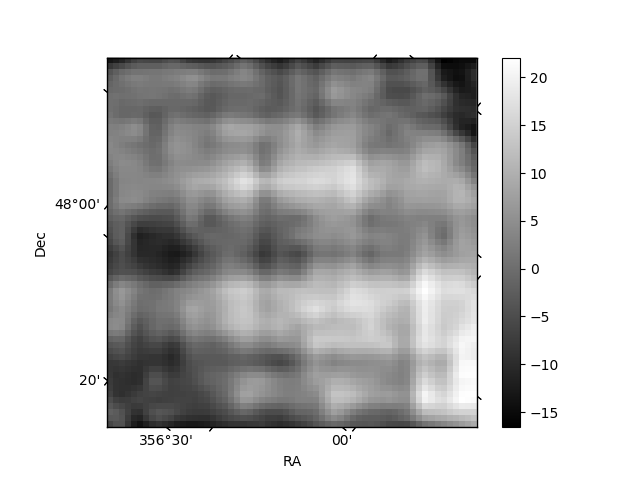
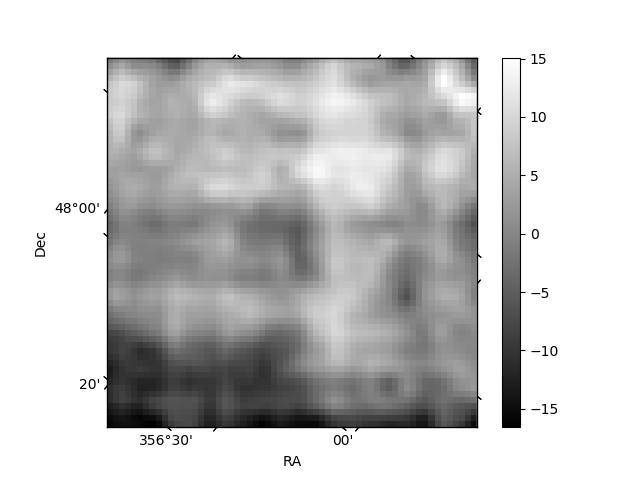
Histogram calculated using DETX and DETY for each event in the final _common_clean file
| Quadrant A | 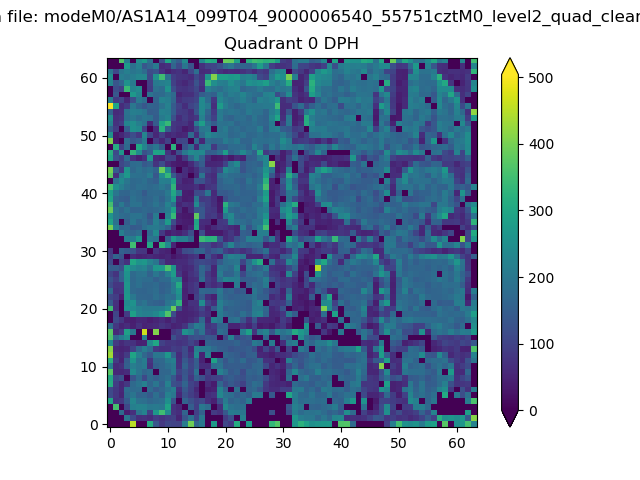 |
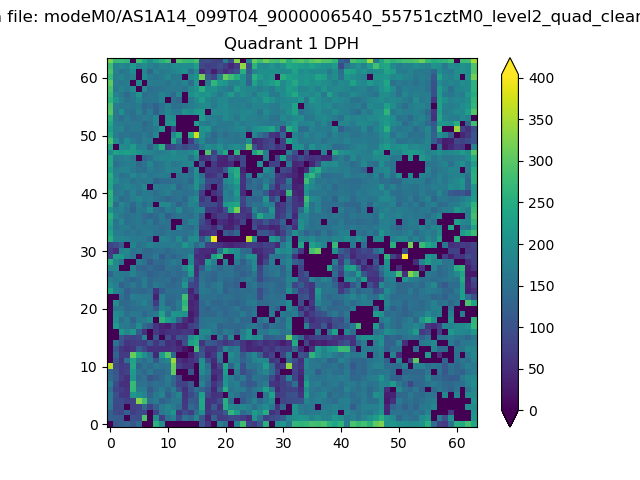 |
Quadrant B |
|---|---|---|---|
| Quadrant D | 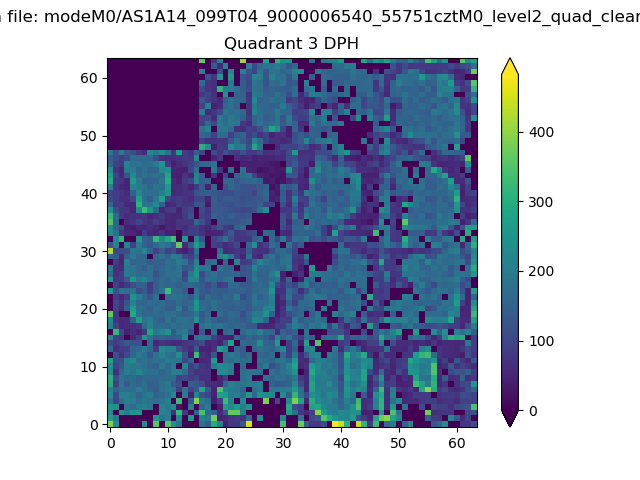 |
 |
Quadrant C |
| Plot type | Count rate plots | Images |
|---|---|---|
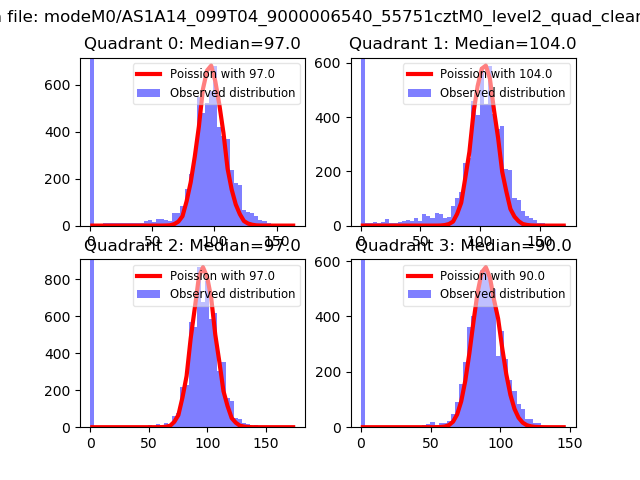
| Comparison with Poisson distribution Blue bars denote a histogram of data divided into 1 sec bins. Red curve is a Poisson curve with rate = median count rate of data. |
 |
 |
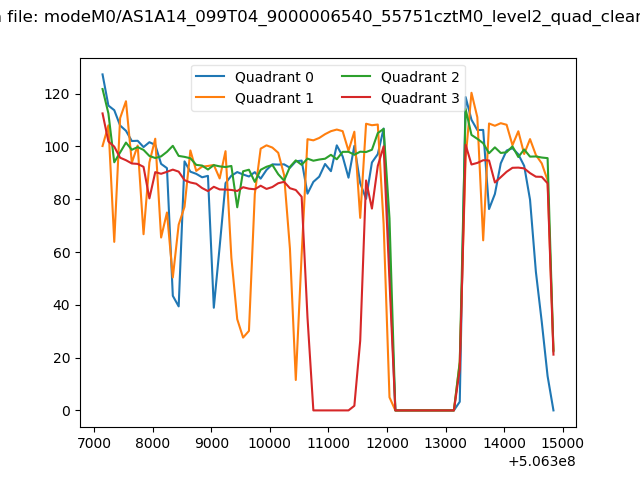
| Quadrant-wise count rates Data is divided into 100 sec bins |
 |
|
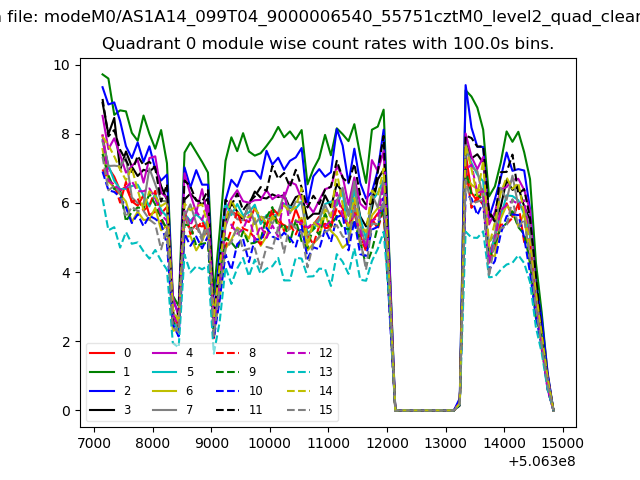
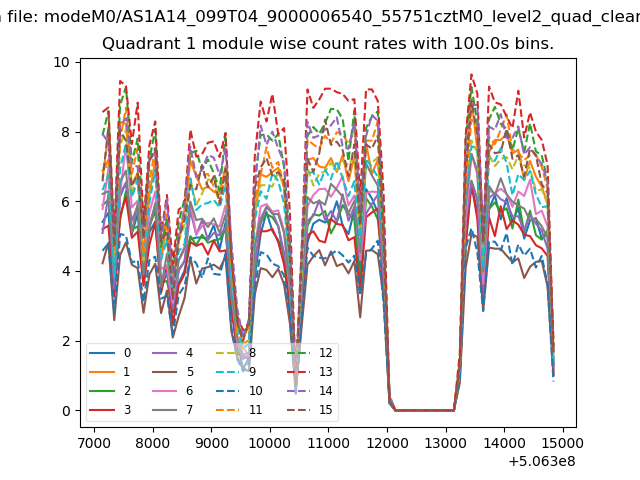
| Module-wise count rates for Quadrant A Data is divided into 100 sec bins |
 |
 |
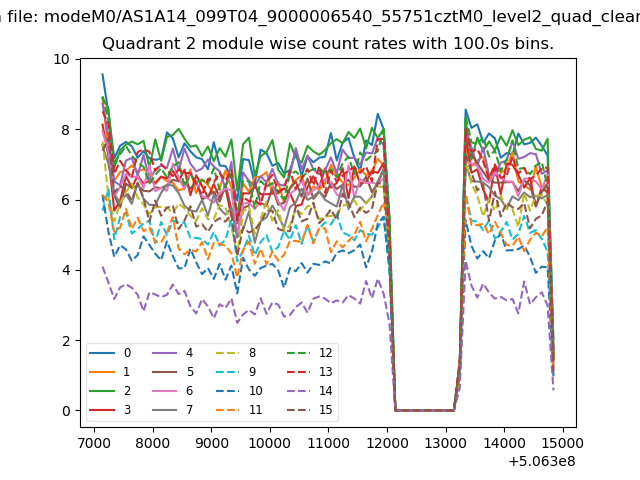
| Module-wise count rates for Quadrant B Data is divided into 100 sec bins |
 |
 |
| Module-wise count rates for Quadrant C Data is divided into 100 sec bins |
 |
 |
| Module-wise count rates for Quadrant D Data is divided into 100 sec bins |
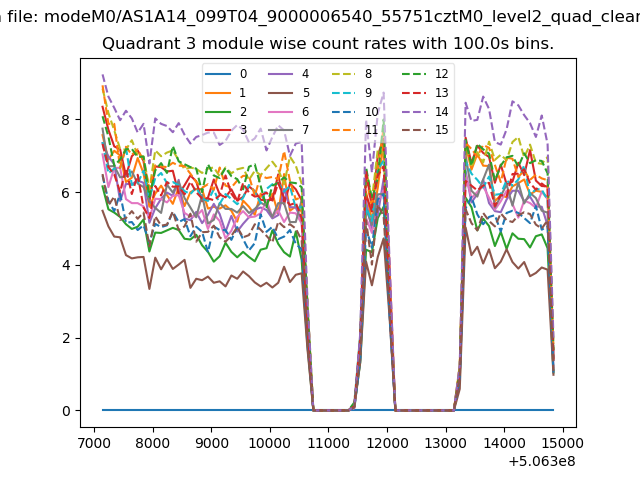 |
 |
| Parameter | Plot |
|---|---|
| CZT HV Monitor | 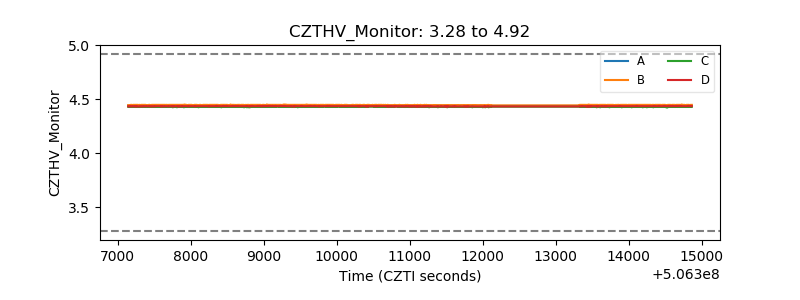 |
| D_VDD | 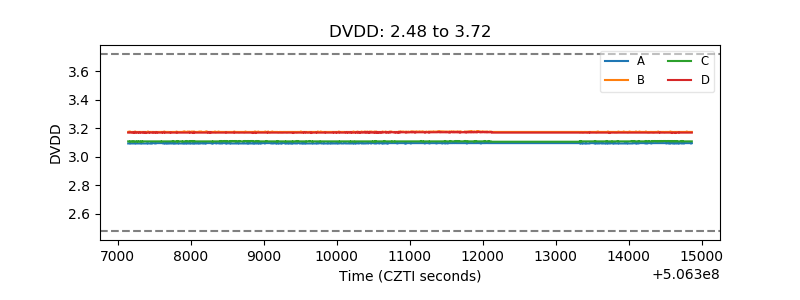 |
| Temperature 1 | 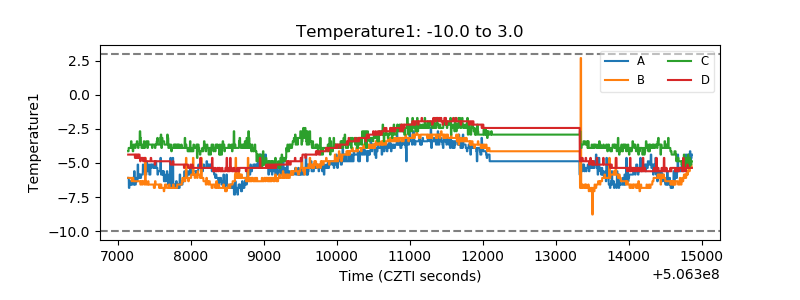 |
| Veto HV Monitor | 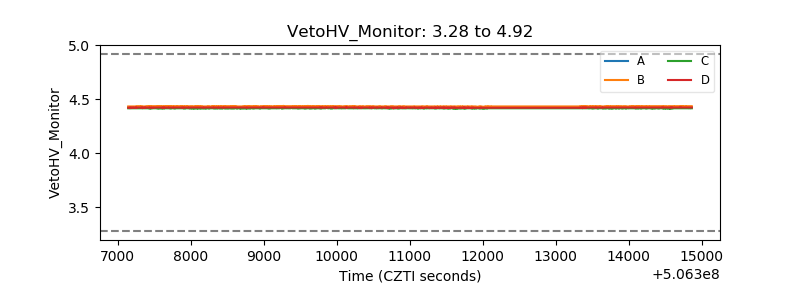 |
| Veto LLD | 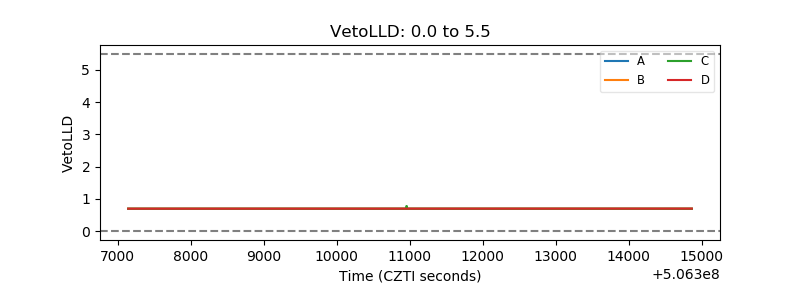 |
| Alpha Counter | 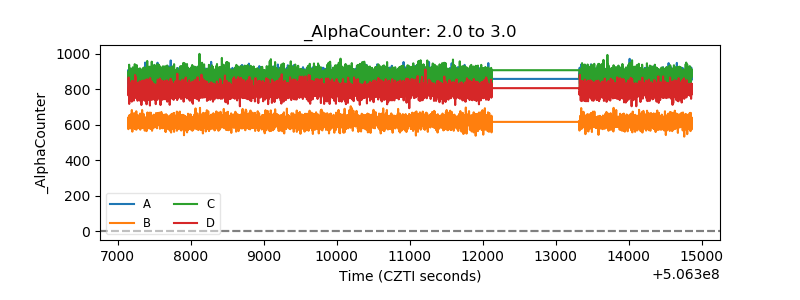 |
| _CPM_Rate | 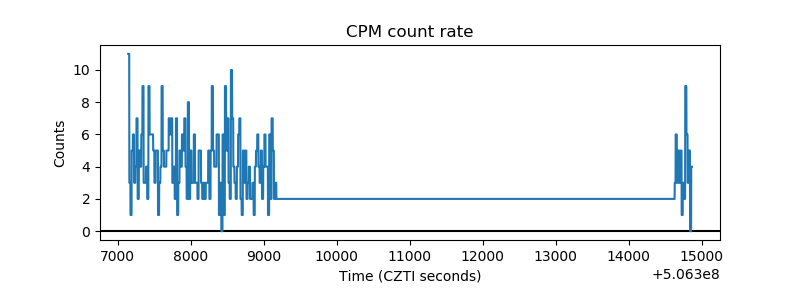 |
| CZT Counter | 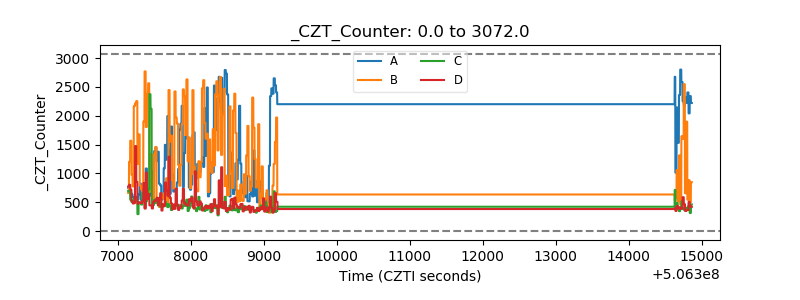 |
| +2.5 Volts monitor |  |
| +5 Volts monitor |  |
| _ROLL_ROT | 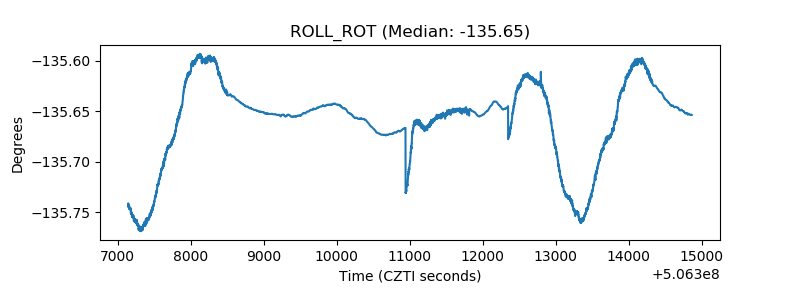 |
| _Roll_DEC | 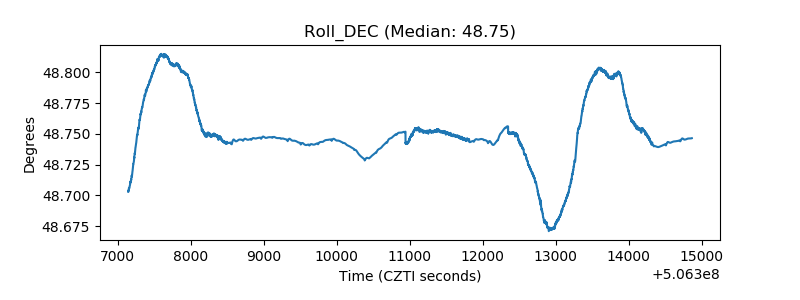 |
| _Roll_RA | 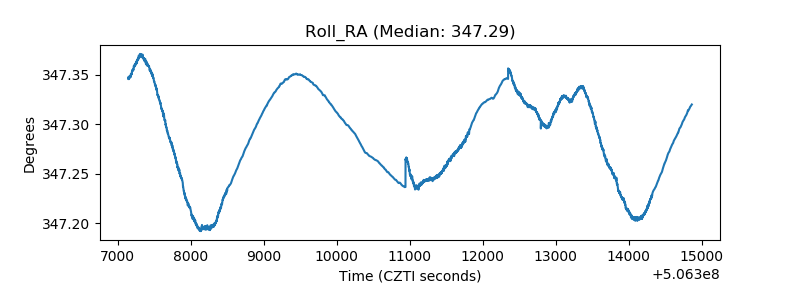 |
| Veto Counter | 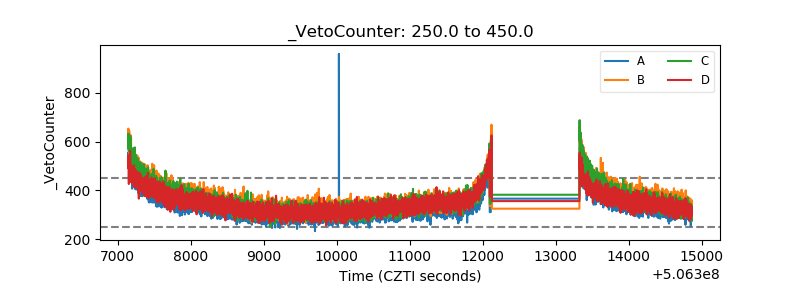 |