| Param | Original file | Final file |
|---|---|---|
| Filename | modeM0/AS1A14_099T04_9000006540_55752cztM0_level2.fits | modeM0/AS1A14_099T04_9000006540_55752cztM0_level2_quad_clean.evt |
| Size (bytes) | 655,211,520 | 80,110,080 |
| Size | 624.9 MB | 76.4 MB |
| Events in quadrant A | 11,709,741 | 289,084 |
| Events in quadrant B | 5,744,442 | 570,565 |
| Events in quadrant C | 3,033,763 | 588,975 |
| Events in quadrant D | 3,284,515 | 544,441 |
| Mode M0 | |||
|---|---|---|---|
| Quadrant | BADHDUFLAG | Total packets | Discarded packets |
| A | 0 | 39047 | 1 |
| B | 0 | 21297 | 1 |
| C | 0 | 13606 | 1 |
| D | 0 | 14392 | 1 |
| Mode M9 | |||
|---|---|---|---|
| Quadrant | BADHDUFLAG | Total packets | Discarded packets |
| A | 0 | 11 | 0 |
| B | 0 | 11 | 0 |
| C | 0 | 11 | 0 |
| D | 0 | 11 | 0 |
| Mode SS | |||
|---|---|---|---|
| Quadrant | BADHDUFLAG | Total packets | Discarded packets |
| A | 0 | 126 | 0 |
| B | 0 | 126 | 0 |
| C | 0 | 126 | 0 |
| D | 0 | 126 | 0 |
| Quadrant | Total seconds | Saturated seconds | Saturation percentage |
|---|---|---|---|
| A | 6195 | 3488 | 56.303471% |
| B | 6196 | 987 | 15.929632% |
| C | 6196 | 70 | 1.129761% |
| D | 6196 | 140 | 2.259522% |
Noise dominated data is calculated using 1-second bins in cleaned event files. If a bin has >2000 counts, and if more than 50% of those come from <1% of pixels, then it is considered to be noise-dominated and hence unusable.
| Quadrant | # 1 sec bins | Bins with >0 counts | Bins with >2000 counts | High rate bins dominated by noise | Noise dominated (total time) | Noise dominated (detector-on time) | Marked lightcurve |
|---|---|---|---|---|---|---|---|
| A | 7310 | 6196 | 3184 | 3184 | 43.56% | 51.39% | 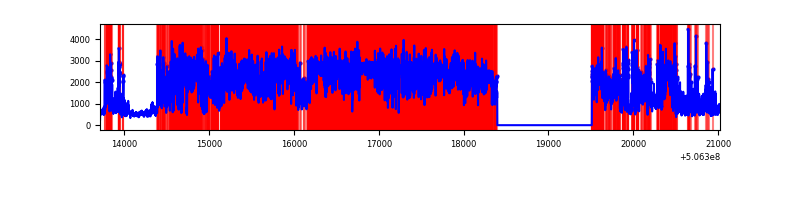 |
| B | 7311 | 6196 | 600 | 600 | 8.21% | 9.68% | 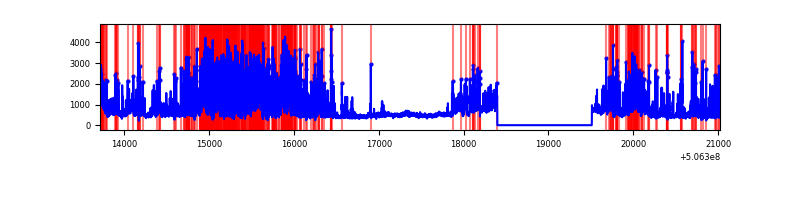 |
| C | 7311 | 6197 | 23 | 23 | 0.31% | 0.37% | 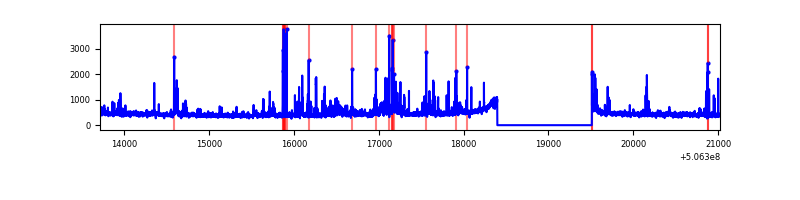 |
| D | 7311 | 6197 | 82 | 82 | 1.12% | 1.32% | 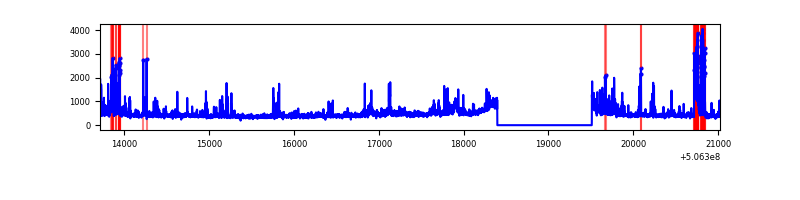 |
Top three noisy pixels from each quadrant. If the there are fewer than three noisy pixels in the level2.evt file, extra rows are filled as -1
| Pixel properties | Quadrant properties | ||||||
|---|---|---|---|---|---|---|---|
| Quadrant | DetID | PixID | Counts | Sigma | Mean | Median | Sigma |
| A | 12 | 115 | 6564286 | 51420.73 | 514 | 499 | 127.6 |
| A | 15 | 32 | 2333924 | 18280.06 | 514 | 499 | 127.6 |
| A | 7 | 64 | 513237 | 4016.79 | 514 | 499 | 127.6 |
| B | 2 | 249 | 3080423 | 23130.79 | 624 | 603 | 133.1 |
| B | 7 | 0 | 99741 | 744.57 | 624 | 603 | 133.1 |
| B | 5 | 172 | 24702 | 180.99 | 624 | 603 | 133.1 |
| C | 12 | 252 | 215811 | 1188.99 | 654 | 647 | 181.0 |
| C | 6 | 223 | 83315 | 456.82 | 654 | 647 | 181.0 |
| C | 13 | 3 | 80806 | 442.96 | 654 | 647 | 181.0 |
| D | 11 | 129 | 617442 | 3379.88 | 646 | 618 | 182.5 |
| D | 7 | 129 | 41605 | 224.59 | 646 | 618 | 182.5 |
| D | 3 | 12 | 39636 | 213.8 | 646 | 618 | 182.5 |
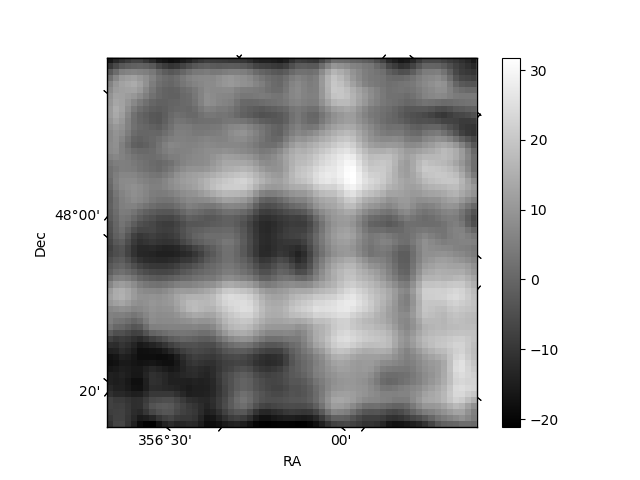
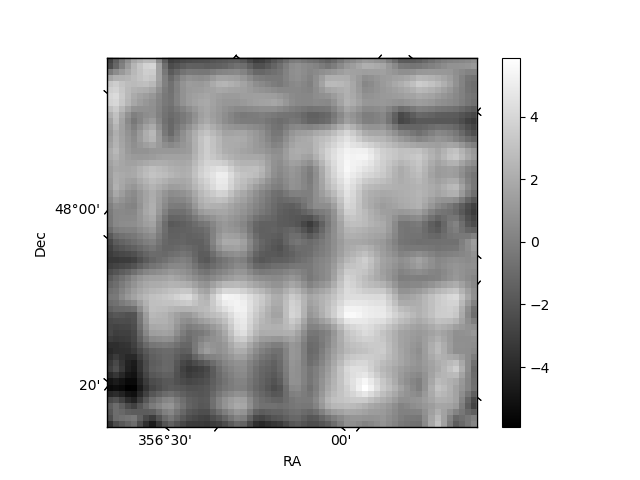
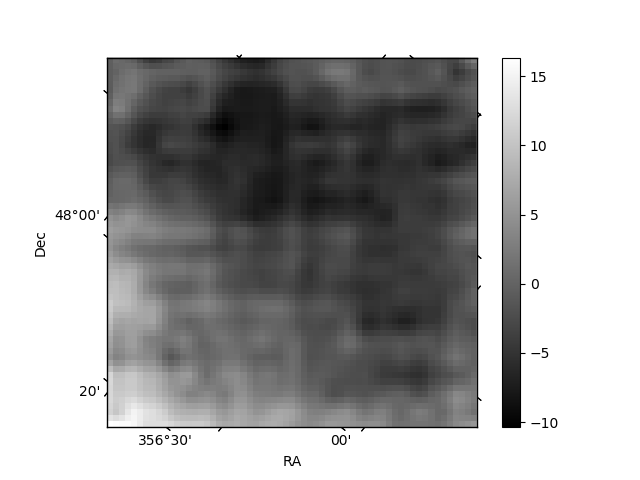
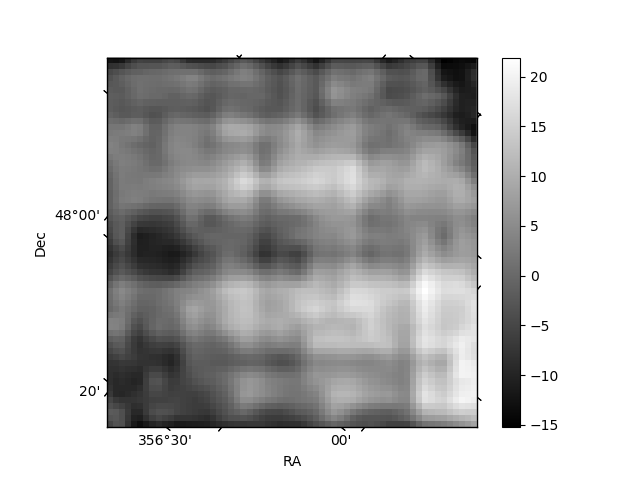
Histogram calculated using DETX and DETY for each event in the final _common_clean file
| Quadrant A | 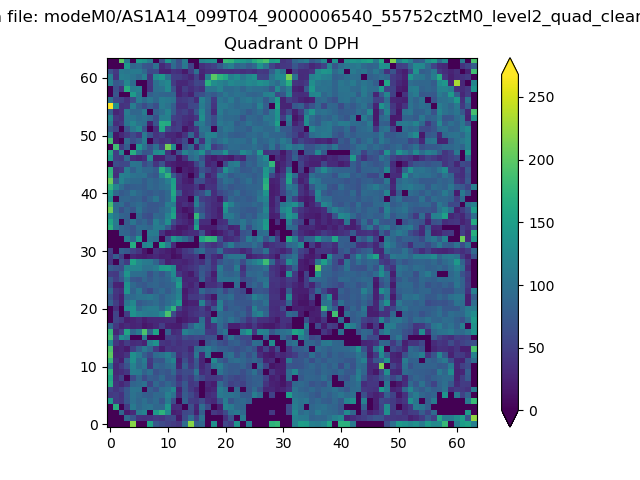 |
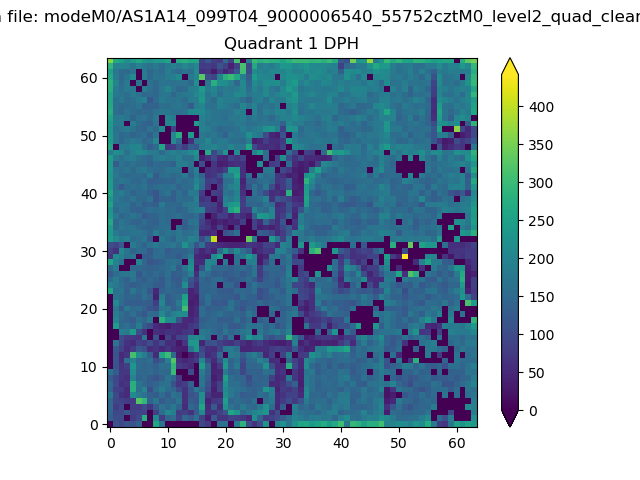 |
Quadrant B |
|---|---|---|---|
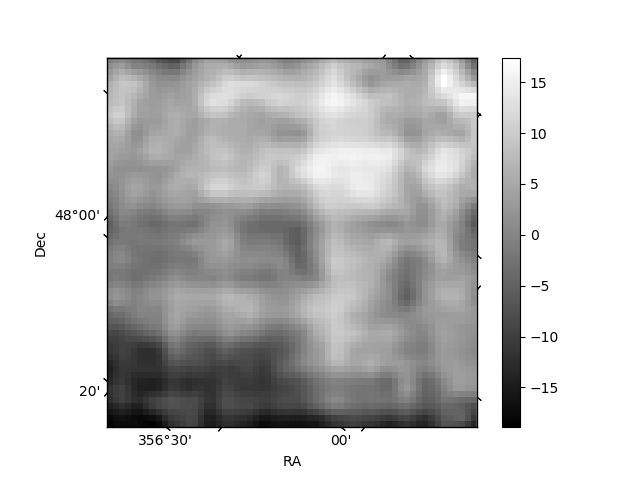
| Quadrant D | 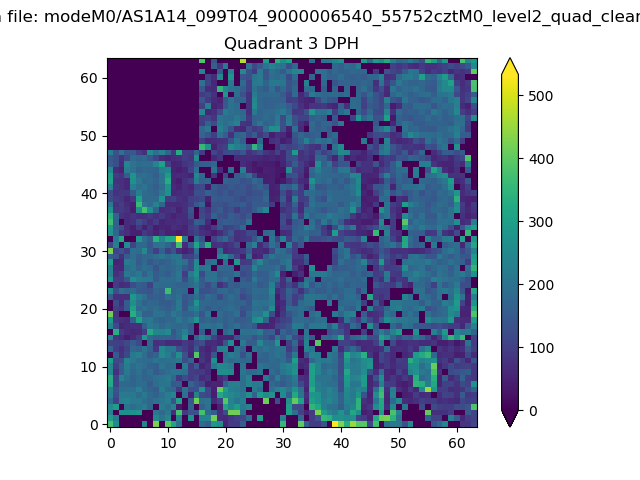 |
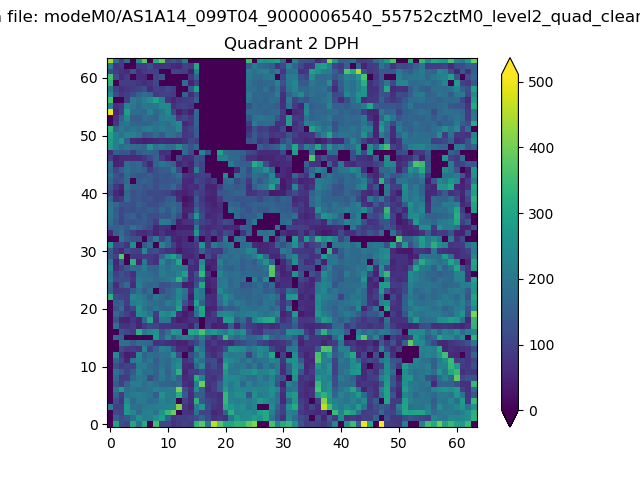 |
Quadrant C |
| Plot type | Count rate plots | Images |
|---|---|---|
| Comparison with Poisson distribution Blue bars denote a histogram of data divided into 1 sec bins. Red curve is a Poisson curve with rate = median count rate of data. |
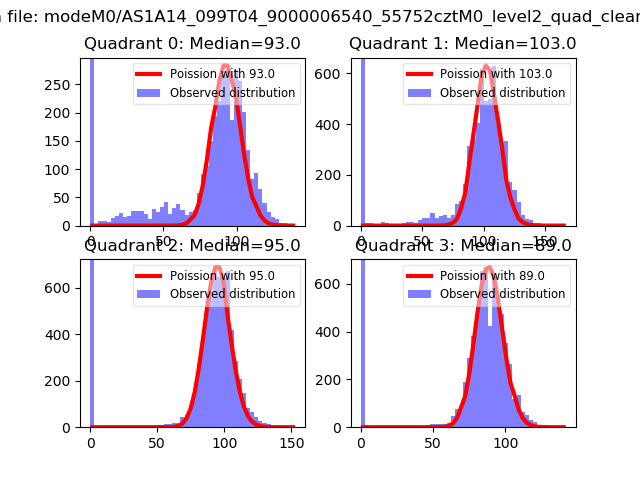 |
 |
| Quadrant-wise count rates Data is divided into 100 sec bins |
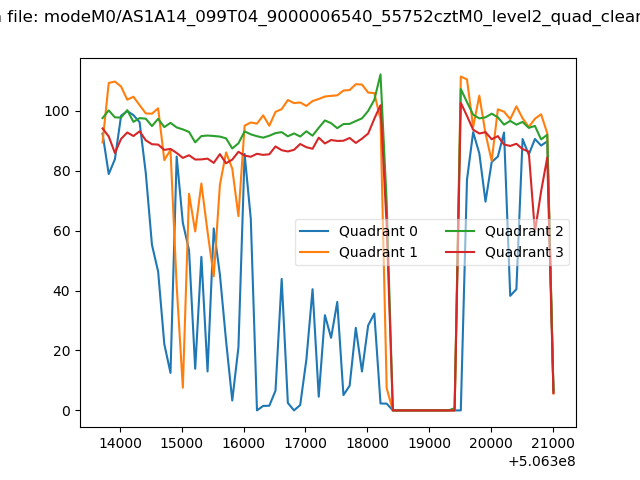 |
|
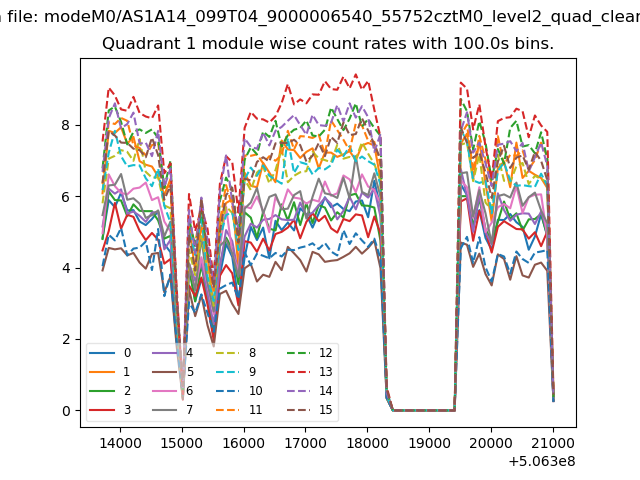
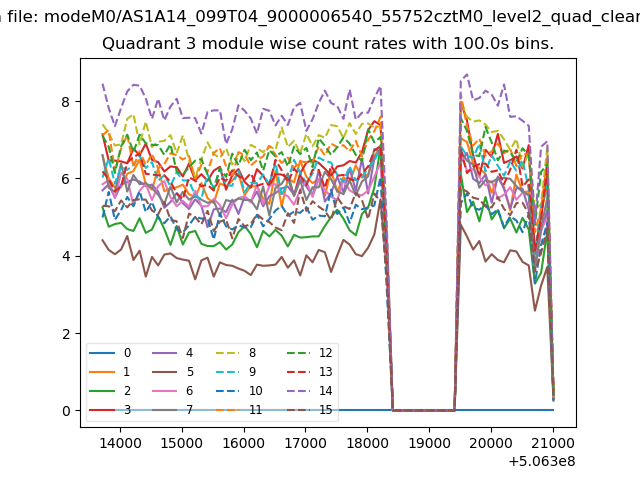
| Module-wise count rates for Quadrant A Data is divided into 100 sec bins |
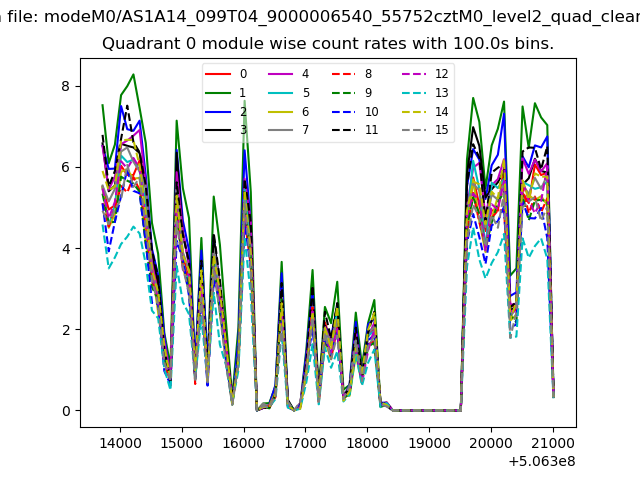 |
 |
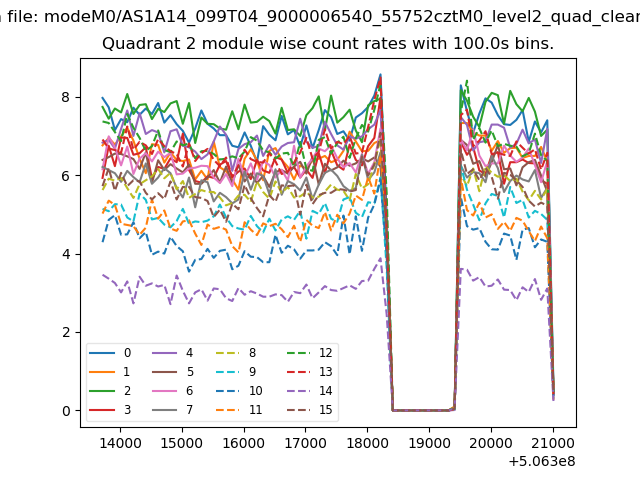
| Module-wise count rates for Quadrant B Data is divided into 100 sec bins |
 |
 |
| Module-wise count rates for Quadrant C Data is divided into 100 sec bins |
 |
 |
| Module-wise count rates for Quadrant D Data is divided into 100 sec bins |
 |
 |
| Parameter | Plot |
|---|---|
| CZT HV Monitor | 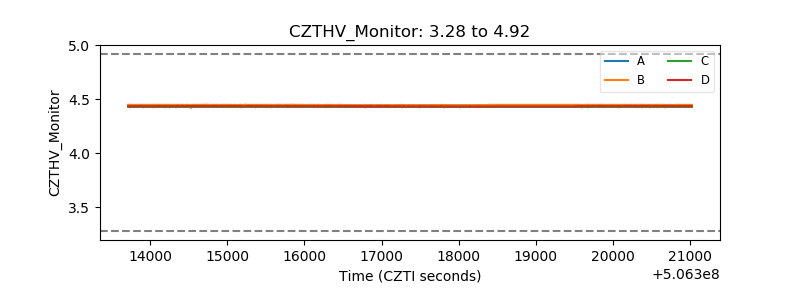 |
| D_VDD | 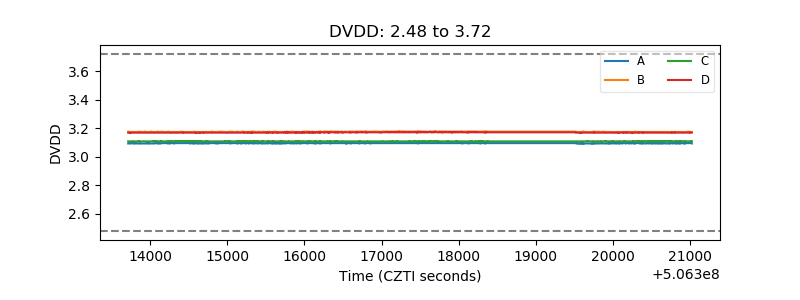 |
| Temperature 1 | 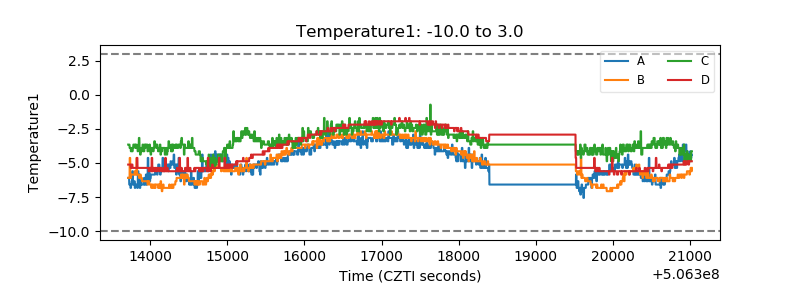 |
| Veto HV Monitor | 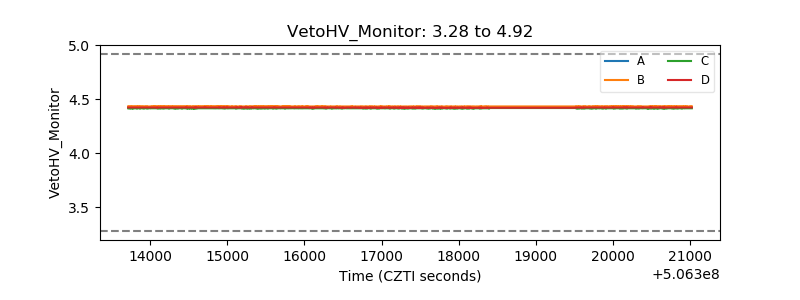 |
| Veto LLD | 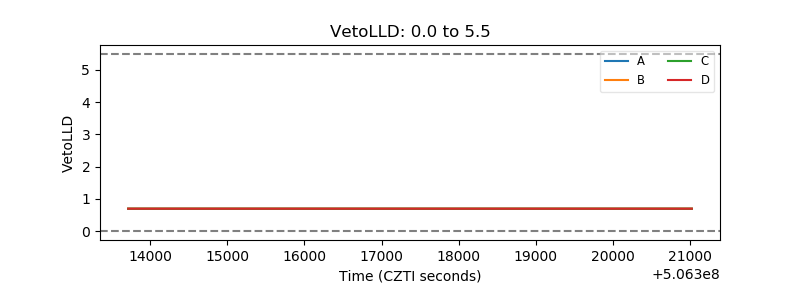 |
| Alpha Counter | 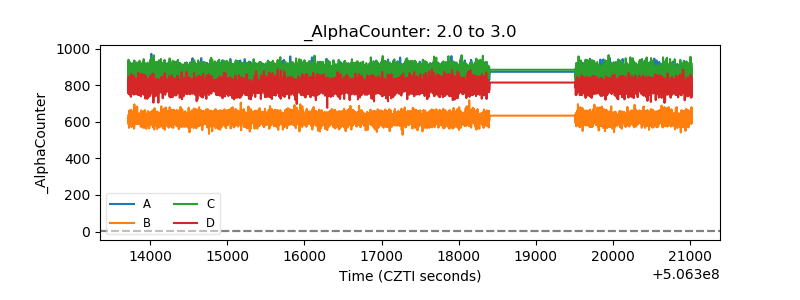 |
| _CPM_Rate | 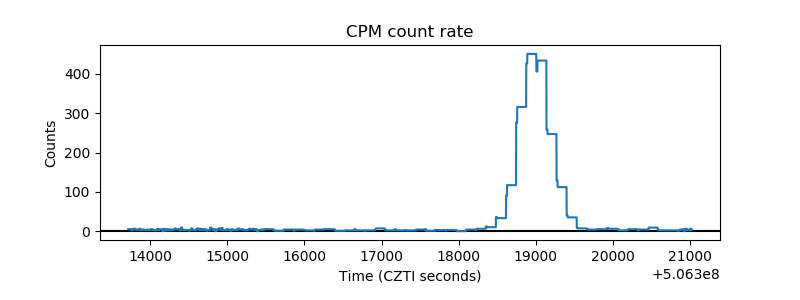 |
| CZT Counter | 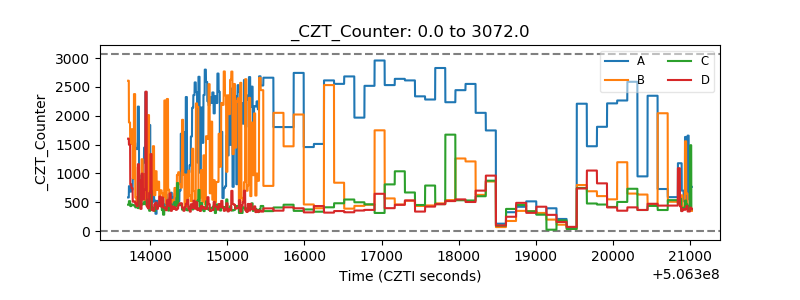 |
| +2.5 Volts monitor |  |
| +5 Volts monitor |  |
| _ROLL_ROT | 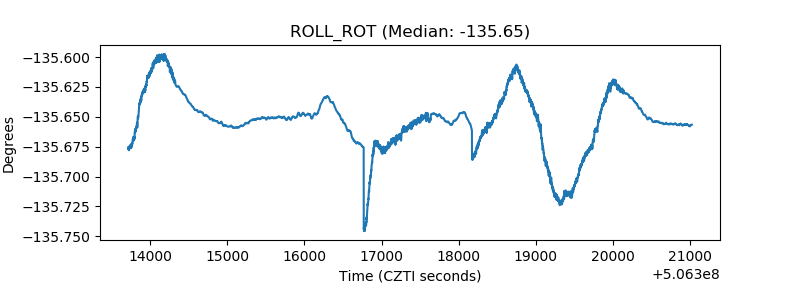 |
| _Roll_DEC | 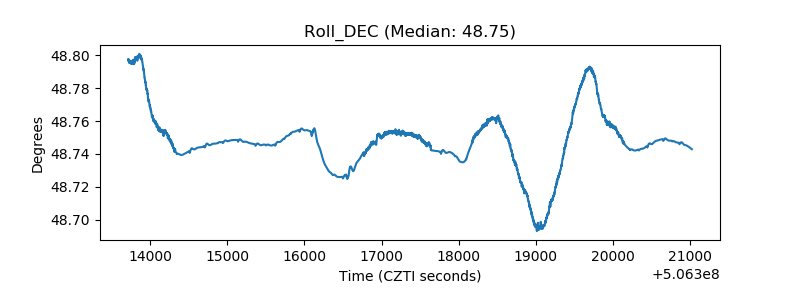 |
| _Roll_RA | 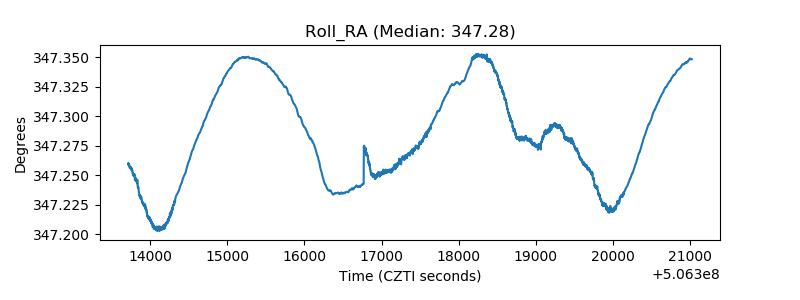 |
| Veto Counter | 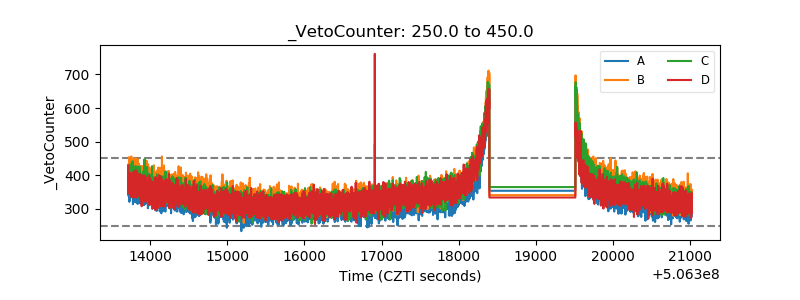 |