| Param | Original file | Final file |
|---|---|---|
| Filename | modeM0/AS1A14_099T04_9000006540_55753cztM0_level2.fits | modeM0/AS1A14_099T04_9000006540_55753cztM0_level2_quad_clean.evt |
| Size (bytes) | 576,509,760 | 79,922,880 |
| Size | 549.8 MB | 76.2 MB |
| Events in quadrant A | 9,655,155 | 369,248 |
| Events in quadrant B | 3,511,188 | 592,298 |
| Events in quadrant C | 2,872,884 | 556,514 |
| Events in quadrant D | 4,831,955 | 479,787 |
| Mode M0 | |||
|---|---|---|---|
| Quadrant | BADHDUFLAG | Total packets | Discarded packets |
| A | 0 | 32882 | 1 |
| B | 0 | 14810 | 1 |
| C | 0 | 13161 | 1 |
| D | 0 | 18848 | 1 |
| Mode M9 | |||
|---|---|---|---|
| Quadrant | BADHDUFLAG | Total packets | Discarded packets |
| A | 0 | 9 | 0 |
| B | 0 | 9 | 0 |
| C | 0 | 9 | 0 |
| D | 0 | 9 | 0 |
| Mode SS | |||
|---|---|---|---|
| Quadrant | BADHDUFLAG | Total packets | Discarded packets |
| A | 0 | 124 | 0 |
| B | 0 | 124 | 0 |
| C | 0 | 124 | 0 |
| D | 0 | 124 | 0 |
| Quadrant | Total seconds | Saturated seconds | Saturation percentage |
|---|---|---|---|
| A | 6040 | 2316 | 38.344371% |
| B | 6041 | 321 | 5.313690% |
| C | 6041 | 106 | 1.754676% |
| D | 6041 | 615 | 10.180434% |
Noise dominated data is calculated using 1-second bins in cleaned event files. If a bin has >2000 counts, and if more than 50% of those come from <1% of pixels, then it is considered to be noise-dominated and hence unusable.
| Quadrant | # 1 sec bins | Bins with >0 counts | Bins with >2000 counts | High rate bins dominated by noise | Noise dominated (total time) | Noise dominated (detector-on time) | Marked lightcurve |
|---|---|---|---|---|---|---|---|
| A | 6955 | 6040 | 1971 | 1971 | 28.34% | 32.63% | 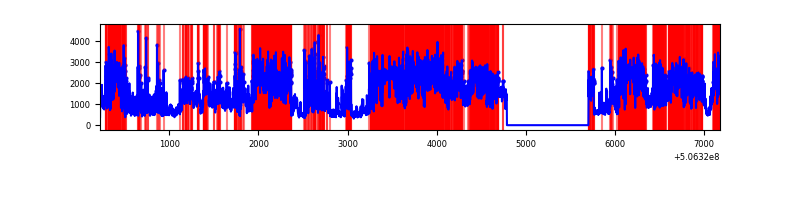 |
| B | 6956 | 6041 | 116 | 116 | 1.67% | 1.92% | 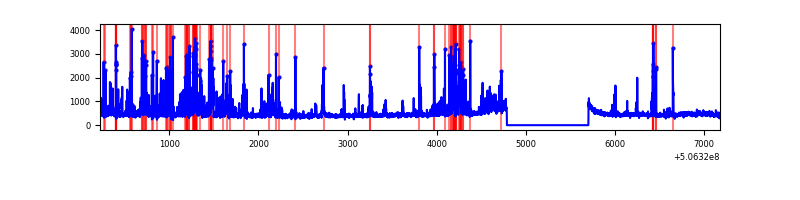 |
| C | 6956 | 6042 | 19 | 19 | 0.27% | 0.31% | 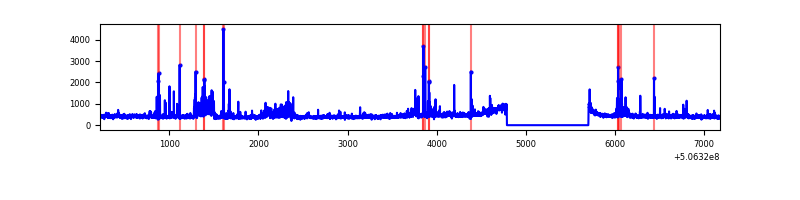 |
| D | 6956 | 6041 | 484 | 484 | 6.96% | 8.01% | 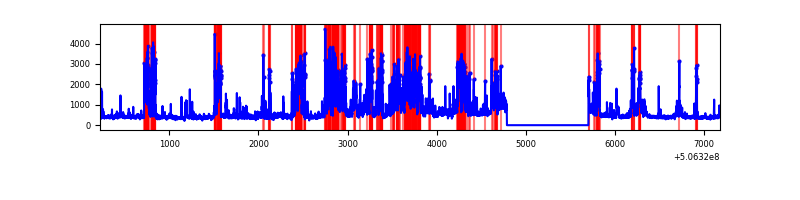 |
Top three noisy pixels from each quadrant. If the there are fewer than three noisy pixels in the level2.evt file, extra rows are filled as -1
| Pixel properties | Quadrant properties | ||||||
|---|---|---|---|---|---|---|---|
| Quadrant | DetID | PixID | Counts | Sigma | Mean | Median | Sigma |
| A | 15 | 32 | 3492548 | 26474.47 | 537 | 521 | 131.9 |
| A | 12 | 115 | 3392535 | 25716.23 | 537 | 521 | 131.9 |
| A | 7 | 64 | 289147 | 2188.19 | 537 | 521 | 131.9 |
| B | 2 | 249 | 854681 | 6363.6 | 629 | 608 | 134.2 |
| B | 10 | 247 | 42960 | 315.56 | 629 | 608 | 134.2 |
| B | 7 | 0 | 38662 | 283.54 | 629 | 608 | 134.2 |
| C | 12 | 252 | 130773 | 748.87 | 631 | 623 | 173.8 |
| C | 14 | 96 | 85958 | 491.01 | 631 | 623 | 173.8 |
| C | 6 | 223 | 85207 | 486.69 | 631 | 623 | 173.8 |
| D | 11 | 129 | 2348729 | 13740.8 | 605 | 577 | 170.9 |
| D | 3 | 12 | 80233 | 466.13 | 605 | 577 | 170.9 |
| D | 5 | 173 | 40066 | 231.08 | 605 | 577 | 170.9 |
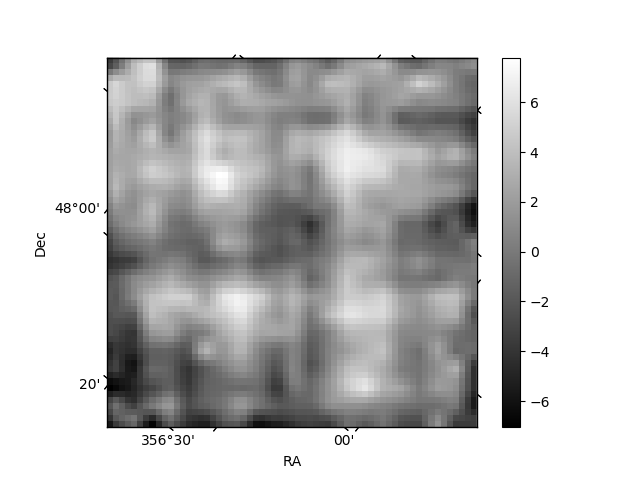
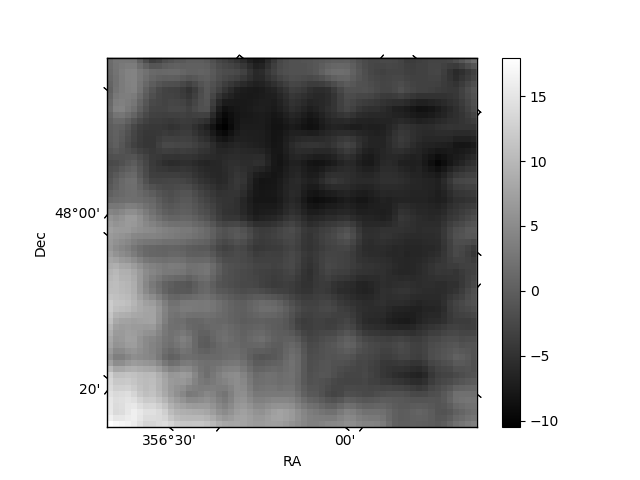
Histogram calculated using DETX and DETY for each event in the final _common_clean file
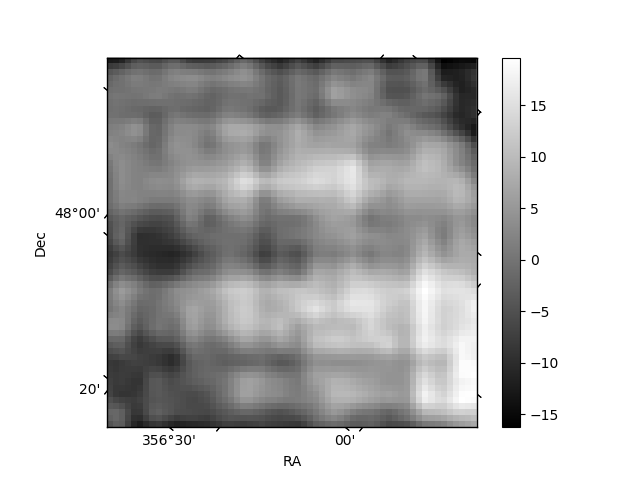
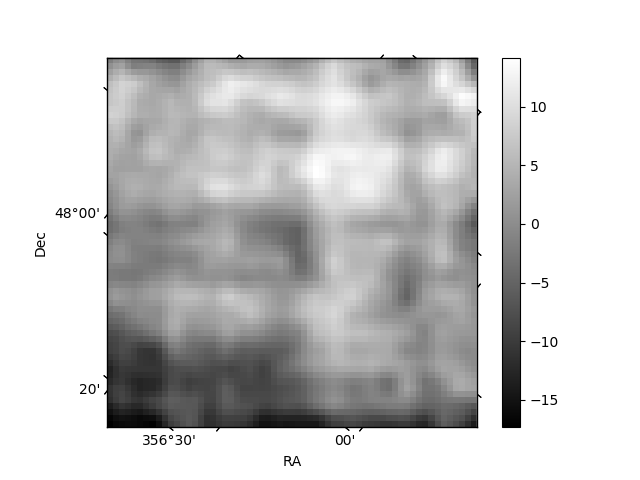
| Quadrant A | 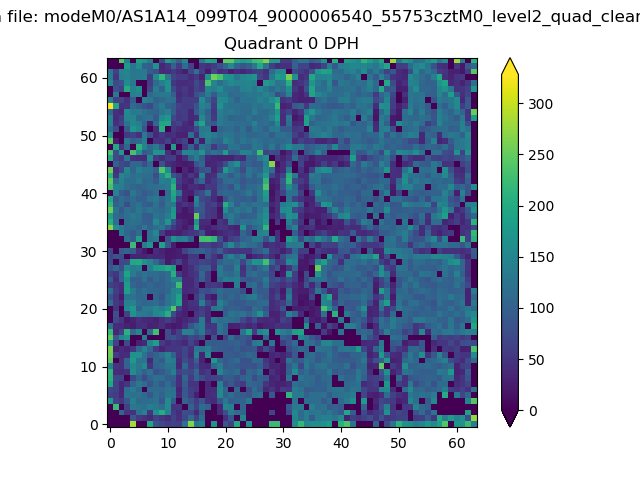 |
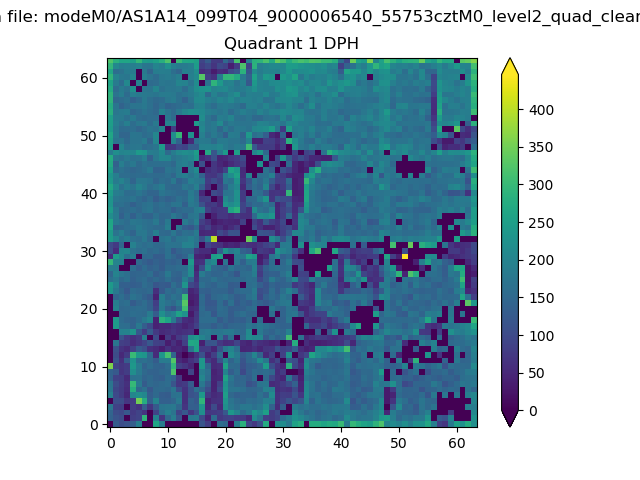 |
Quadrant B |
|---|---|---|---|
| Quadrant D | 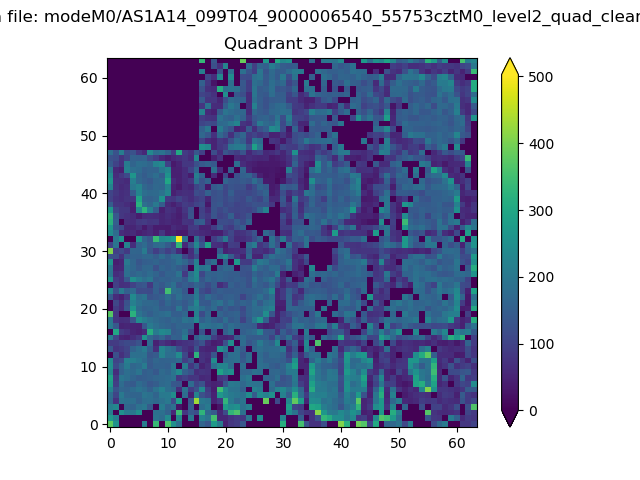 |
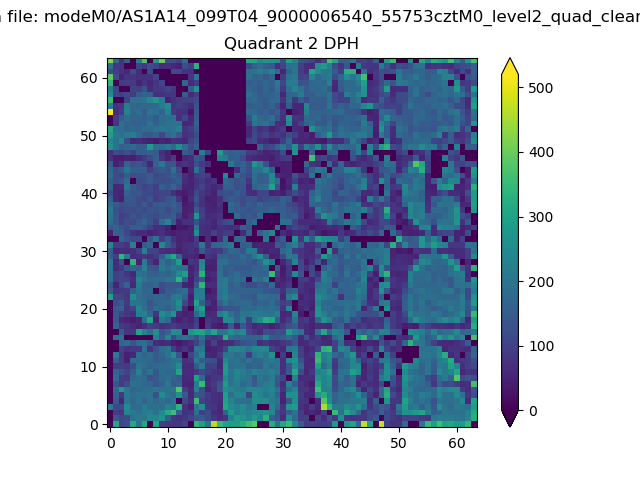 |
Quadrant C |
| Plot type | Count rate plots | Images |
|---|---|---|
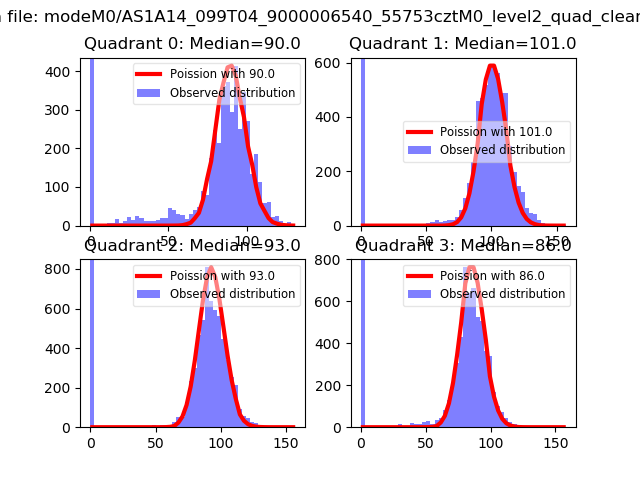
| Comparison with Poisson distribution Blue bars denote a histogram of data divided into 1 sec bins. Red curve is a Poisson curve with rate = median count rate of data. |
 |
 |
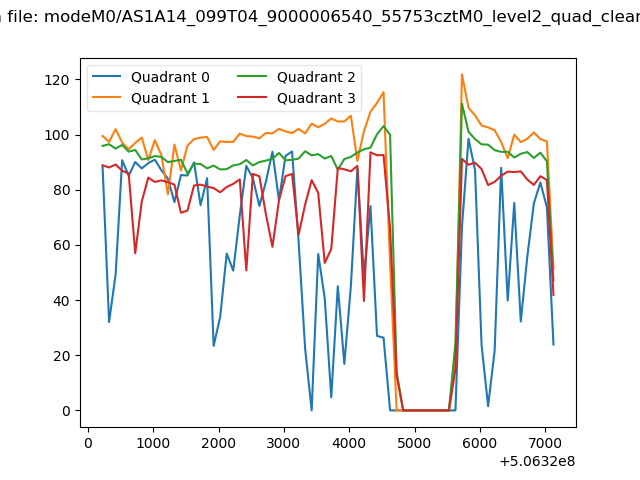
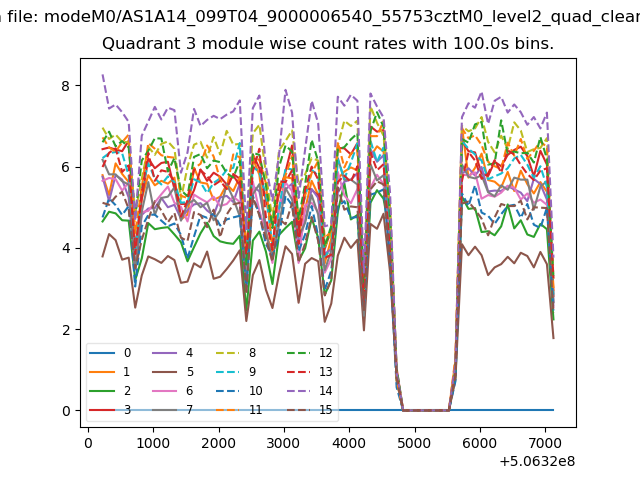
| Quadrant-wise count rates Data is divided into 100 sec bins |
 |
|
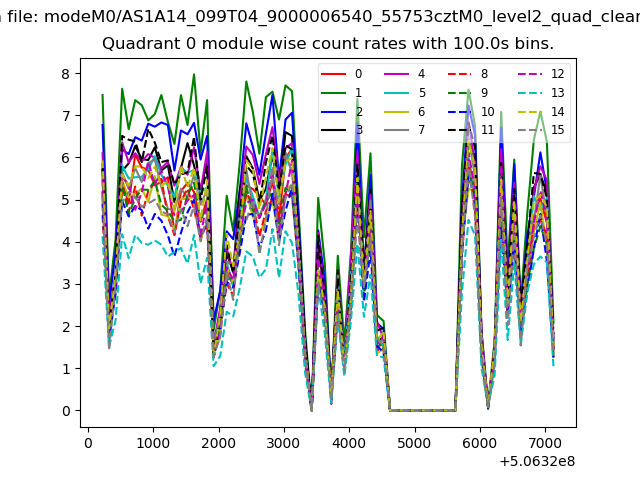
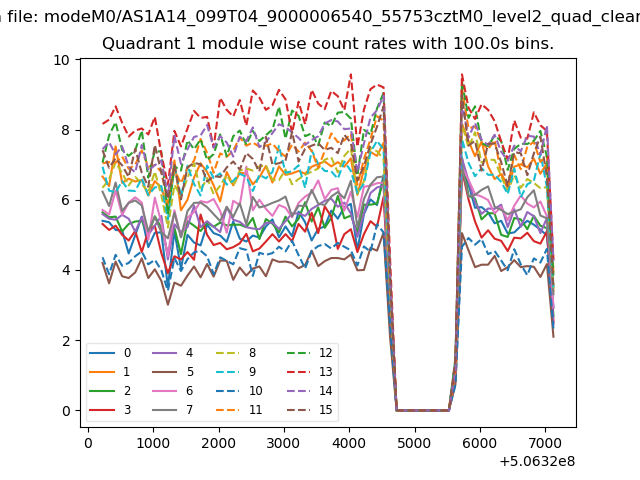
| Module-wise count rates for Quadrant A Data is divided into 100 sec bins |
 |
 |
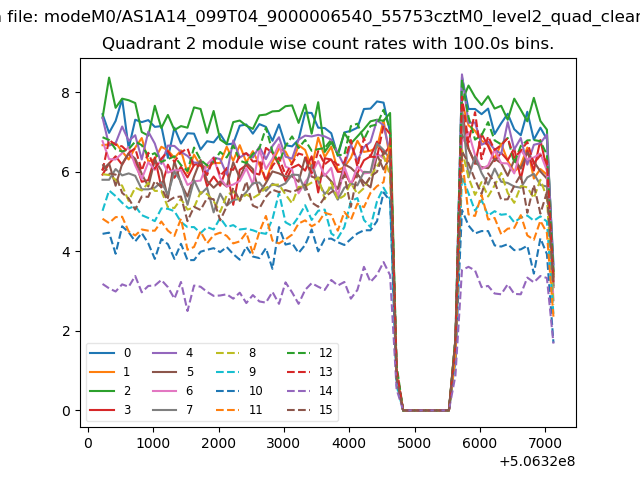
| Module-wise count rates for Quadrant B Data is divided into 100 sec bins |
 |
 |
| Module-wise count rates for Quadrant C Data is divided into 100 sec bins |
 |
 |
| Module-wise count rates for Quadrant D Data is divided into 100 sec bins |
 |
 |
| Parameter | Plot |
|---|---|
| CZT HV Monitor | 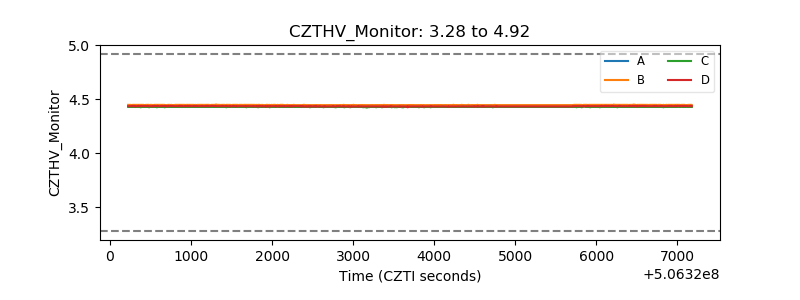 |
| D_VDD | 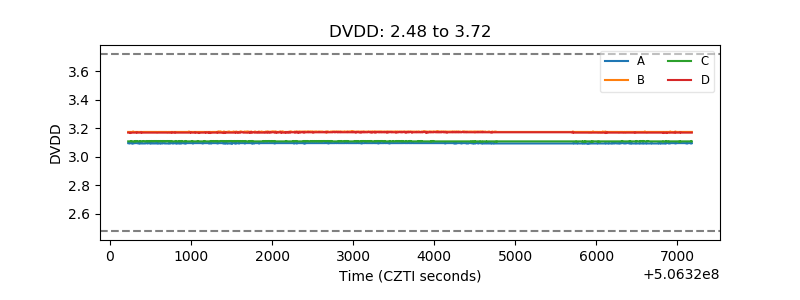 |
| Temperature 1 | 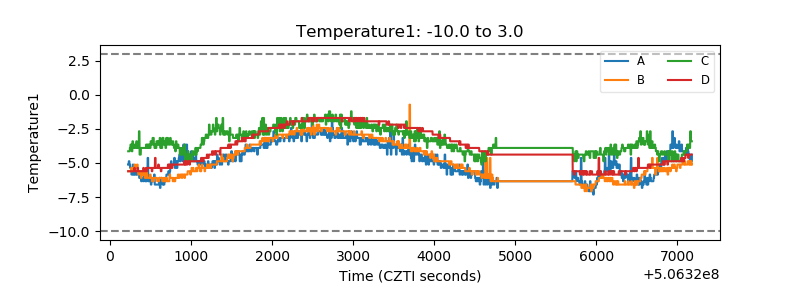 |
| Veto HV Monitor | 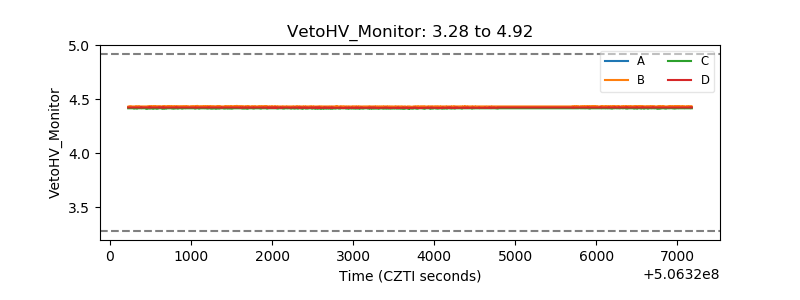 |
| Veto LLD | 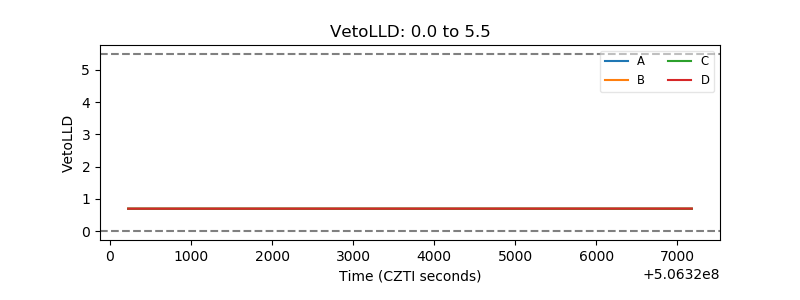 |
| Alpha Counter | 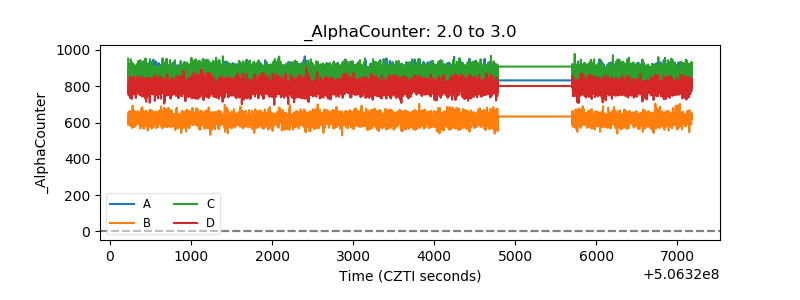 |
| _CPM_Rate | 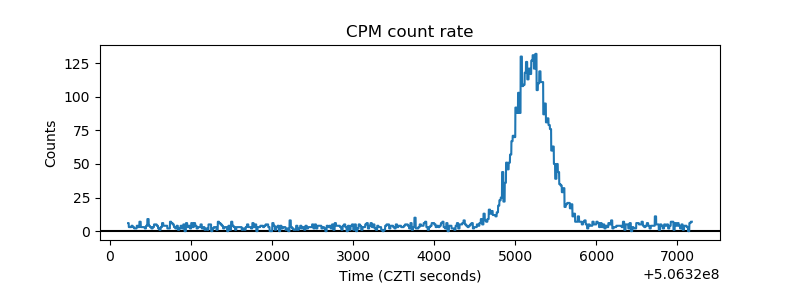 |
| CZT Counter | 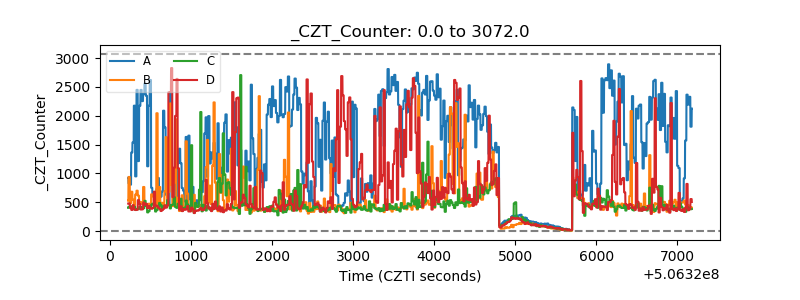 |
| +2.5 Volts monitor |  |
| +5 Volts monitor | 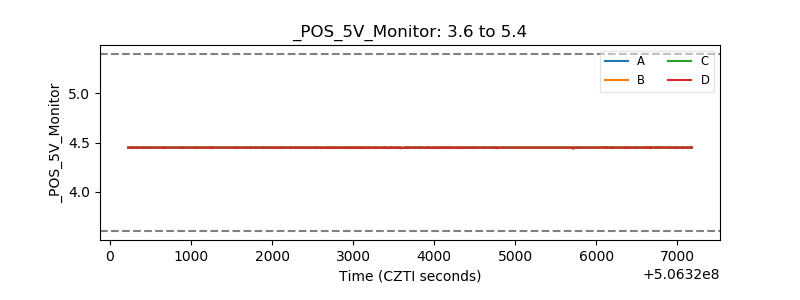 |
| _ROLL_ROT | 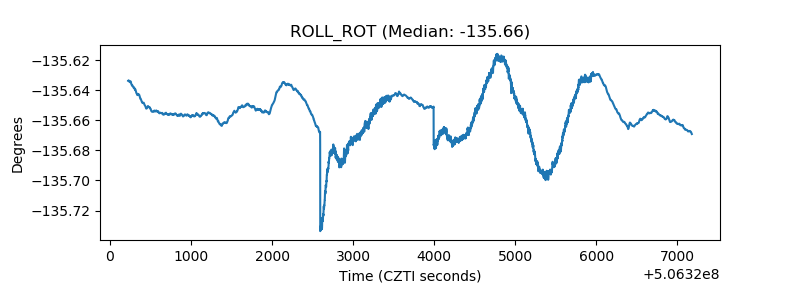 |
| _Roll_DEC | 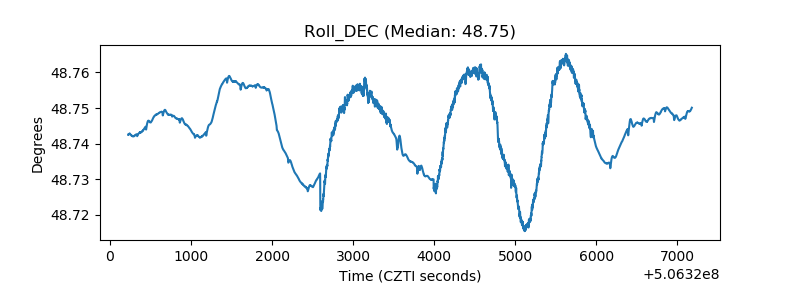 |
| _Roll_RA | 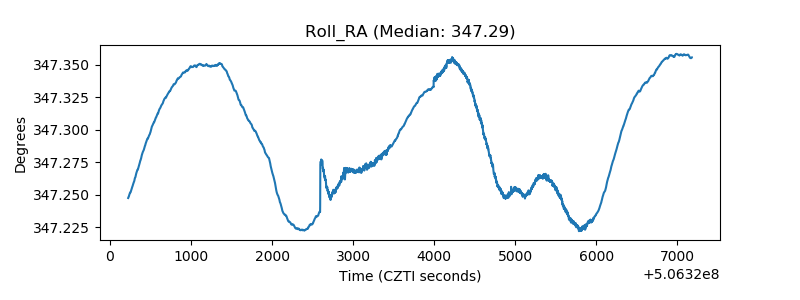 |
| Veto Counter | 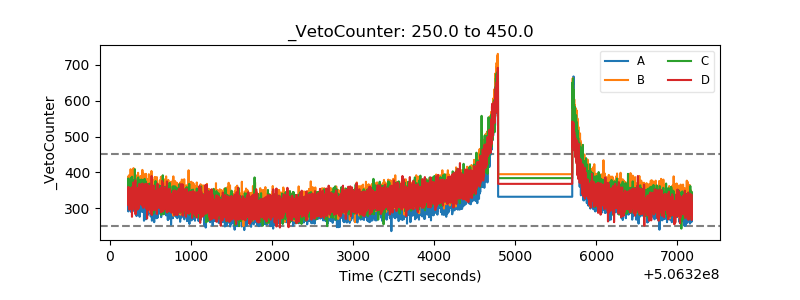 |