| Param | Original file | Final file |
|---|---|---|
| Filename | modeM0/AS1A14_099T04_9000006540_55754cztM0_level2.fits | modeM0/AS1A14_099T04_9000006540_55754cztM0_level2_quad_clean.evt |
| Size (bytes) | 839,784,960 | 81,149,760 |
| Size | 800.9 MB | 77.4 MB |
| Events in quadrant A | 14,075,883 | 240,588 |
| Events in quadrant B | 3,552,440 | 689,348 |
| Events in quadrant C | 4,459,235 | 609,058 |
| Events in quadrant D | 8,464,808 | 438,609 |
| Mode M0 | |||
|---|---|---|---|
| Quadrant | BADHDUFLAG | Total packets | Discarded packets |
| A | 0 | 46496 | 1 |
| B | 0 | 15436 | 1 |
| C | 0 | 18385 | 1 |
| D | 0 | 30087 | 1 |
| Mode M9 | |||
|---|---|---|---|
| Quadrant | BADHDUFLAG | Total packets | Discarded packets |
| A | 0 | 6 | 0 |
| B | 0 | 6 | 0 |
| C | 0 | 6 | 0 |
| D | 0 | 6 | 0 |
| Mode SS | |||
|---|---|---|---|
| Quadrant | BADHDUFLAG | Total packets | Discarded packets |
| A | 0 | 138 | 0 |
| B | 0 | 138 | 0 |
| C | 0 | 138 | 0 |
| D | 0 | 138 | 0 |
| Quadrant | Total seconds | Saturated seconds | Saturation percentage |
|---|---|---|---|
| A | 6886 | 4584 | 66.569852% |
| B | 6886 | 123 | 1.786233% |
| C | 6887 | 383 | 5.561202% |
| D | 6887 | 1847 | 26.818644% |
Noise dominated data is calculated using 1-second bins in cleaned event files. If a bin has >2000 counts, and if more than 50% of those come from <1% of pixels, then it is considered to be noise-dominated and hence unusable.
| Quadrant | # 1 sec bins | Bins with >0 counts | Bins with >2000 counts | High rate bins dominated by noise | Noise dominated (total time) | Noise dominated (detector-on time) | Marked lightcurve |
|---|---|---|---|---|---|---|---|
| A | 7431 | 6886 | 4267 | 4267 | 57.42% | 61.97% | 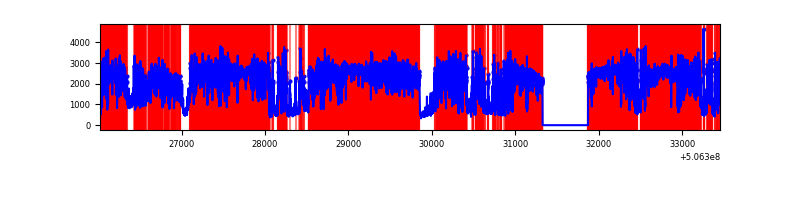 |
| B | 7431 | 6887 | 22 | 22 | 0.30% | 0.32% | 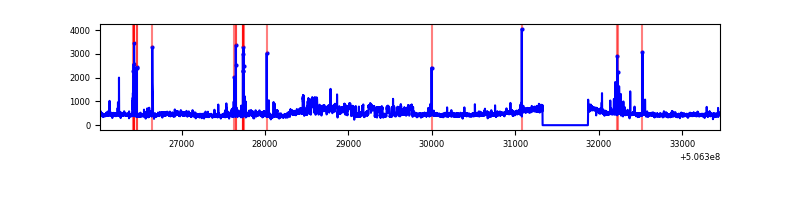 |
| C | 7432 | 6888 | 325 | 325 | 4.37% | 4.72% | 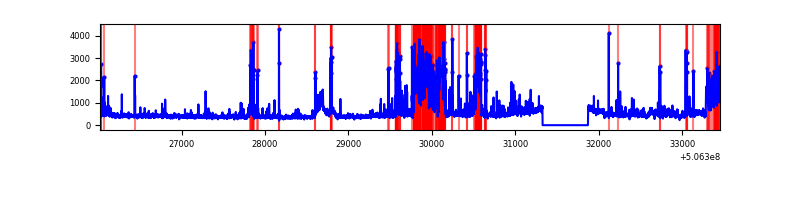 |
| D | 7432 | 6887 | 1765 | 1765 | 23.75% | 25.63% | 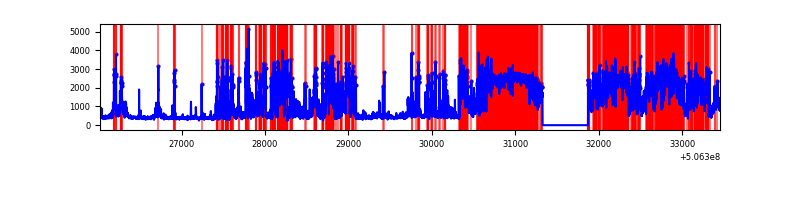 |
Top three noisy pixels from each quadrant. If the there are fewer than three noisy pixels in the level2.evt file, extra rows are filled as -1
| Pixel properties | Quadrant properties | ||||||
|---|---|---|---|---|---|---|---|
| Quadrant | DetID | PixID | Counts | Sigma | Mean | Median | Sigma |
| A | 15 | 32 | 7021574 | 57085.91 | 492 | 480 | 123.0 |
| A | 12 | 115 | 4585277 | 37277.28 | 492 | 480 | 123.0 |
| A | 8 | 192 | 163259 | 1323.5 | 492 | 480 | 123.0 |
| B | 7 | 0 | 329723 | 2149.41 | 715 | 689 | 153.1 |
| B | 5 | 172 | 234209 | 1525.47 | 715 | 689 | 153.1 |
| B | 2 | 249 | 89678 | 581.32 | 715 | 689 | 153.1 |
| C | 15 | 199 | 945556 | 4981.9 | 689 | 682 | 189.7 |
| C | 9 | 38 | 312691 | 1645.08 | 689 | 682 | 189.7 |
| C | 1 | 16 | 151385 | 794.59 | 689 | 682 | 189.7 |
| D | 11 | 129 | 5923775 | 34426.61 | 600 | 572 | 172.1 |
| D | 3 | 12 | 80935 | 467.08 | 600 | 572 | 172.1 |
| D | 7 | 129 | 46869 | 269.09 | 600 | 572 | 172.1 |
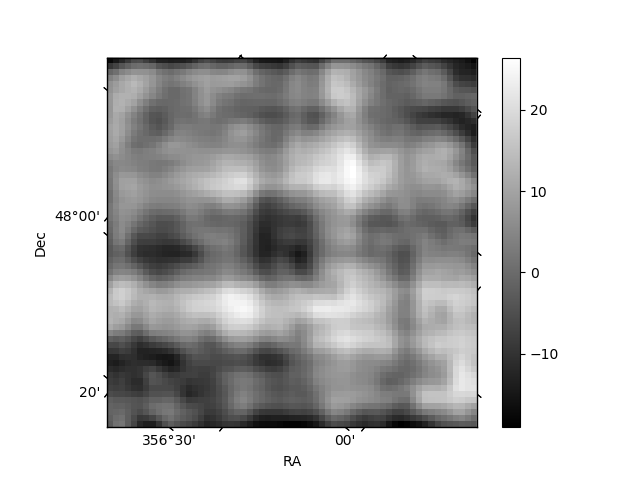
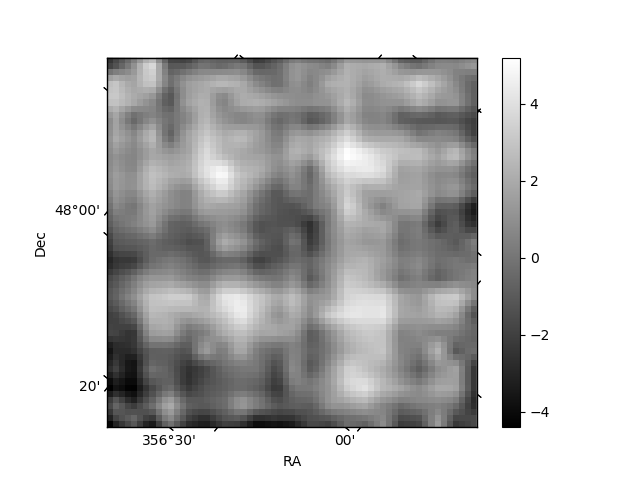
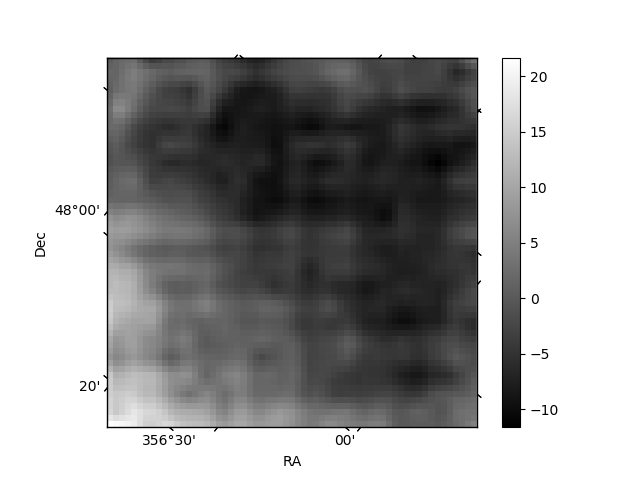
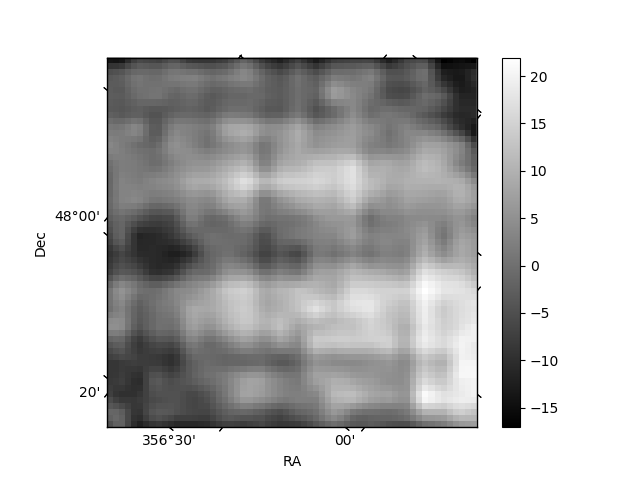
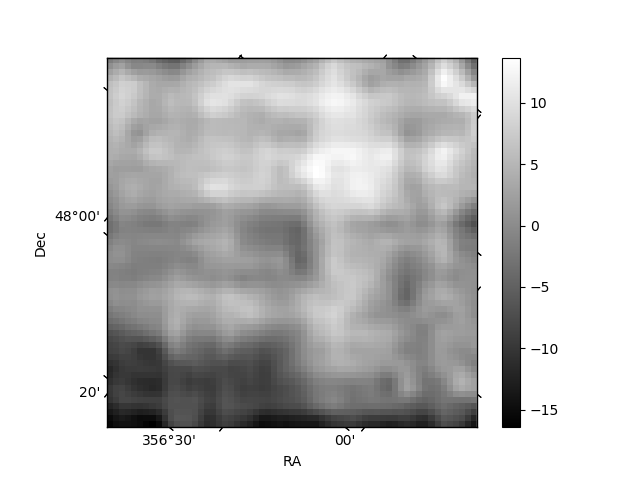
Histogram calculated using DETX and DETY for each event in the final _common_clean file
| Quadrant A | 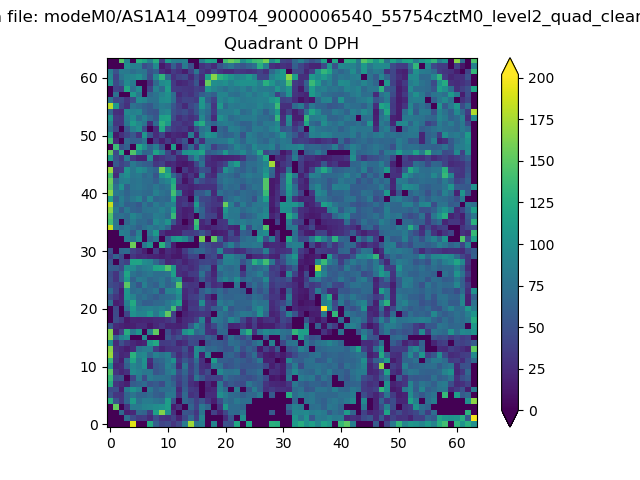 |
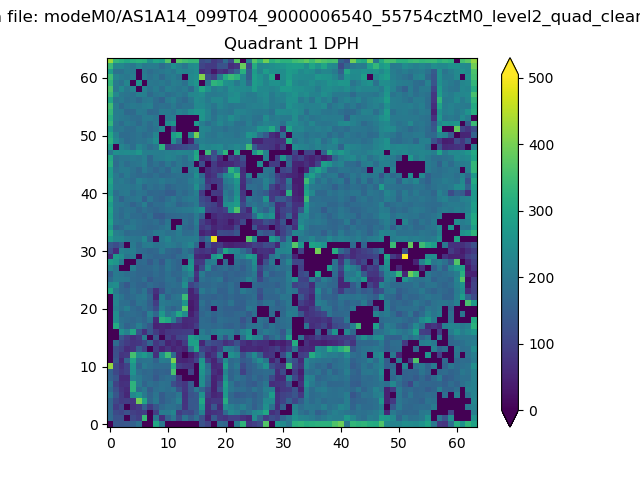 |
Quadrant B |
|---|---|---|---|
| Quadrant D | 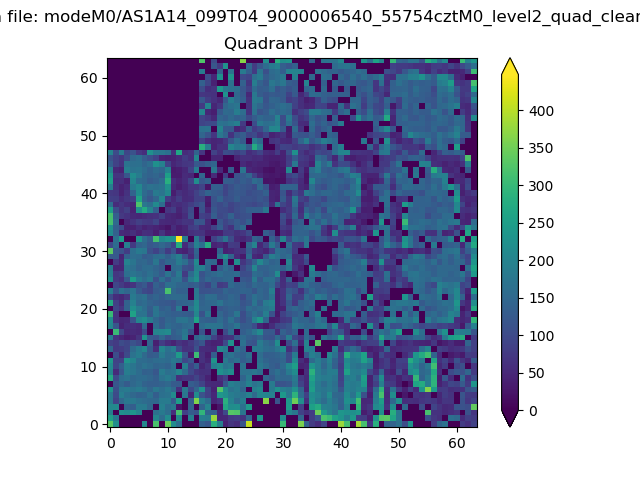 |
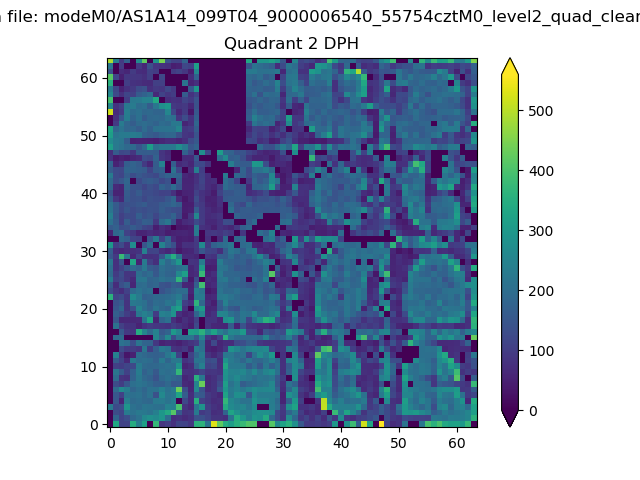 |
Quadrant C |
| Plot type | Count rate plots | Images |
|---|---|---|
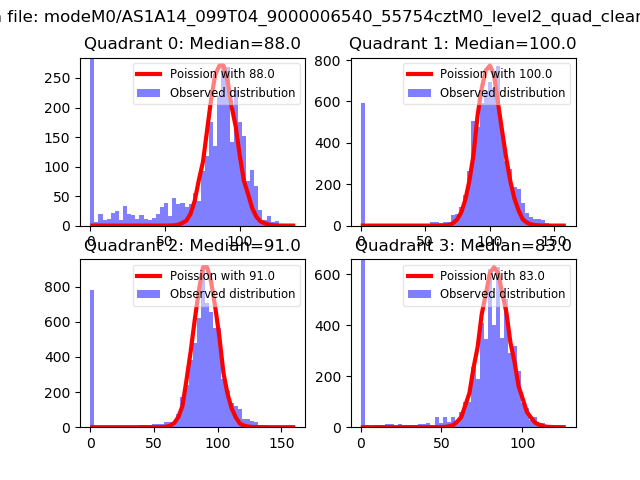
| Comparison with Poisson distribution Blue bars denote a histogram of data divided into 1 sec bins. Red curve is a Poisson curve with rate = median count rate of data. |
 |
 |
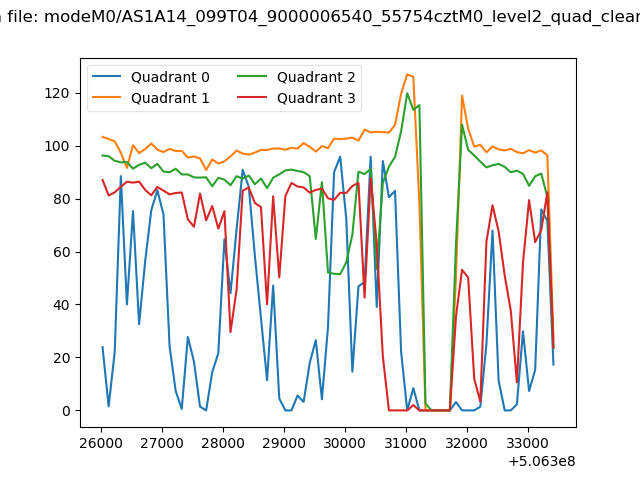
| Quadrant-wise count rates Data is divided into 100 sec bins |
 |
|
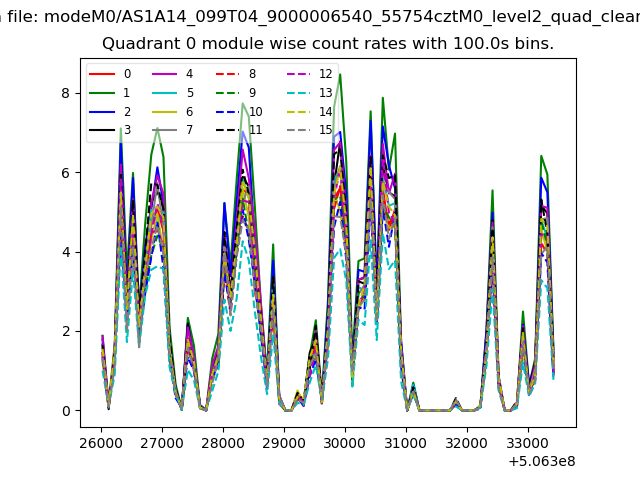
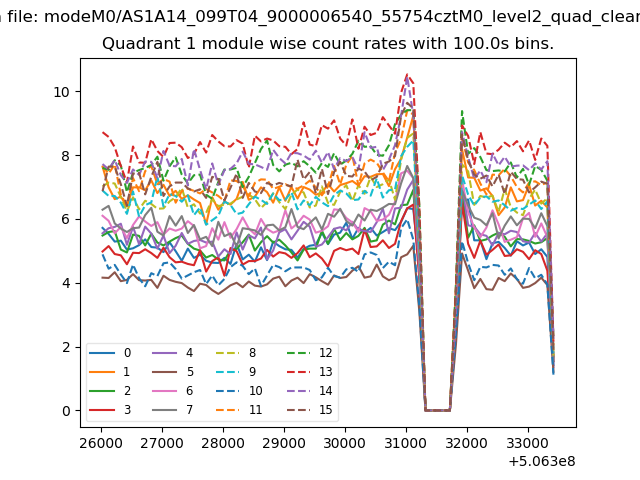
| Module-wise count rates for Quadrant A Data is divided into 100 sec bins |
 |
 |
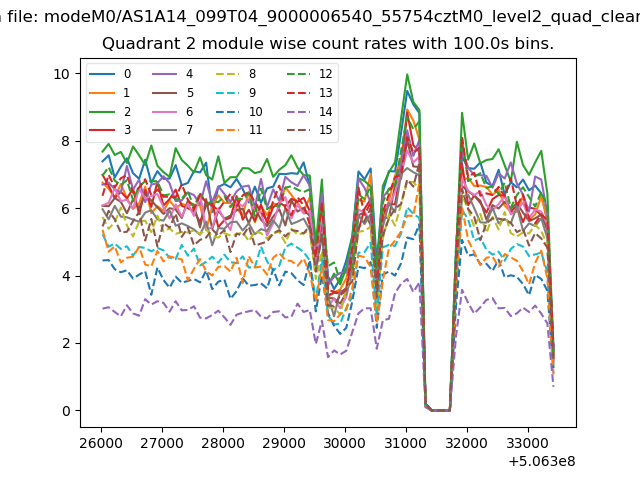
| Module-wise count rates for Quadrant B Data is divided into 100 sec bins |
 |
 |
| Module-wise count rates for Quadrant C Data is divided into 100 sec bins |
 |
 |
| Module-wise count rates for Quadrant D Data is divided into 100 sec bins |
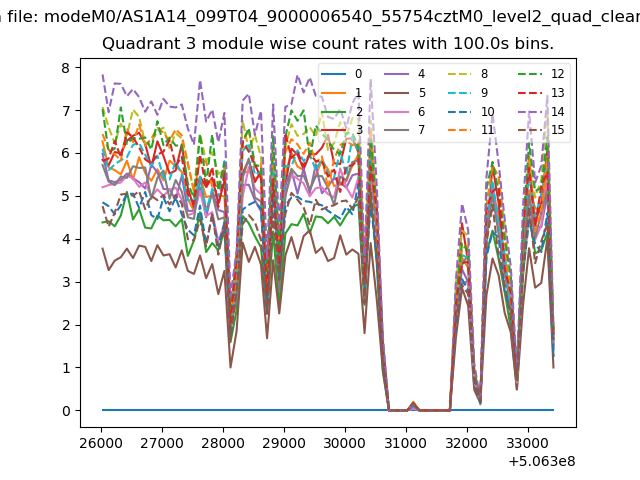 |
 |
| Parameter | Plot |
|---|---|
| CZT HV Monitor | 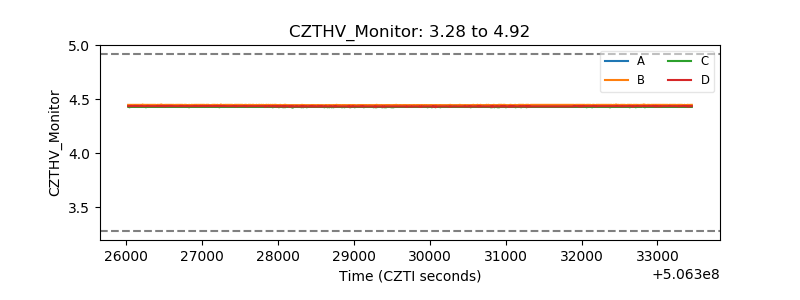 |
| D_VDD | 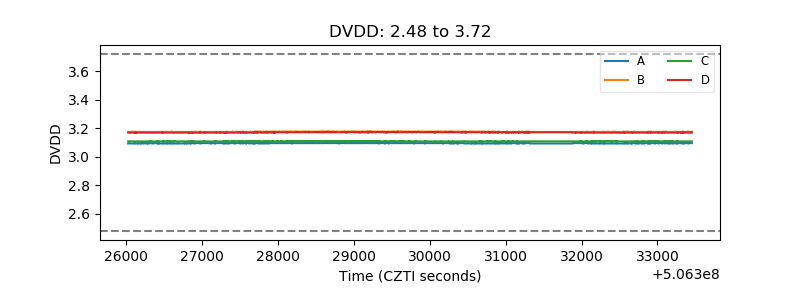 |
| Temperature 1 | 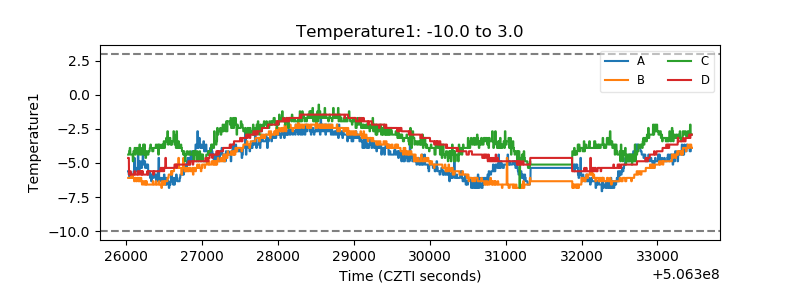 |
| Veto HV Monitor | 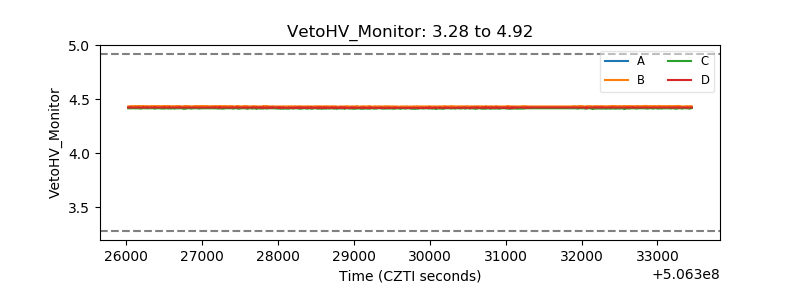 |
| Veto LLD | 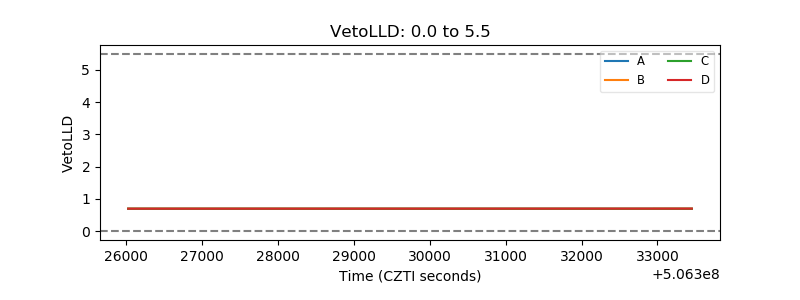 |
| Alpha Counter | 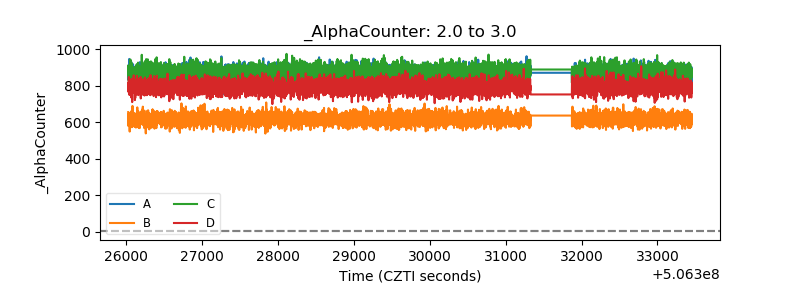 |
| _CPM_Rate | 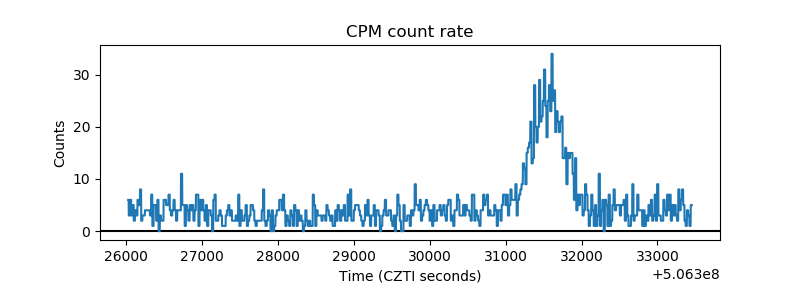 |
| CZT Counter | 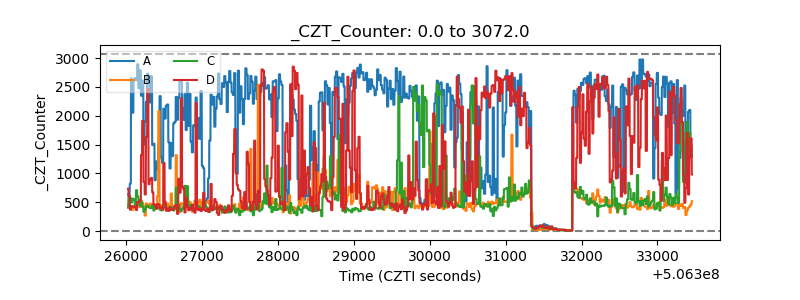 |
| +2.5 Volts monitor |  |
| +5 Volts monitor |  |
| _ROLL_ROT | 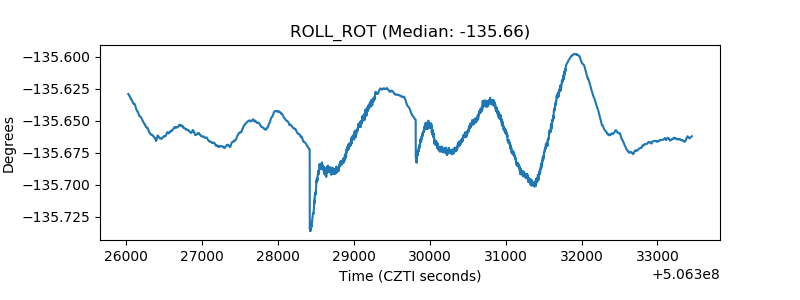 |
| _Roll_DEC | 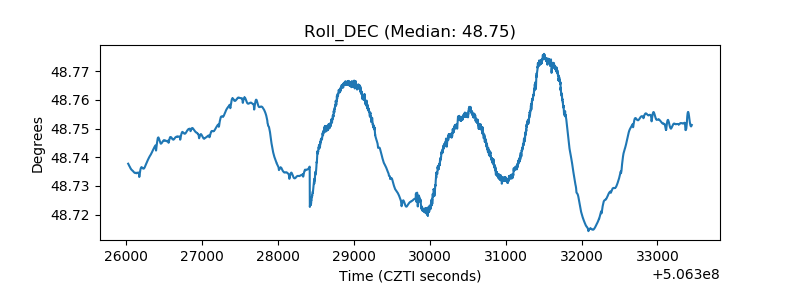 |
| _Roll_RA | 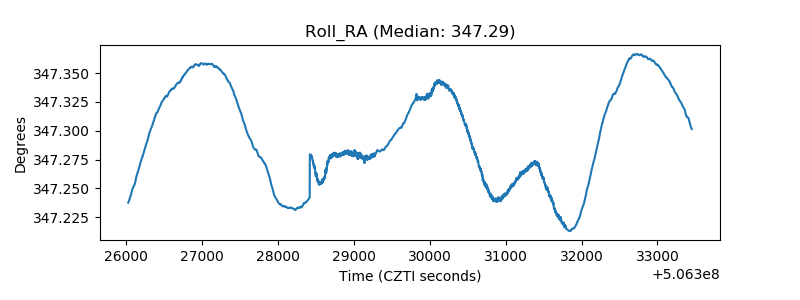 |
| Veto Counter | 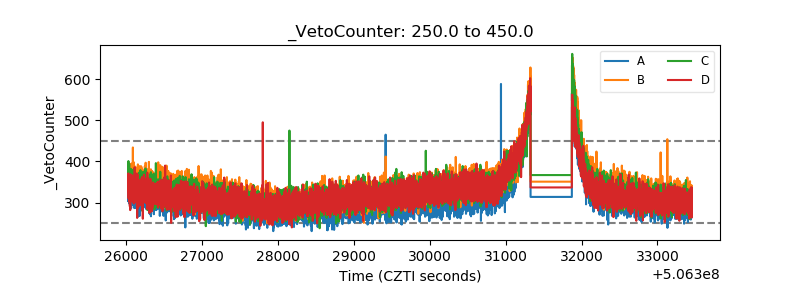 |