| Param | Original file | Final file |
|---|---|---|
| Filename | modeM0/AS1A14_099T04_9000006540_55755cztM0_level2.fits | modeM0/AS1A14_099T04_9000006540_55755cztM0_level2_quad_clean.evt |
| Size (bytes) | 936,573,120 | 88,934,400 |
| Size | 893.2 MB | 84.8 MB |
| Events in quadrant A | 13,333,799 | 342,642 |
| Events in quadrant B | 4,122,028 | 750,240 |
| Events in quadrant C | 4,504,204 | 663,190 |
| Events in quadrant D | 12,129,232 | 415,126 |
| Mode M0 | |||
|---|---|---|---|
| Quadrant | BADHDUFLAG | Total packets | Discarded packets |
| A | 0 | 44789 | 0 |
| B | 0 | 17488 | 0 |
| C | 0 | 18660 | 0 |
| D | 0 | 41220 | 0 |
| Mode SS | |||
|---|---|---|---|
| Quadrant | BADHDUFLAG | Total packets | Discarded packets |
| A | 0 | 150 | 0 |
| B | 0 | 150 | 0 |
| C | 0 | 150 | 0 |
| D | 0 | 150 | 0 |
| Quadrant | Total seconds | Saturated seconds | Saturation percentage |
|---|---|---|---|
| A | 7491 | 4150 | 55.399813% |
| B | 7492 | 77 | 1.027763% |
| C | 7492 | 273 | 3.643887% |
| D | 7492 | 2758 | 36.812600% |
Noise dominated data is calculated using 1-second bins in cleaned event files. If a bin has >2000 counts, and if more than 50% of those come from <1% of pixels, then it is considered to be noise-dominated and hence unusable.
| Quadrant | # 1 sec bins | Bins with >0 counts | Bins with >2000 counts | High rate bins dominated by noise | Noise dominated (total time) | Noise dominated (detector-on time) | Marked lightcurve |
|---|---|---|---|---|---|---|---|
| A | 7491 | 7491 | 3456 | 3456 | 46.14% | 46.14% | 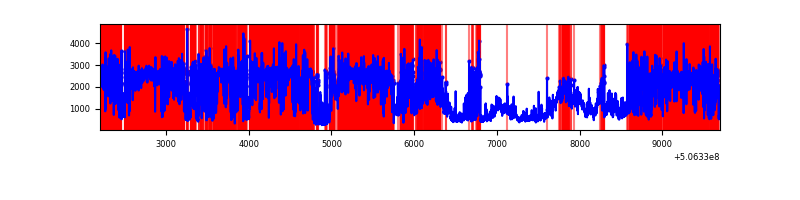 |
| B | 7492 | 7492 | 15 | 15 | 0.20% | 0.20% | 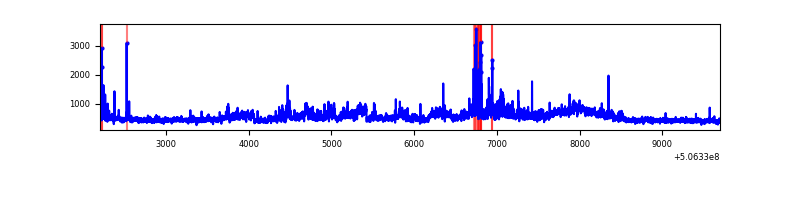 |
| C | 7492 | 7492 | 234 | 234 | 3.12% | 3.12% | 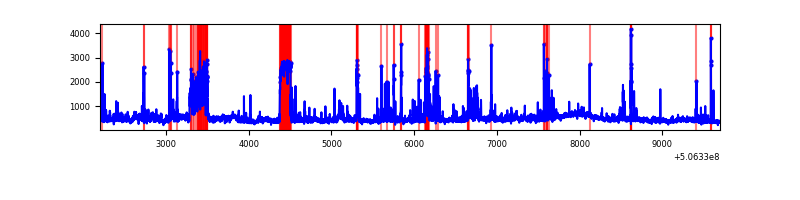 |
| D | 7492 | 7492 | 2777 | 2777 | 37.07% | 37.07% | 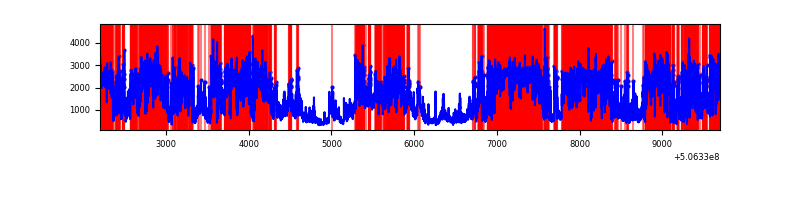 |
Top three noisy pixels from each quadrant. If the there are fewer than three noisy pixels in the level2.evt file, extra rows are filled as -1
| Pixel properties | Quadrant properties | ||||||
|---|---|---|---|---|---|---|---|
| Quadrant | DetID | PixID | Counts | Sigma | Mean | Median | Sigma |
| A | 15 | 32 | 9856544 | 72104.78 | 553 | 540 | 136.7 |
| A | 12 | 115 | 992971 | 7260.45 | 553 | 540 | 136.7 |
| A | 8 | 192 | 163288 | 1190.64 | 553 | 540 | 136.7 |
| B | 7 | 0 | 878565 | 5184.26 | 784 | 756 | 169.3 |
| B | 2 | 249 | 72912 | 426.15 | 784 | 756 | 169.3 |
| B | 12 | 111 | 21209 | 120.79 | 784 | 756 | 169.3 |
| C | 15 | 199 | 663027 | 3169.5 | 759 | 751 | 209.0 |
| C | 9 | 38 | 281887 | 1345.45 | 759 | 751 | 209.0 |
| C | 1 | 16 | 279099 | 1332.11 | 759 | 751 | 209.0 |
| D | 11 | 129 | 9295555 | 51926.55 | 633 | 603 | 179.0 |
| D | 10 | 181 | 201911 | 1124.61 | 633 | 603 | 179.0 |
| D | 5 | 173 | 50269 | 277.46 | 633 | 603 | 179.0 |
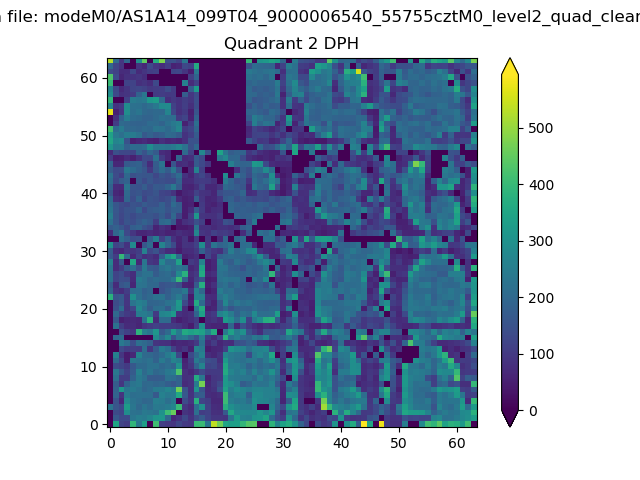
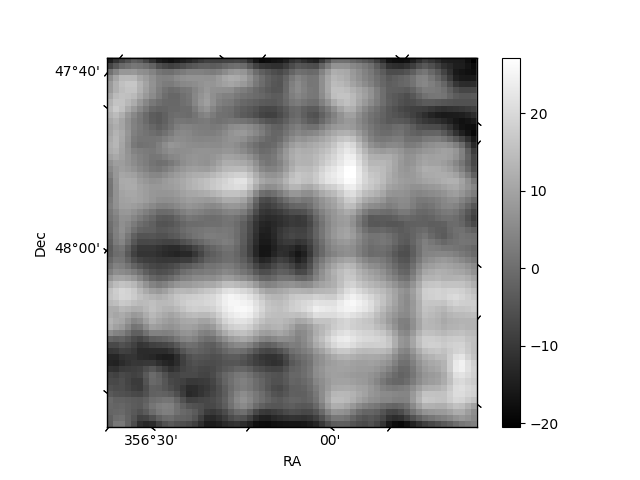
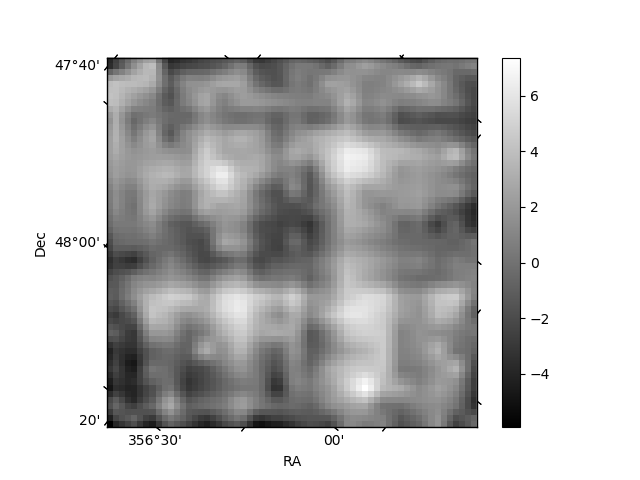
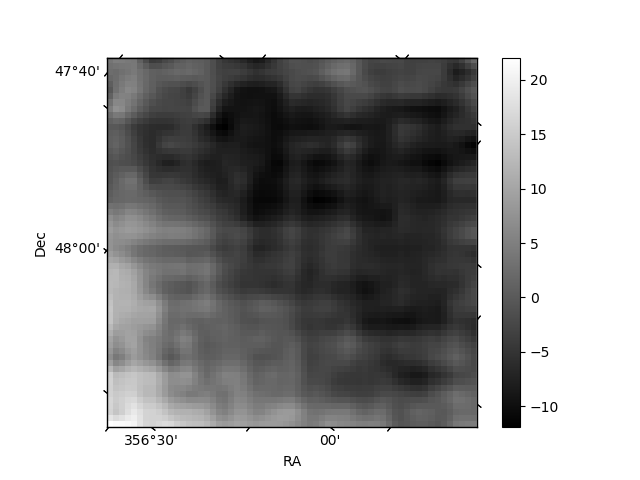
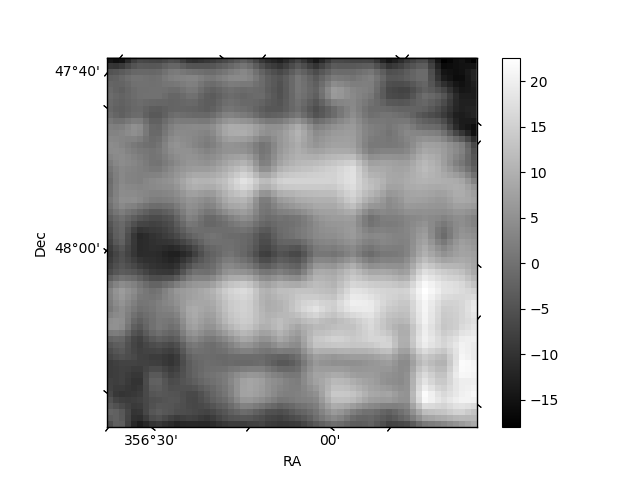
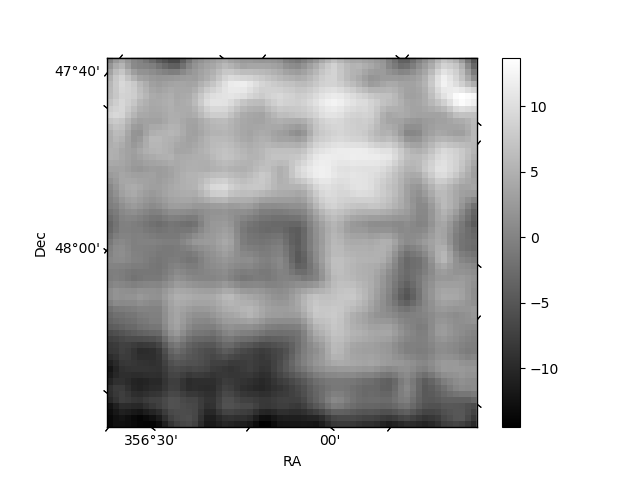
Histogram calculated using DETX and DETY for each event in the final _common_clean file
| Quadrant A | 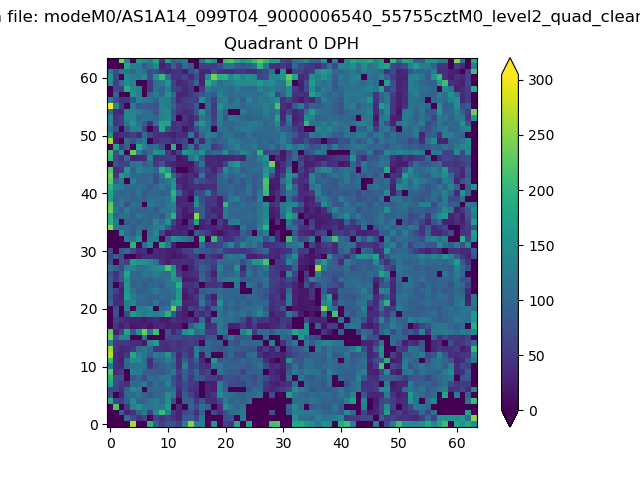 |
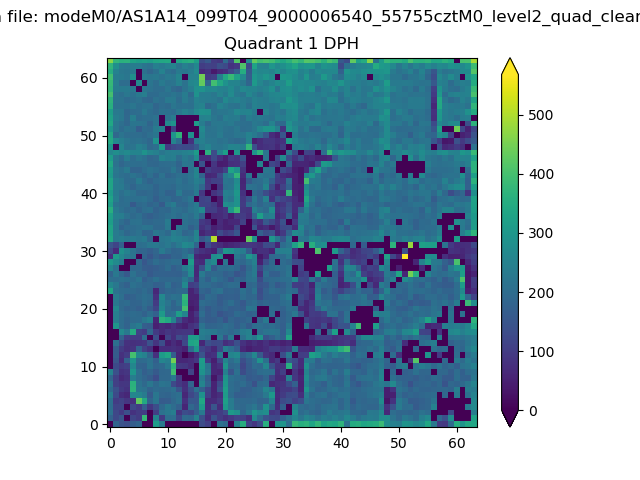 |
Quadrant B |
|---|---|---|---|
| Quadrant D | 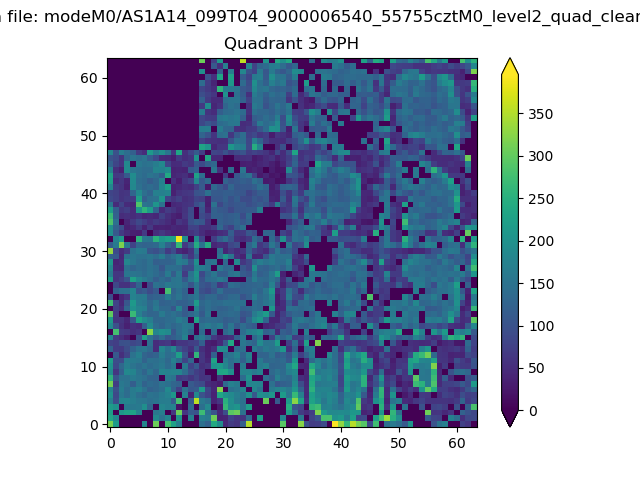 |
 |
Quadrant C |
| Plot type | Count rate plots | Images |
|---|---|---|
| Comparison with Poisson distribution Blue bars denote a histogram of data divided into 1 sec bins. Red curve is a Poisson curve with rate = median count rate of data. |
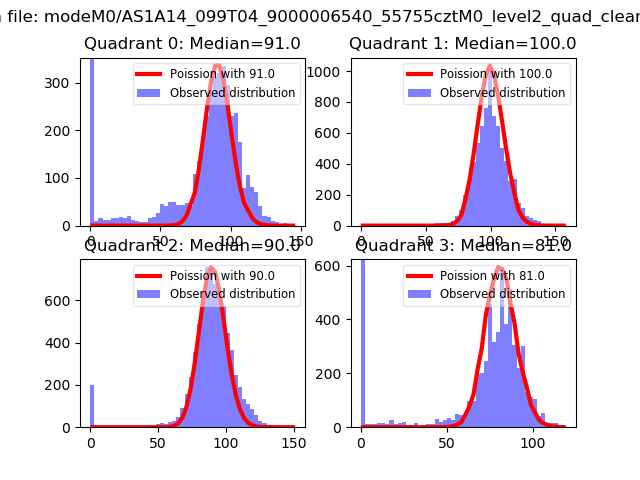 |
 |
| Quadrant-wise count rates Data is divided into 100 sec bins |
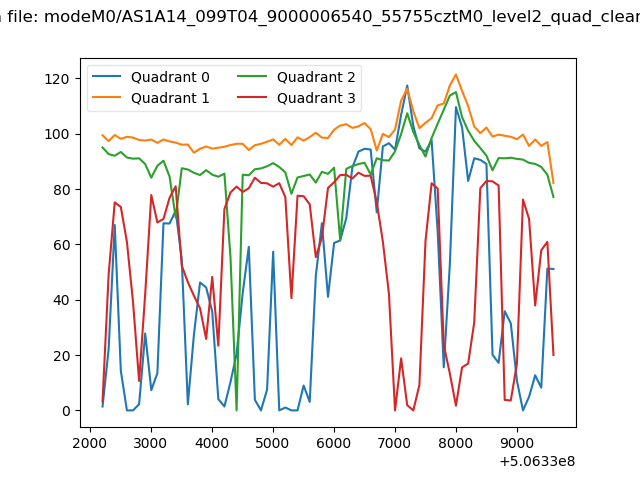 |
|
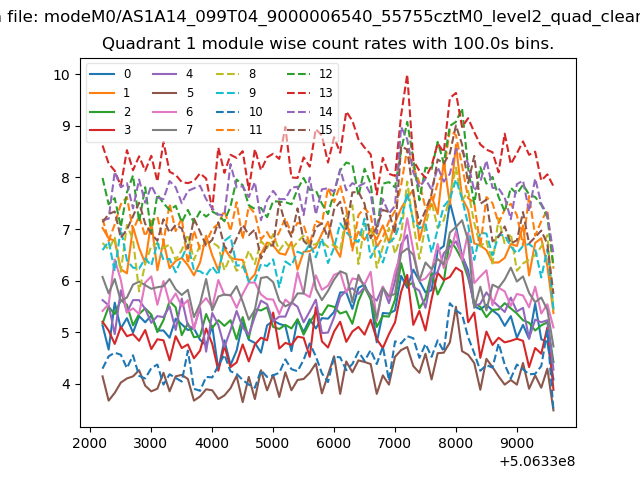
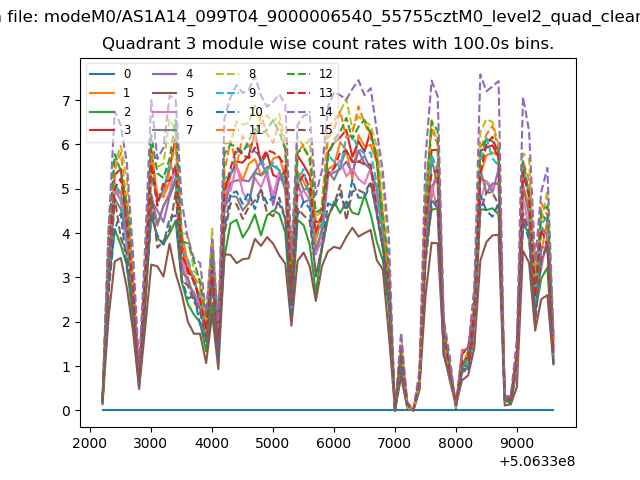
| Module-wise count rates for Quadrant A Data is divided into 100 sec bins |
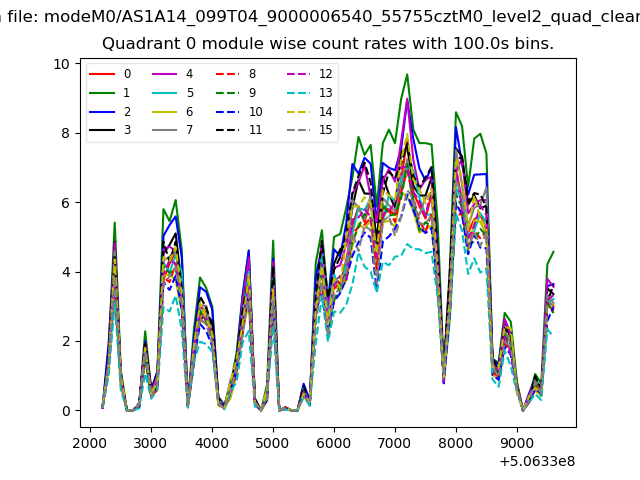 |
 |
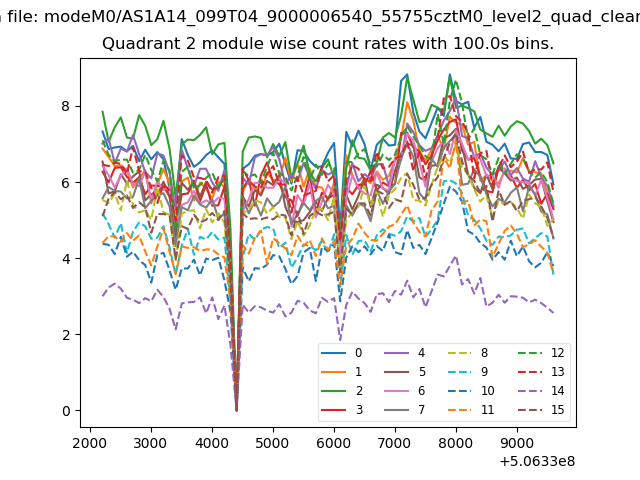
| Module-wise count rates for Quadrant B Data is divided into 100 sec bins |
 |
 |
| Module-wise count rates for Quadrant C Data is divided into 100 sec bins |
 |
 |
| Module-wise count rates for Quadrant D Data is divided into 100 sec bins |
 |
 |
| Parameter | Plot |
|---|---|
| CZT HV Monitor | 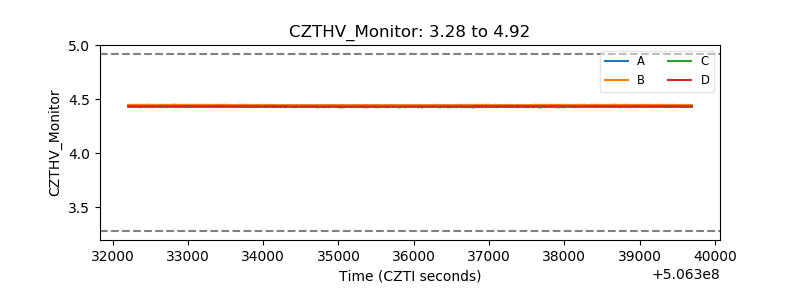 |
| D_VDD | 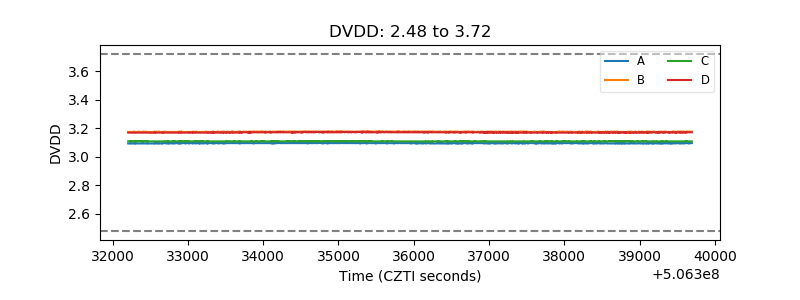 |
| Temperature 1 | 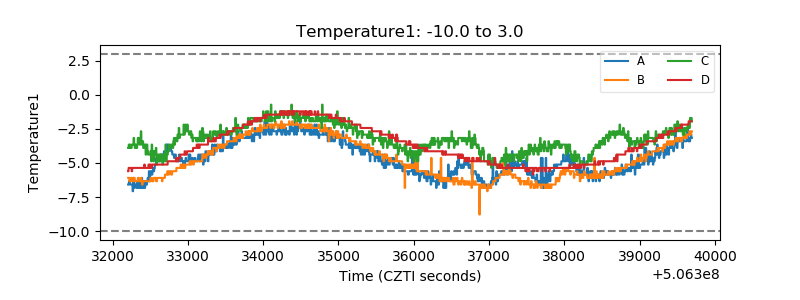 |
| Veto HV Monitor | 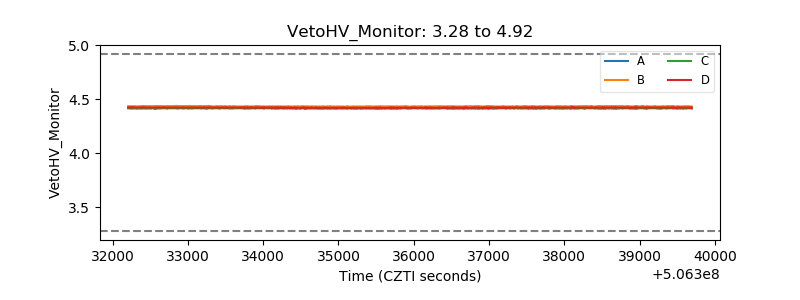 |
| Veto LLD | 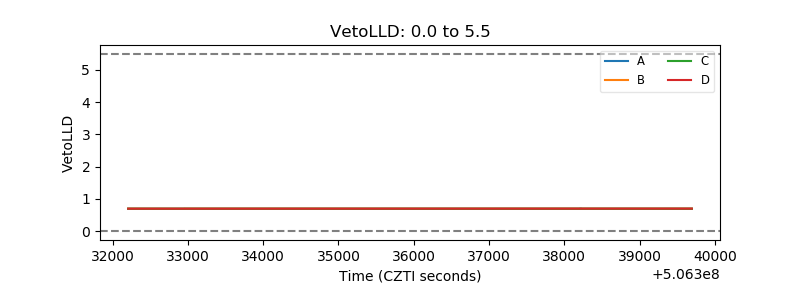 |
| Alpha Counter | 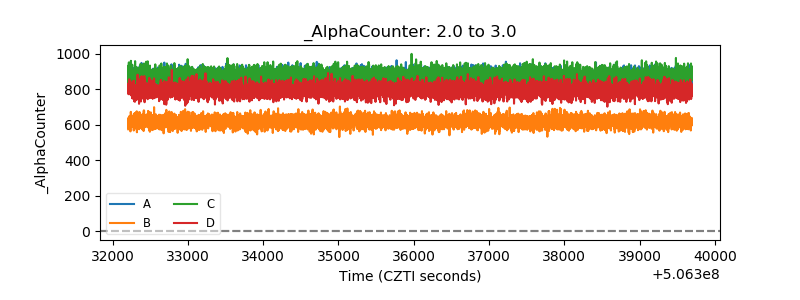 |
| _CPM_Rate | 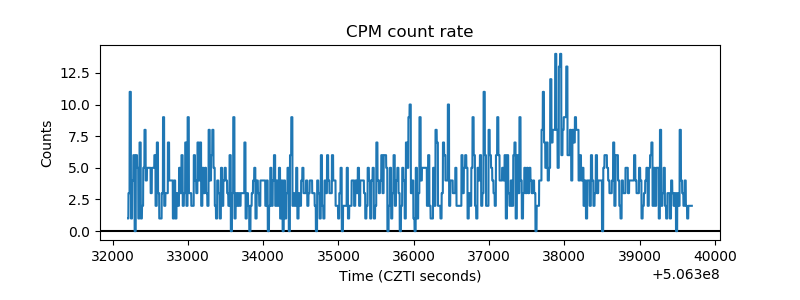 |
| CZT Counter | 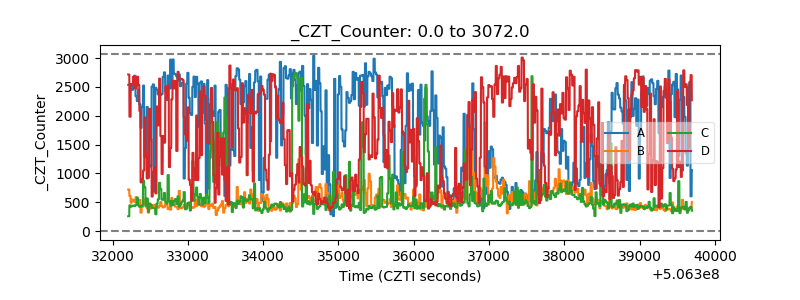 |
| +2.5 Volts monitor |  |
| +5 Volts monitor |  |
| _ROLL_ROT | 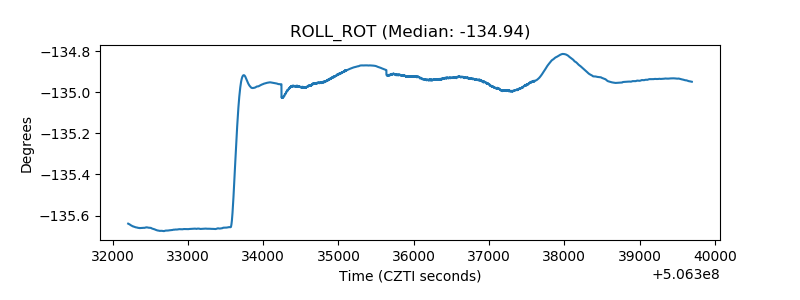 |
| _Roll_DEC | 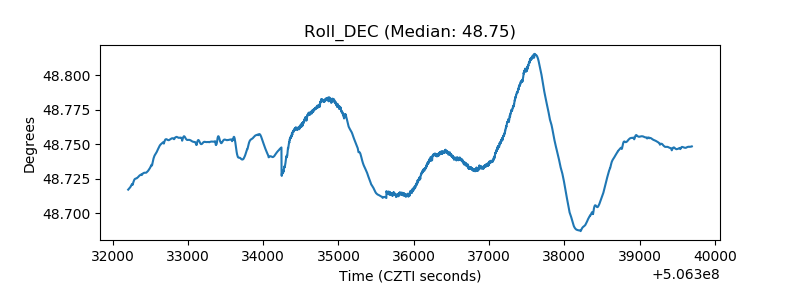 |
| _Roll_RA | 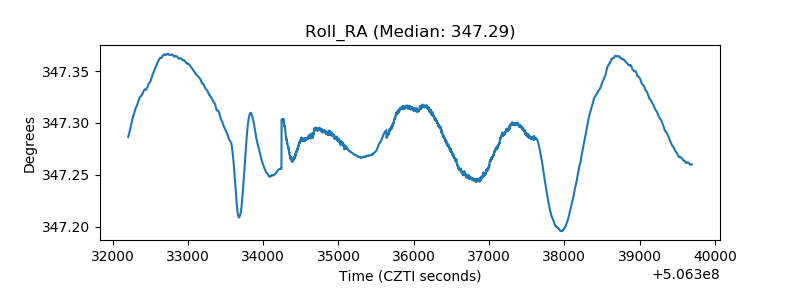 |
| Veto Counter | 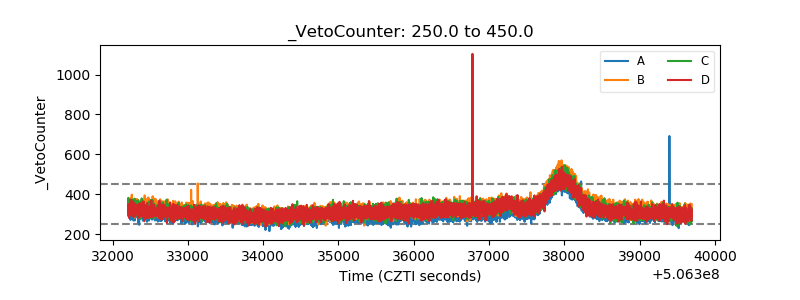 |