| Param | Original file | Final file |
|---|---|---|
| Filename | modeM0/AS1A14_099T04_9000006540_55756cztM0_level2.fits | modeM0/AS1A14_099T04_9000006540_55756cztM0_level2_quad_clean.evt |
| Size (bytes) | 626,529,600 | 84,767,040 |
| Size | 597.5 MB | 80.8 MB |
| Events in quadrant A | 7,484,420 | 477,906 |
| Events in quadrant B | 3,350,498 | 639,875 |
| Events in quadrant C | 3,185,664 | 573,334 |
| Events in quadrant D | 8,670,740 | 424,708 |
| Mode M0 | |||
|---|---|---|---|
| Quadrant | BADHDUFLAG | Total packets | Discarded packets |
| A | 0 | 26645 | 9 |
| B | 0 | 14396 | 0 |
| C | 0 | 14355 | 0 |
| D | 0 | 30239 | 1 |
| Mode SS | |||
|---|---|---|---|
| Quadrant | BADHDUFLAG | Total packets | Discarded packets |
| A | 0 | 130 | 0 |
| B | 0 | 130 | 0 |
| C | 0 | 130 | 0 |
| D | 0 | 130 | 0 |
| Quadrant | Total seconds | Saturated seconds | Saturation percentage |
|---|---|---|---|
| A | 6455 | 1462 | 22.649109% |
| B | 6457 | 48 | 0.743379% |
| C | 6457 | 93 | 1.440297% |
| D | 6457 | 1677 | 25.971814% |
Noise dominated data is calculated using 1-second bins in cleaned event files. If a bin has >2000 counts, and if more than 50% of those come from <1% of pixels, then it is considered to be noise-dominated and hence unusable.
| Quadrant | # 1 sec bins | Bins with >0 counts | Bins with >2000 counts | High rate bins dominated by noise | Noise dominated (total time) | Noise dominated (detector-on time) | Marked lightcurve |
|---|---|---|---|---|---|---|---|
| A | 6457 | 6456 | 1205 | 1205 | 18.66% | 18.66% | 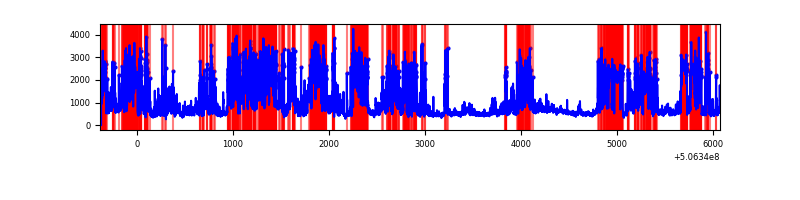 |
| B | 6457 | 6457 | 22 | 22 | 0.34% | 0.34% | 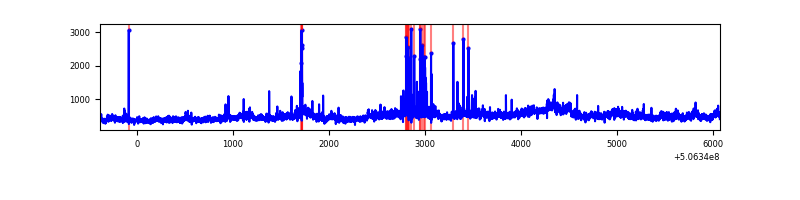 |
| C | 6457 | 6457 | 86 | 86 | 1.33% | 1.33% | 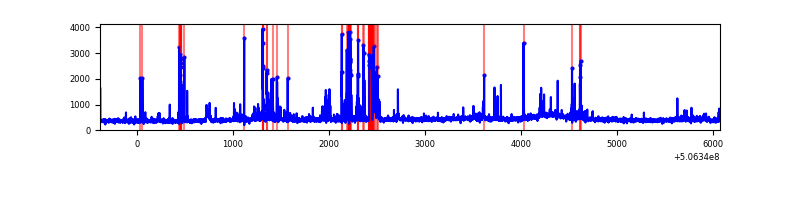 |
| D | 6457 | 6457 | 1603 | 1603 | 24.83% | 24.83% | 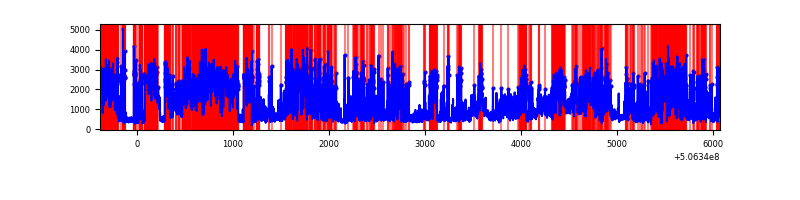 |
Top three noisy pixels from each quadrant. If the there are fewer than three noisy pixels in the level2.evt file, extra rows are filled as -1
| Pixel properties | Quadrant properties | ||||||
|---|---|---|---|---|---|---|---|
| Quadrant | DetID | PixID | Counts | Sigma | Mean | Median | Sigma |
| A | 15 | 32 | 4527009 | 30112.92 | 604 | 588 | 150.3 |
| A | 8 | 192 | 187405 | 1242.84 | 604 | 588 | 150.3 |
| A | 12 | 115 | 130817 | 866.37 | 604 | 588 | 150.3 |
| B | 7 | 0 | 519314 | 3628.89 | 660 | 637 | 142.9 |
| B | 2 | 249 | 103615 | 720.48 | 660 | 637 | 142.9 |
| B | 5 | 172 | 56154 | 388.42 | 660 | 637 | 142.9 |
| C | 6 | 223 | 332769 | 1852.8 | 648 | 640 | 179.3 |
| C | 13 | 3 | 117682 | 652.92 | 648 | 640 | 179.3 |
| C | 1 | 16 | 98749 | 547.31 | 648 | 640 | 179.3 |
| D | 11 | 129 | 5745747 | 34312.25 | 584 | 560 | 167.4 |
| D | 6 | 42 | 257069 | 1531.96 | 584 | 560 | 167.4 |
| D | 7 | 96 | 132484 | 787.9 | 584 | 560 | 167.4 |
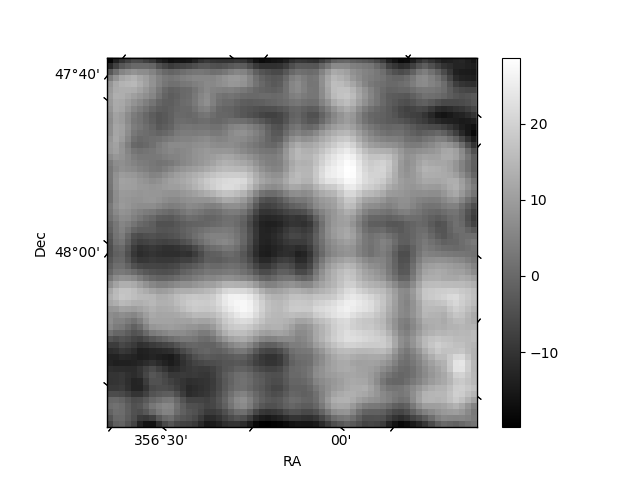
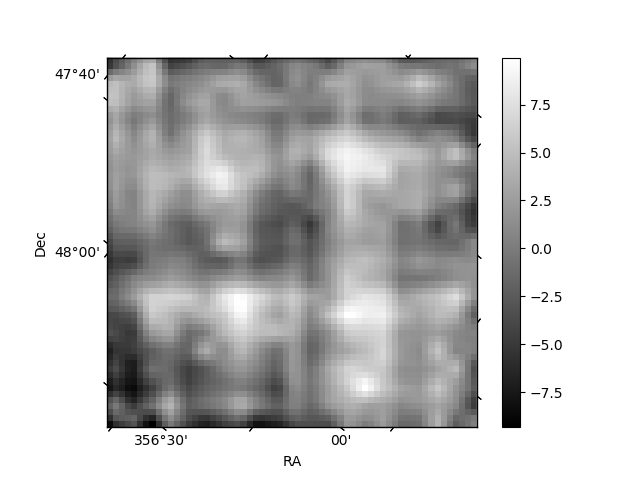
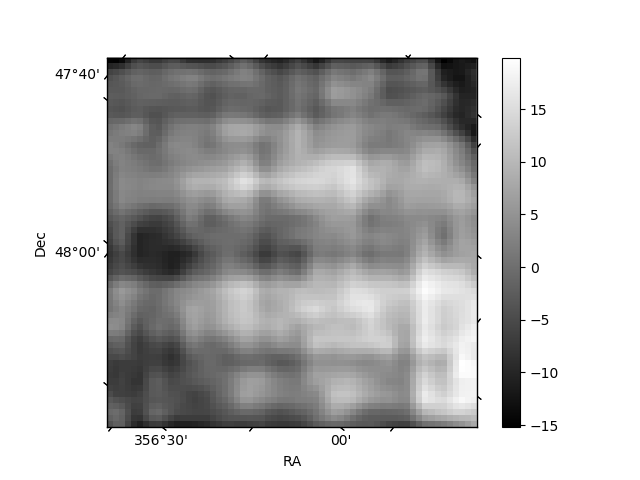
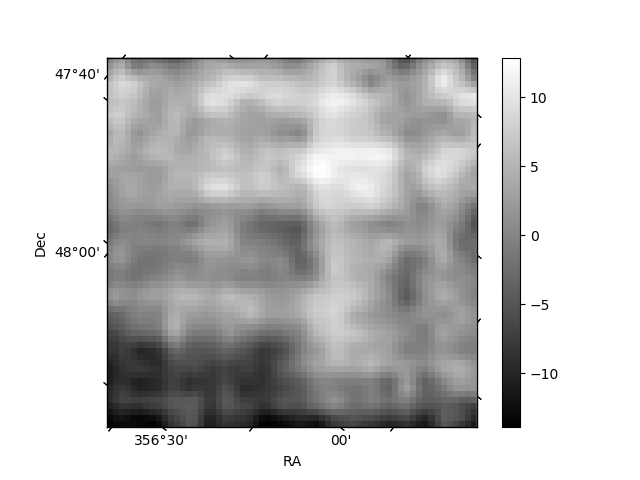
Histogram calculated using DETX and DETY for each event in the final _common_clean file
| Quadrant A | 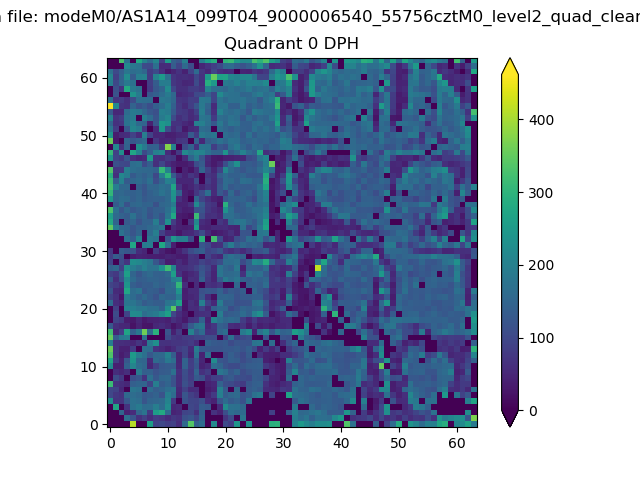 |
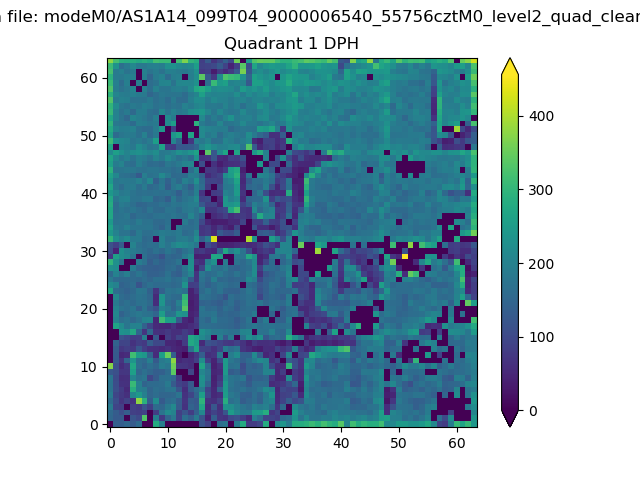 |
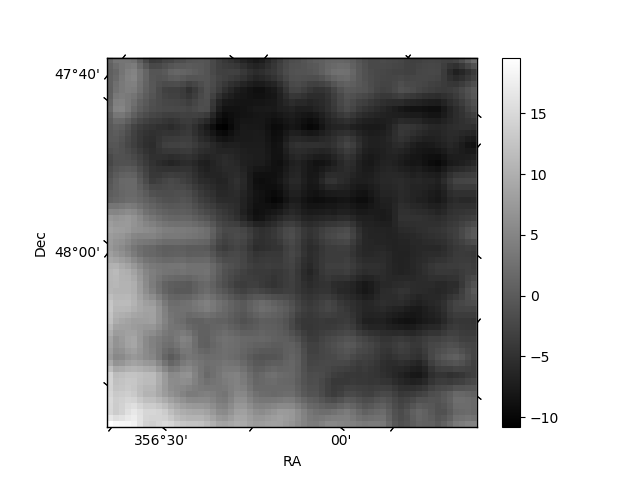
Quadrant B |
|---|---|---|---|
| Quadrant D | 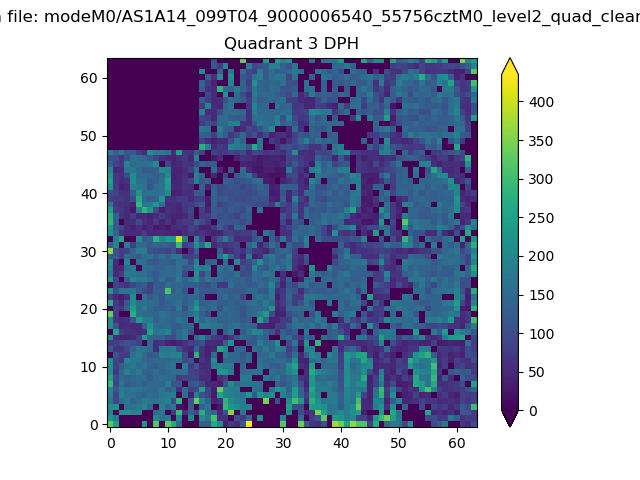 |
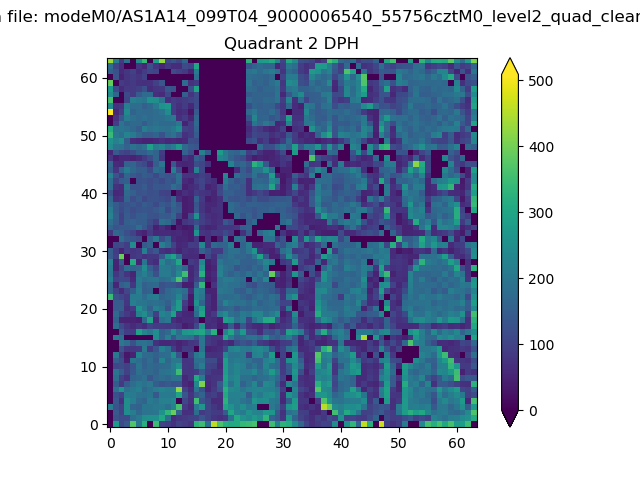 |
Quadrant C |
| Plot type | Count rate plots | Images |
|---|---|---|
| Comparison with Poisson distribution Blue bars denote a histogram of data divided into 1 sec bins. Red curve is a Poisson curve with rate = median count rate of data. |
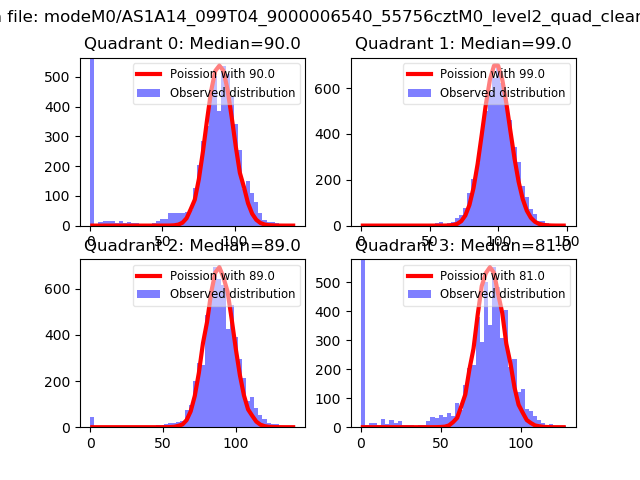 |
 |
| Quadrant-wise count rates Data is divided into 100 sec bins |
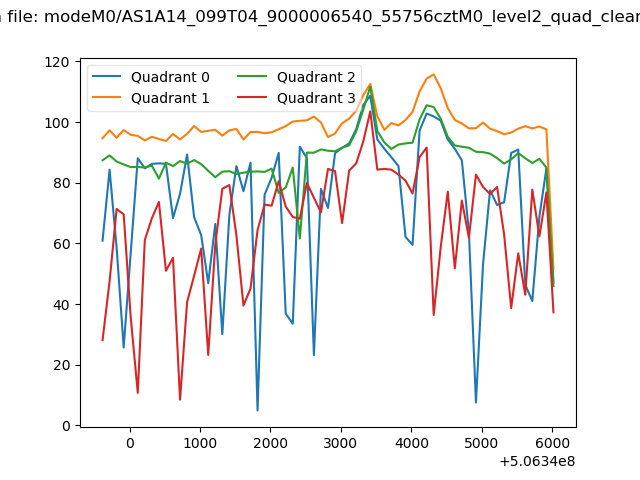 |
|
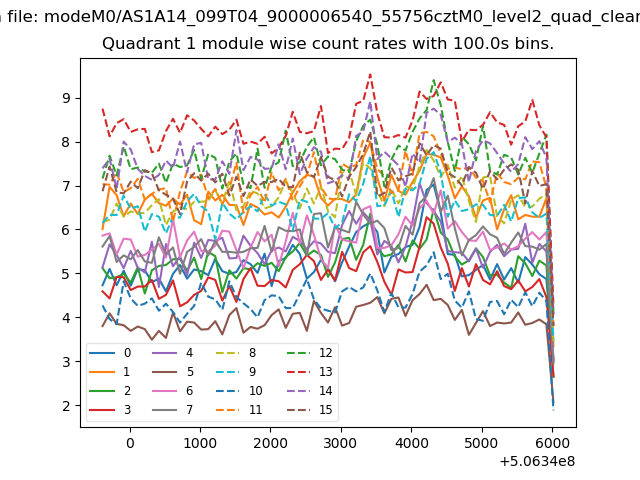
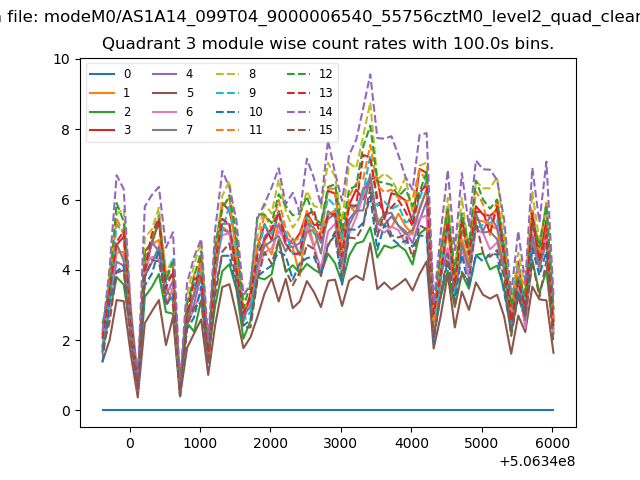
| Module-wise count rates for Quadrant A Data is divided into 100 sec bins |
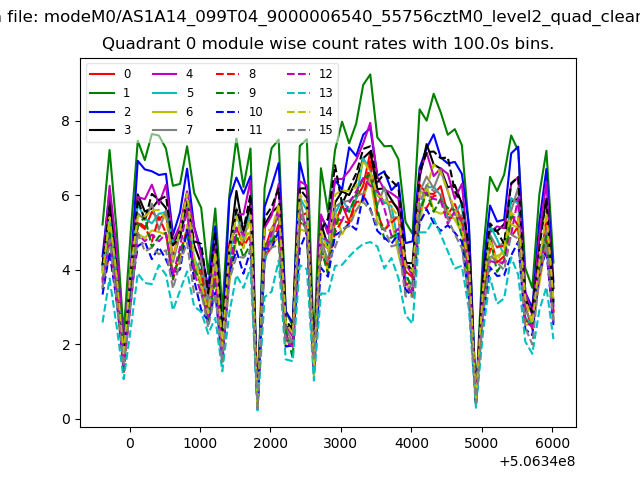 |
 |
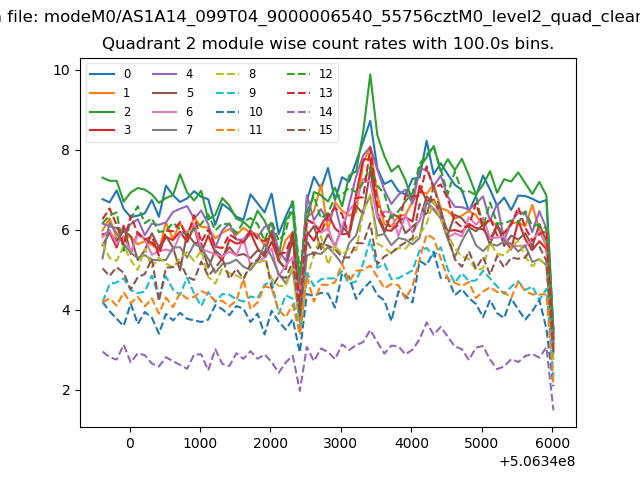
| Module-wise count rates for Quadrant B Data is divided into 100 sec bins |
 |
 |
| Module-wise count rates for Quadrant C Data is divided into 100 sec bins |
 |
 |
| Module-wise count rates for Quadrant D Data is divided into 100 sec bins |
 |
 |
| Parameter | Plot |
|---|---|
| CZT HV Monitor | 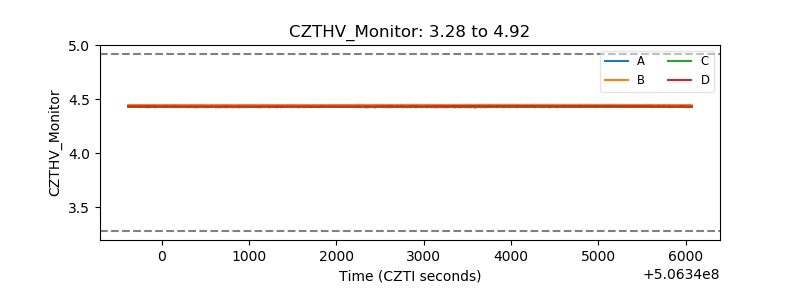 |
| D_VDD | 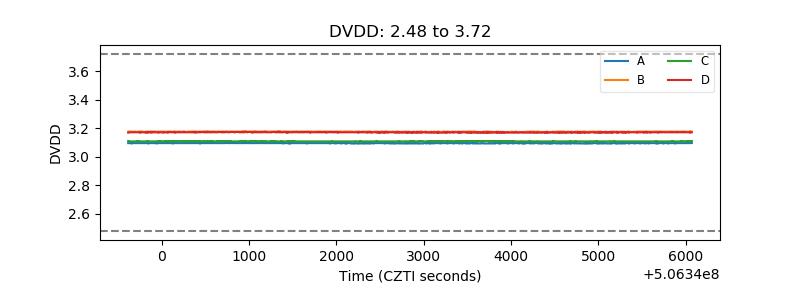 |
| Temperature 1 | 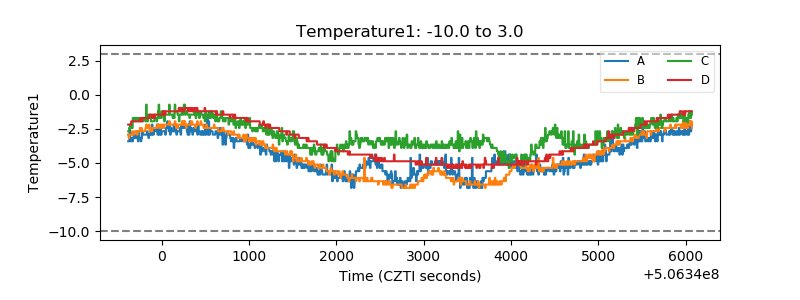 |
| Veto HV Monitor | 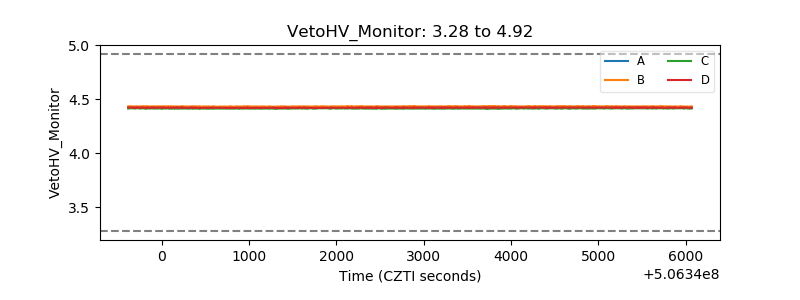 |
| Veto LLD | 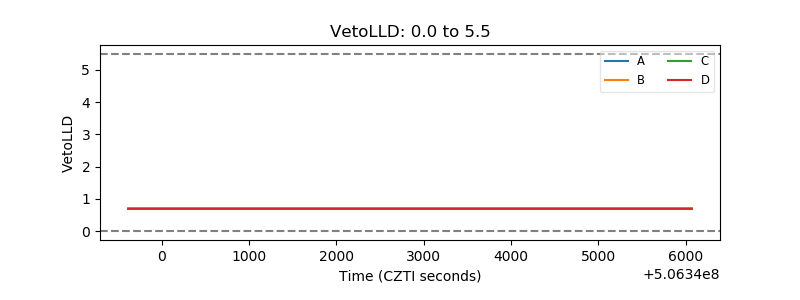 |
| Alpha Counter | 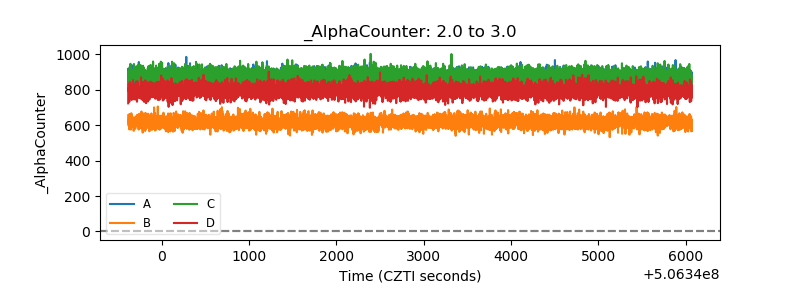 |
| _CPM_Rate | 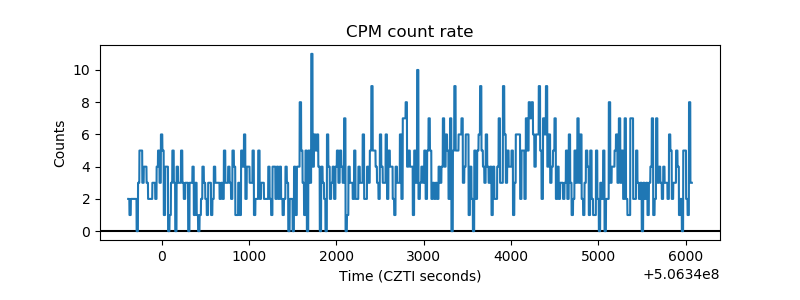 |
| CZT Counter | 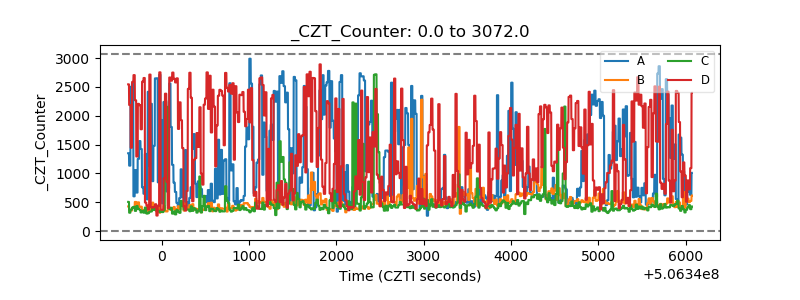 |
| +2.5 Volts monitor | 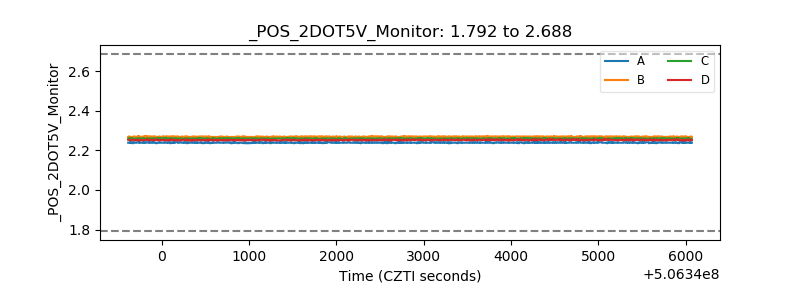 |
| +5 Volts monitor |  |
| _ROLL_ROT | 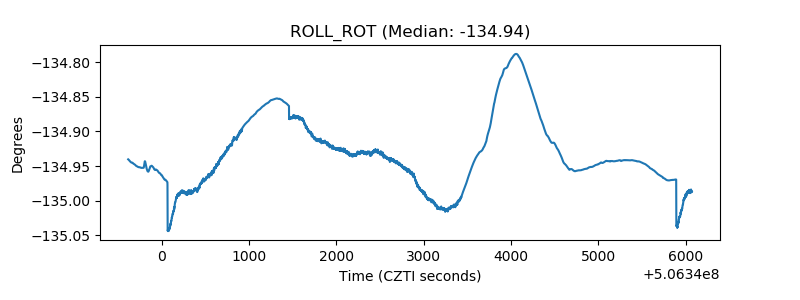 |
| _Roll_DEC | 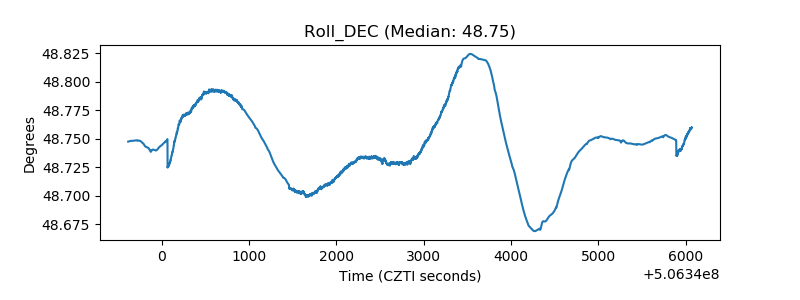 |
| _Roll_RA | 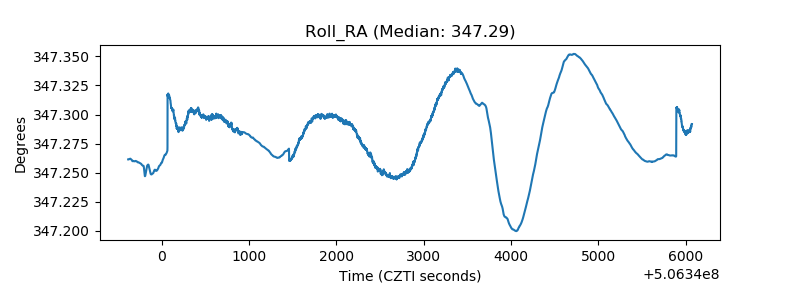 |
| Veto Counter | 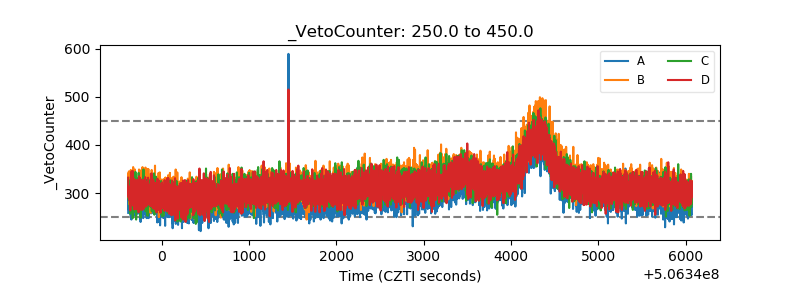 |