| Param | Original file | Final file |
|---|---|---|
| Filename | modeM0/AS1A14_099T04_9000006540_55757cztM0_level2.fits | modeM0/AS1A14_099T04_9000006540_55757cztM0_level2_quad_clean.evt |
| Size (bytes) | 742,196,160 | 95,474,880 |
| Size | 707.8 MB | 91.1 MB |
| Events in quadrant A | 11,024,418 | 451,714 |
| Events in quadrant B | 3,688,590 | 736,441 |
| Events in quadrant C | 3,935,731 | 659,736 |
| Events in quadrant D | 8,250,137 | 526,179 |
| Mode M0 | |||
|---|---|---|---|
| Quadrant | BADHDUFLAG | Total packets | Discarded packets |
| A | 0 | 37895 | 0 |
| B | 0 | 16246 | 0 |
| C | 0 | 16934 | 0 |
| D | 0 | 29666 | 0 |
| Mode SS | |||
|---|---|---|---|
| Quadrant | BADHDUFLAG | Total packets | Discarded packets |
| A | 0 | 150 | 0 |
| B | 0 | 150 | 0 |
| C | 0 | 150 | 0 |
| D | 0 | 150 | 0 |
| Quadrant | Total seconds | Saturated seconds | Saturation percentage |
|---|---|---|---|
| A | 7415 | 2788 | 37.599461% |
| B | 7416 | 52 | 0.701187% |
| C | 7415 | 82 | 1.105866% |
| D | 7415 | 1445 | 19.487525% |
Noise dominated data is calculated using 1-second bins in cleaned event files. If a bin has >2000 counts, and if more than 50% of those come from <1% of pixels, then it is considered to be noise-dominated and hence unusable.
| Quadrant | # 1 sec bins | Bins with >0 counts | Bins with >2000 counts | High rate bins dominated by noise | Noise dominated (total time) | Noise dominated (detector-on time) | Marked lightcurve |
|---|---|---|---|---|---|---|---|
| A | 7414 | 7414 | 2488 | 2488 | 33.56% | 33.56% | 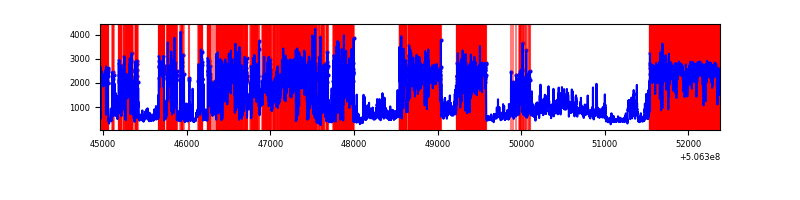 |
| B | 7416 | 7416 | 0 | 0 | 0.00% | 0.00% | 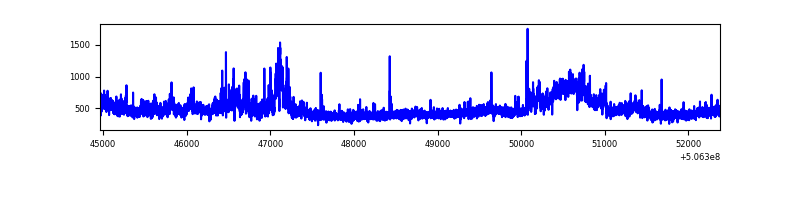 |
| C | 7415 | 7415 | 54 | 54 | 0.73% | 0.73% | 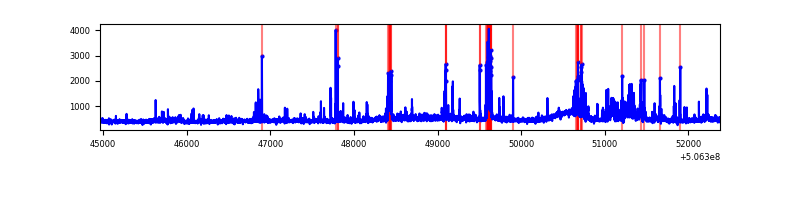 |
| D | 7414 | 7414 | 1289 | 1289 | 17.39% | 17.39% | 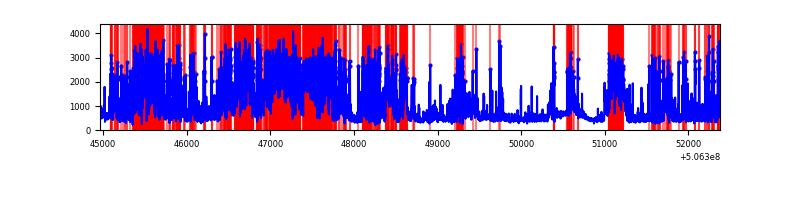 |
Top three noisy pixels from each quadrant. If the there are fewer than three noisy pixels in the level2.evt file, extra rows are filled as -1
| Pixel properties | Quadrant properties | ||||||
|---|---|---|---|---|---|---|---|
| Quadrant | DetID | PixID | Counts | Sigma | Mean | Median | Sigma |
| A | 15 | 32 | 7000137 | 45626.88 | 620 | 603 | 153.4 |
| A | 3 | 14 | 804974 | 5243.34 | 620 | 603 | 153.4 |
| A | 4 | 249 | 327822 | 2133.0 | 620 | 603 | 153.4 |
| B | 7 | 0 | 629694 | 3770.1 | 767 | 736 | 166.8 |
| B | 12 | 111 | 20366 | 117.67 | 767 | 736 | 166.8 |
| B | 11 | 111 | 19256 | 111.01 | 767 | 736 | 166.8 |
| C | 12 | 252 | 420974 | 2033.04 | 753 | 747 | 206.7 |
| C | 1 | 16 | 333131 | 1608.06 | 753 | 747 | 206.7 |
| C | 13 | 3 | 120159 | 577.71 | 753 | 747 | 206.7 |
| D | 11 | 129 | 4633573 | 23491.69 | 697 | 664 | 197.2 |
| D | 6 | 42 | 570426 | 2889.04 | 697 | 664 | 197.2 |
| D | 7 | 96 | 137205 | 692.35 | 697 | 664 | 197.2 |
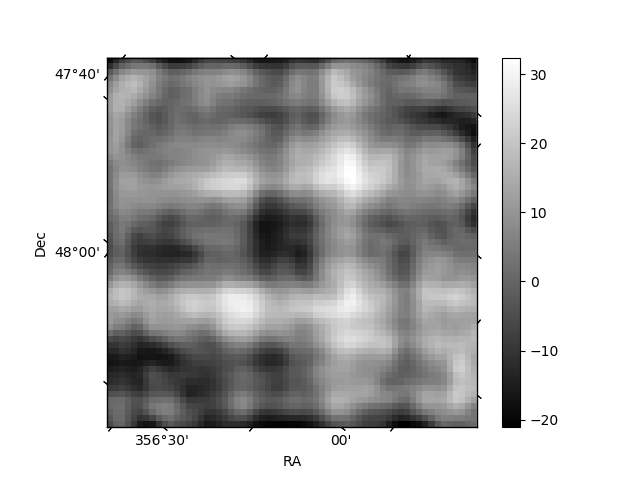
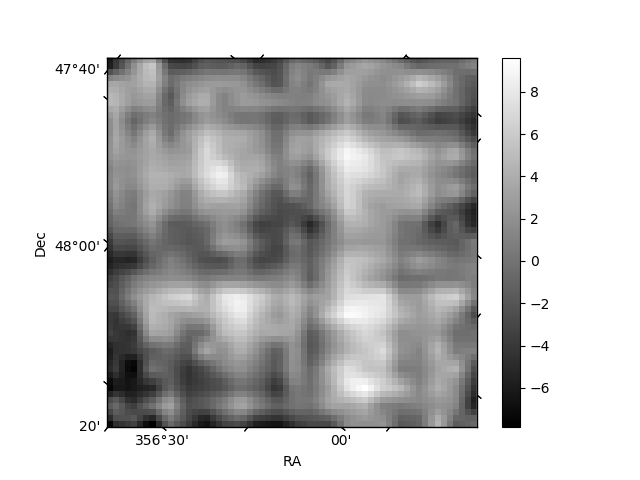
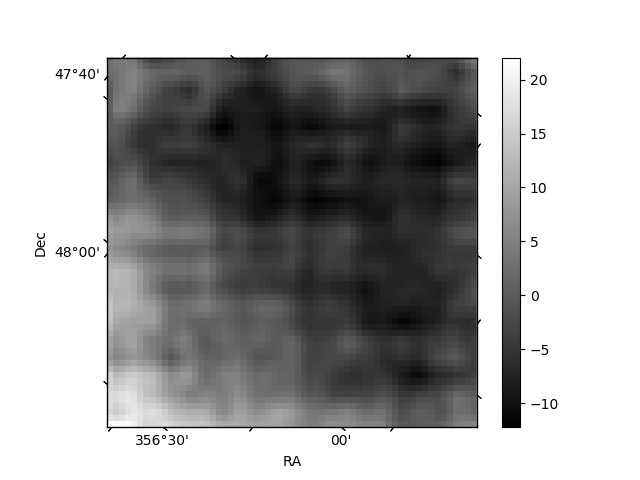
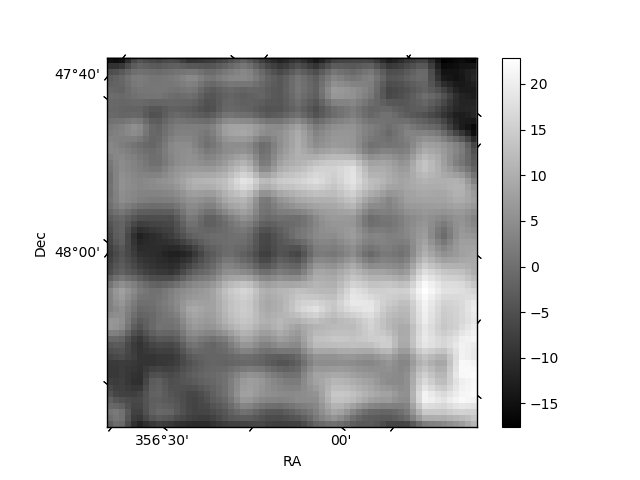
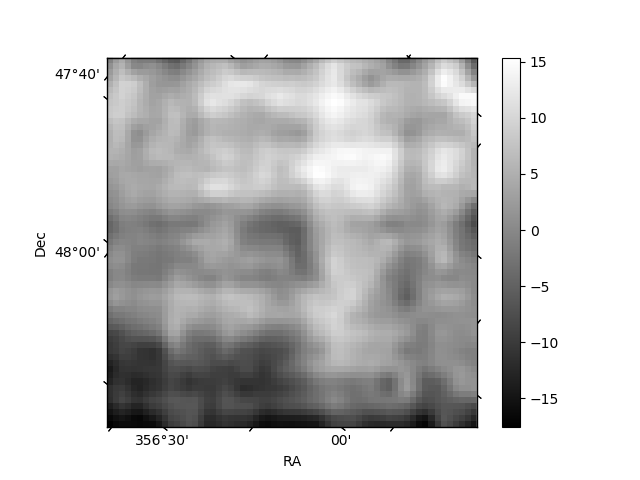
Histogram calculated using DETX and DETY for each event in the final _common_clean file
| Quadrant A | 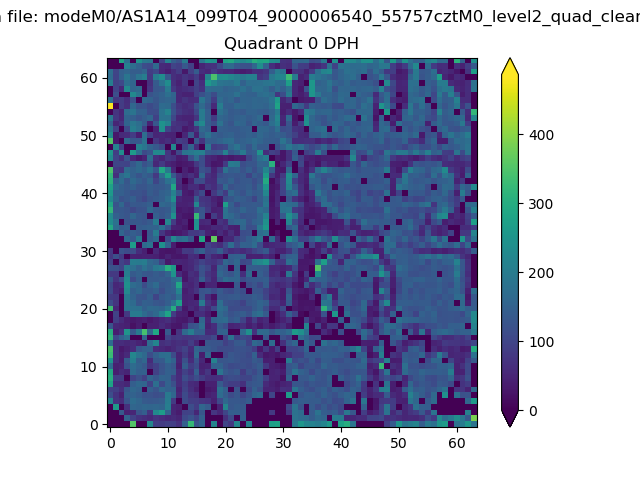 |
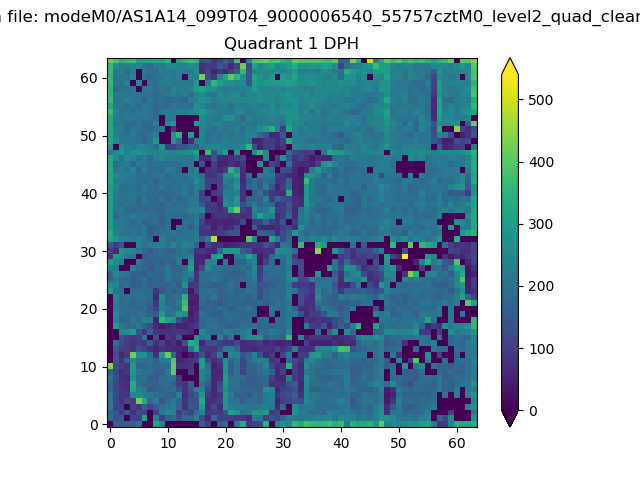 |
Quadrant B |
|---|---|---|---|
| Quadrant D | 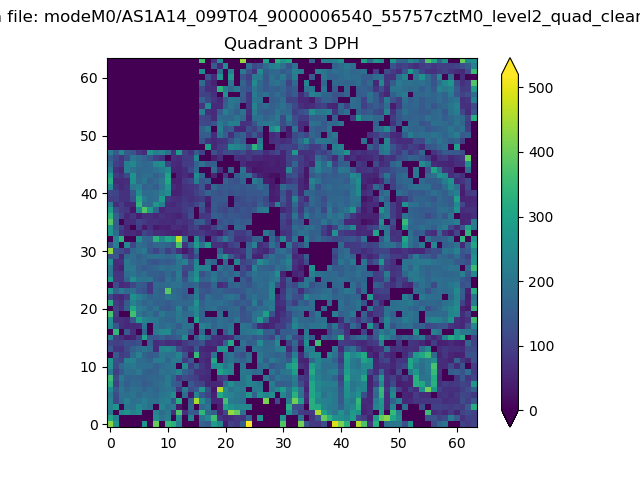 |
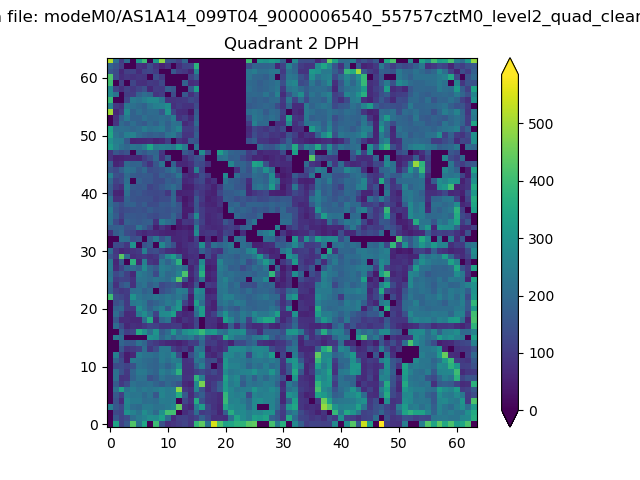 |
Quadrant C |
| Plot type | Count rate plots | Images |
|---|---|---|
| Comparison with Poisson distribution Blue bars denote a histogram of data divided into 1 sec bins. Red curve is a Poisson curve with rate = median count rate of data. |
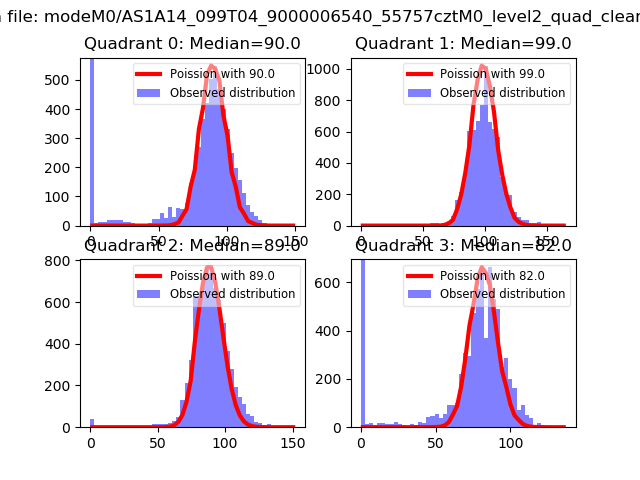 |
 |
| Quadrant-wise count rates Data is divided into 100 sec bins |
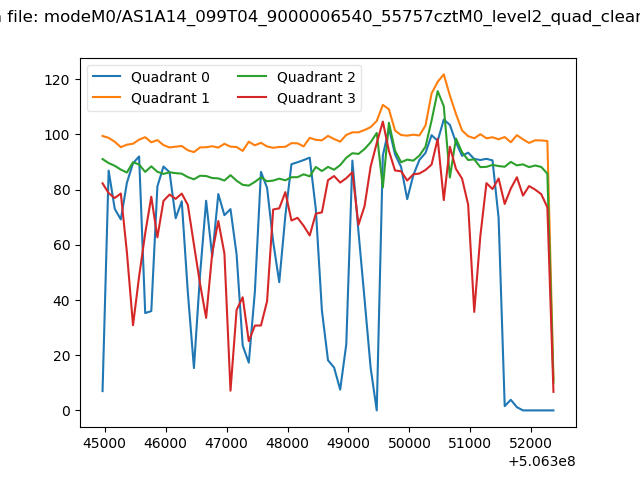 |
|
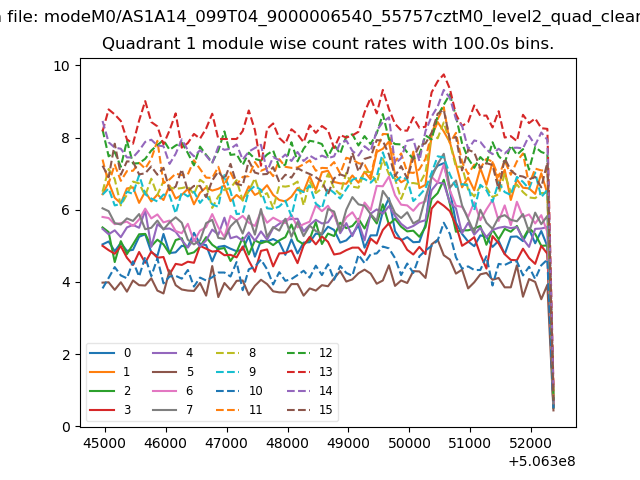
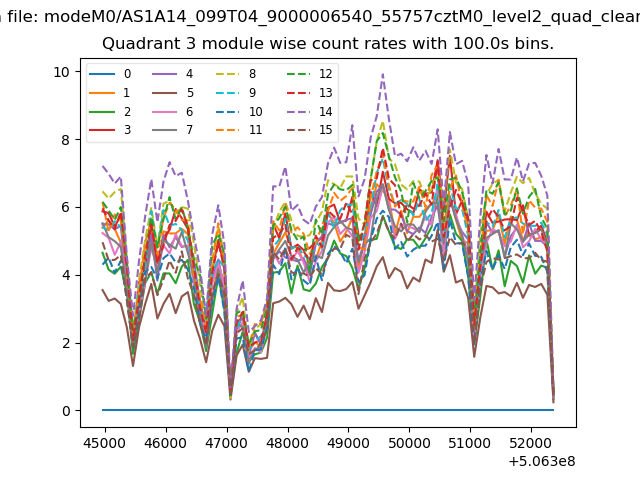
| Module-wise count rates for Quadrant A Data is divided into 100 sec bins |
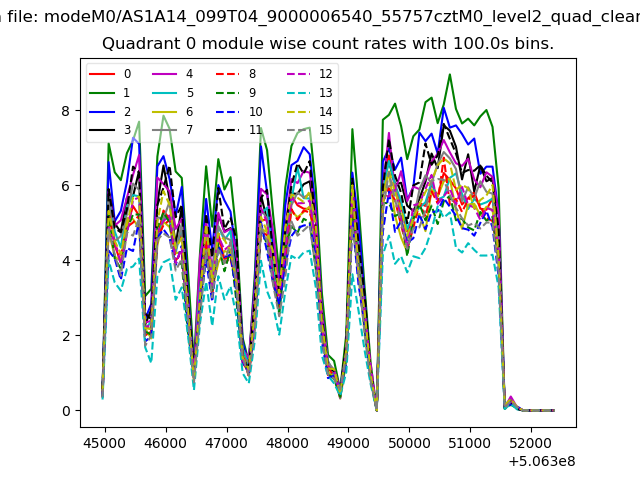 |
 |
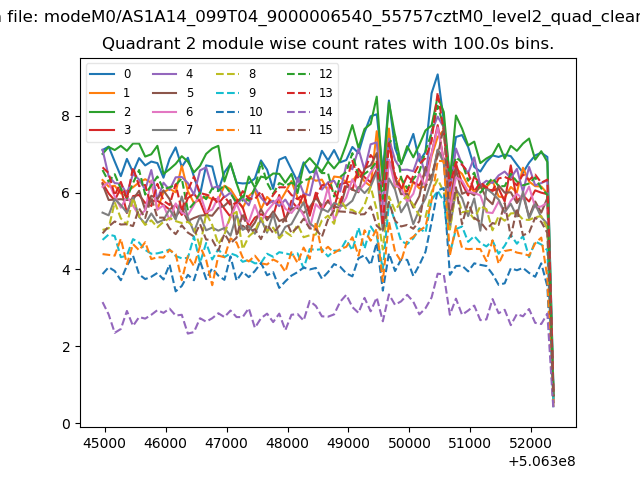
| Module-wise count rates for Quadrant B Data is divided into 100 sec bins |
 |
 |
| Module-wise count rates for Quadrant C Data is divided into 100 sec bins |
 |
 |
| Module-wise count rates for Quadrant D Data is divided into 100 sec bins |
 |
 |
| Parameter | Plot |
|---|---|
| CZT HV Monitor | 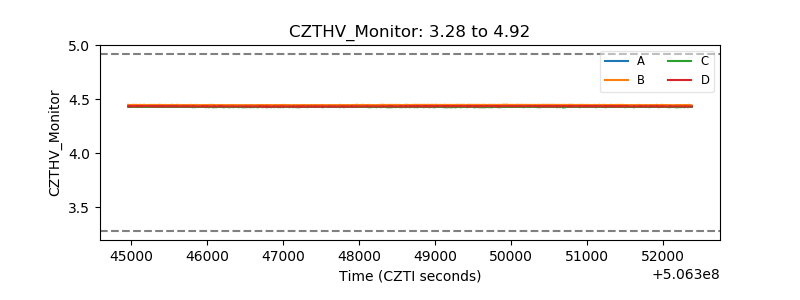 |
| D_VDD | 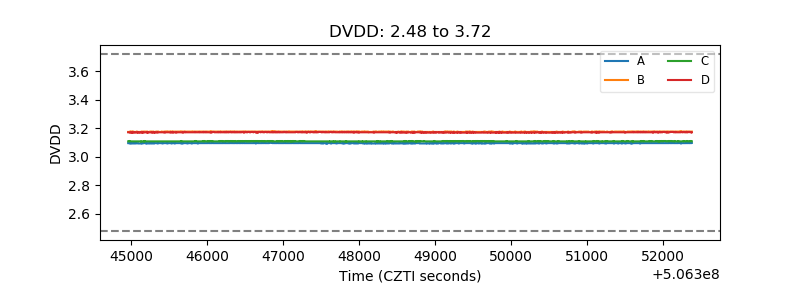 |
| Temperature 1 | 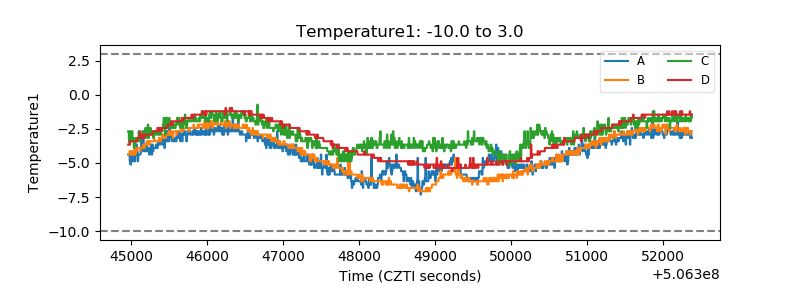 |
| Veto HV Monitor | 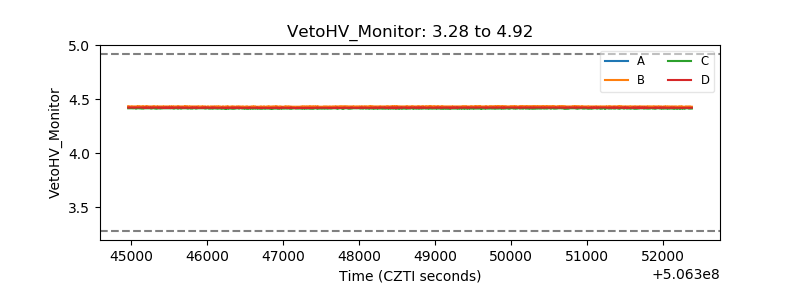 |
| Veto LLD | 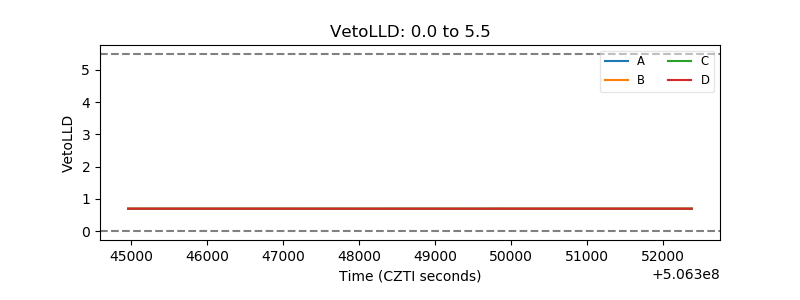 |
| Alpha Counter | 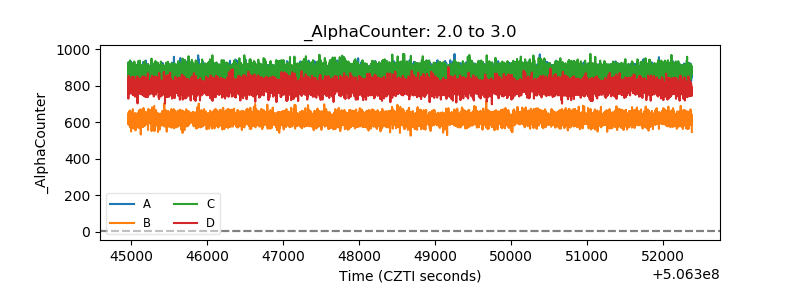 |
| _CPM_Rate | 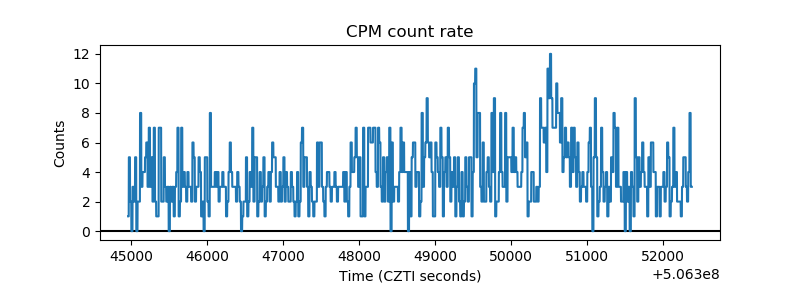 |
| CZT Counter | 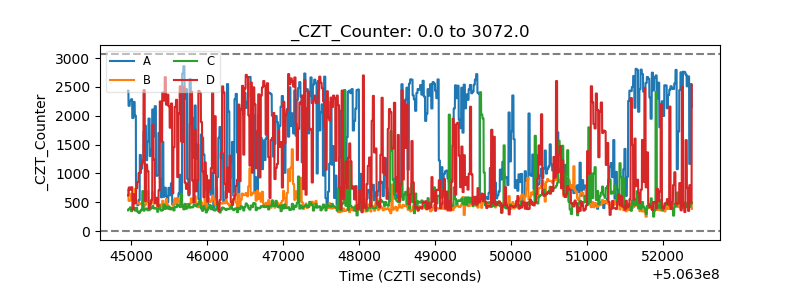 |
| +2.5 Volts monitor |  |
| +5 Volts monitor | 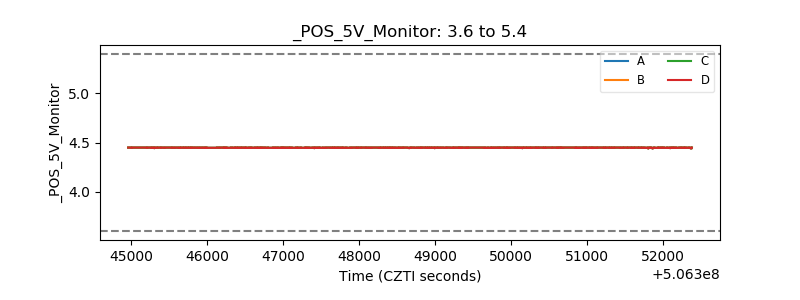 |
| _ROLL_ROT | 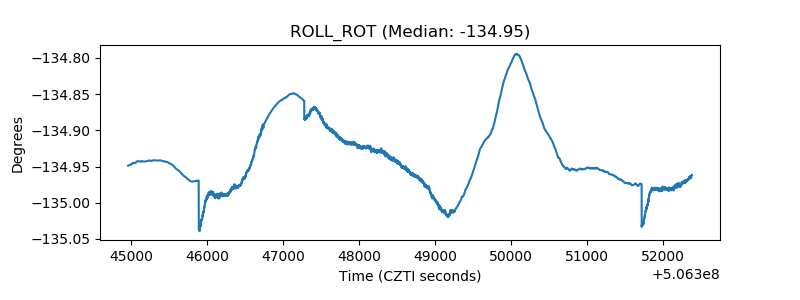 |
| _Roll_DEC | 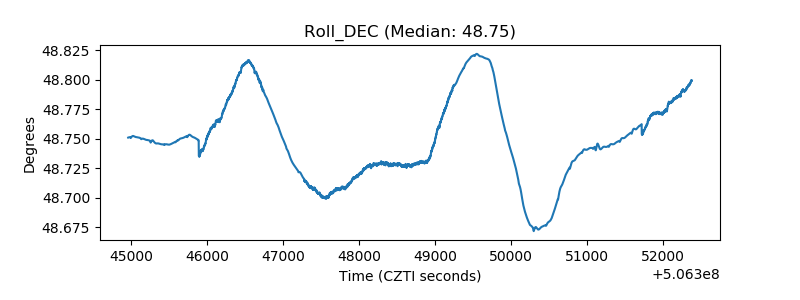 |
| _Roll_RA | 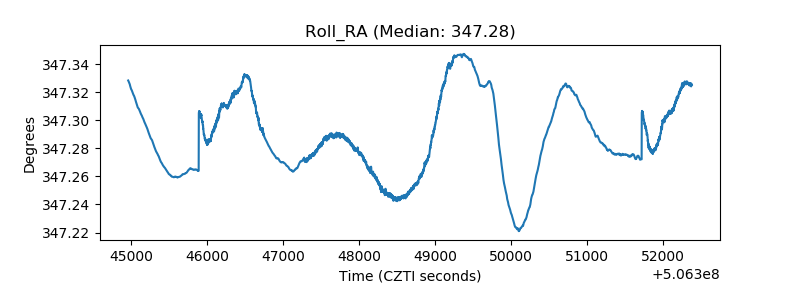 |
| Veto Counter | 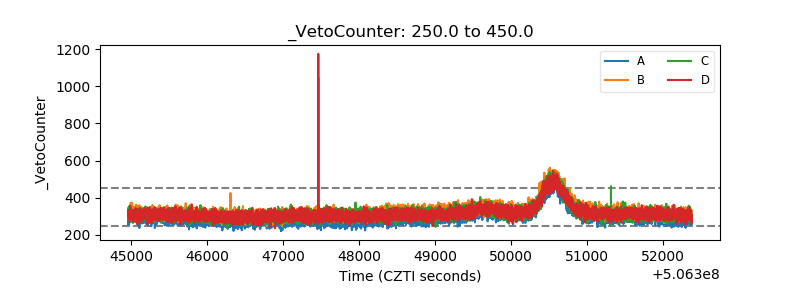 |