| Param | Original file | Final file |
|---|---|---|
| Filename | modeM0/AS1A14_099T04_9000006540_55760cztM0_level2.fits | modeM0/AS1A14_099T04_9000006540_55760cztM0_level2_quad_clean.evt |
| Size (bytes) | 1,974,841,920 | 220,366,080 |
| Size | 1.8 GB | 210.2 MB |
| Events in quadrant A | 32,399,564 | 803,091 |
| Events in quadrant B | 8,541,244 | 1,795,225 |
| Events in quadrant C | 9,736,990 | 1,602,733 |
| Events in quadrant D | 21,004,175 | 1,204,268 |
| Mode M0 | |||
|---|---|---|---|
| Quadrant | BADHDUFLAG | Total packets | Discarded packets |
| A | 0 | 108918 | 4 |
| B | 0 | 38996 | 3 |
| C | 0 | 41613 | 3 |
| D | 0 | 75392 | 3 |
| Mode M9 | |||
|---|---|---|---|
| Quadrant | BADHDUFLAG | Total packets | Discarded packets |
| A | 0 | 16 | 0 |
| B | 0 | 16 | 0 |
| C | 0 | 16 | 0 |
| D | 0 | 16 | 0 |
| Mode SS | |||
|---|---|---|---|
| Quadrant | BADHDUFLAG | Total packets | Discarded packets |
| A | 0 | 372 | 0 |
| B | 0 | 372 | 0 |
| C | 0 | 372 | 0 |
| D | 0 | 372 | 0 |
| Quadrant | Total seconds | Saturated seconds | Saturation percentage |
|---|---|---|---|
| A | 18378 | 10107 | 54.995103% |
| B | 18379 | 280 | 1.523478% |
| C | 18379 | 303 | 1.648621% |
| D | 18379 | 4132 | 22.482181% |
Noise dominated data is calculated using 1-second bins in cleaned event files. If a bin has >2000 counts, and if more than 50% of those come from <1% of pixels, then it is considered to be noise-dominated and hence unusable.
| Quadrant | # 1 sec bins | Bins with >0 counts | Bins with >2000 counts | High rate bins dominated by noise | Noise dominated (total time) | Noise dominated (detector-on time) | Marked lightcurve |
|---|---|---|---|---|---|---|---|
| A | 19823 | 18379 | 8878 | 8878 | 44.79% | 48.31% | 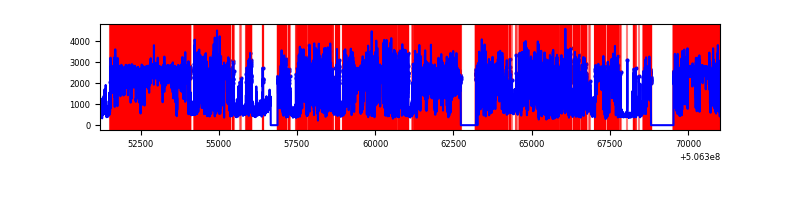 |
| B | 19824 | 18382 | 84 | 84 | 0.42% | 0.46% | 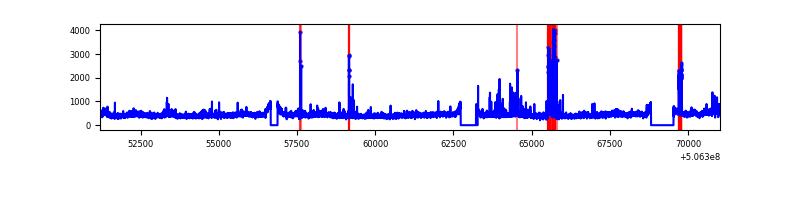 |
| C | 19824 | 18383 | 164 | 164 | 0.83% | 0.89% | 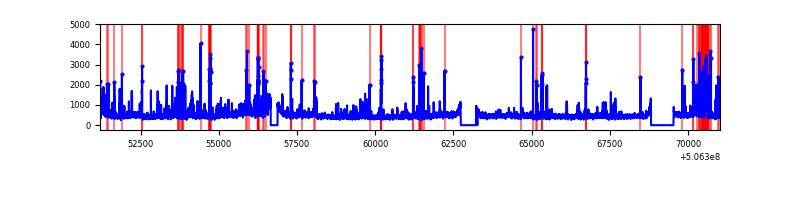 |
| D | 19823 | 18379 | 3620 | 3620 | 18.26% | 19.70% | 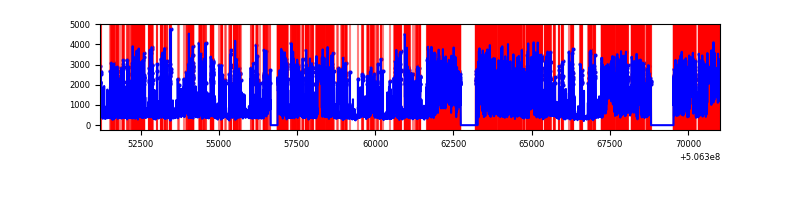 |
Top three noisy pixels from each quadrant. If the there are fewer than three noisy pixels in the level2.evt file, extra rows are filled as -1
| Pixel properties | Quadrant properties | ||||||
|---|---|---|---|---|---|---|---|
| Quadrant | DetID | PixID | Counts | Sigma | Mean | Median | Sigma |
| A | 15 | 32 | 25795902 | 80629.83 | 1300 | 1266 | 319.9 |
| A | 3 | 14 | 590055 | 1840.46 | 1300 | 1266 | 319.9 |
| A | 8 | 192 | 336175 | 1046.87 | 1300 | 1266 | 319.9 |
| B | 5 | 172 | 547698 | 1337.11 | 1894 | 1816 | 408.3 |
| B | 7 | 0 | 329839 | 803.47 | 1894 | 1816 | 408.3 |
| B | 4 | 206 | 55724 | 132.04 | 1894 | 1816 | 408.3 |
| C | 1 | 16 | 964146 | 1882.45 | 1879 | 1862 | 511.2 |
| C | 12 | 252 | 350734 | 682.47 | 1879 | 1862 | 511.2 |
| C | 9 | 38 | 334818 | 651.34 | 1879 | 1862 | 511.2 |
| D | 11 | 129 | 12349008 | 26226.83 | 1669 | 1595 | 470.8 |
| D | 7 | 96 | 836479 | 1773.36 | 1669 | 1595 | 470.8 |
| D | 7 | 70 | 539066 | 1141.63 | 1669 | 1595 | 470.8 |
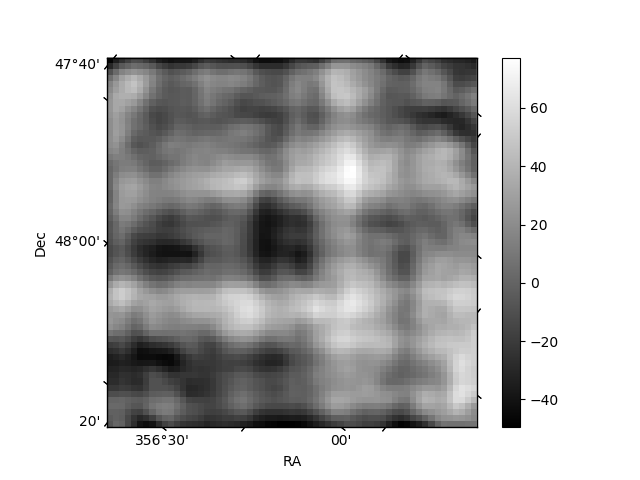
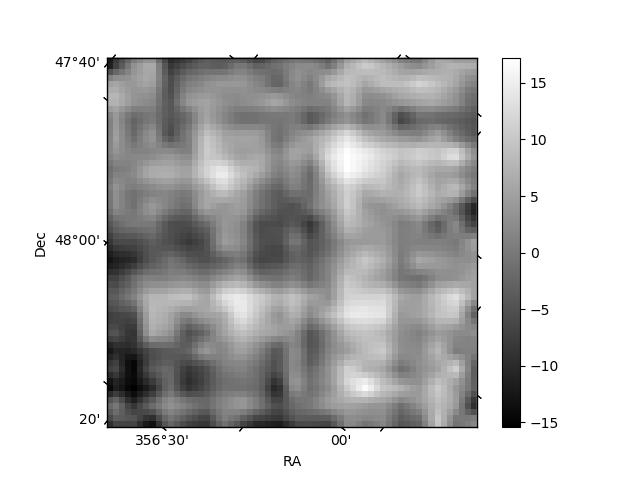
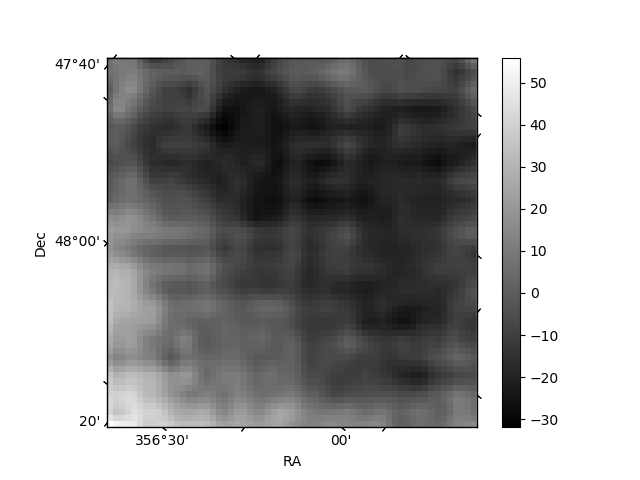
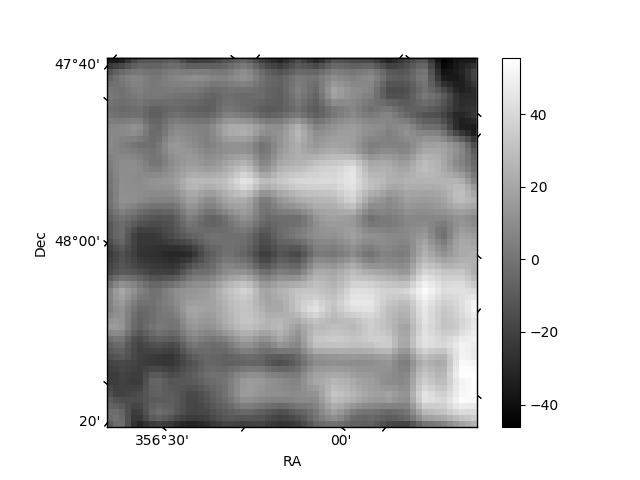
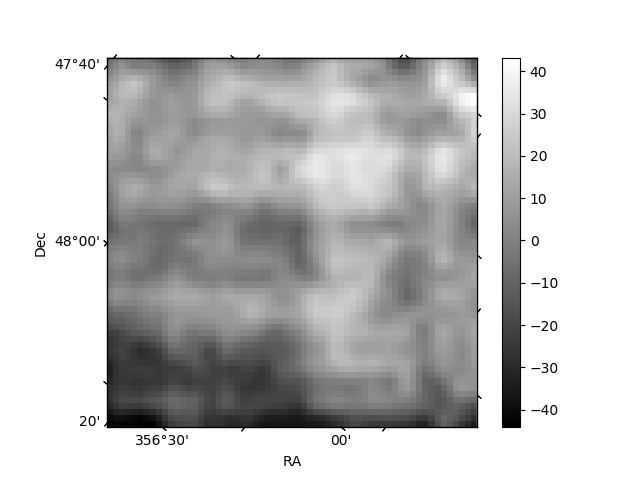
Histogram calculated using DETX and DETY for each event in the final _common_clean file
| Quadrant A | 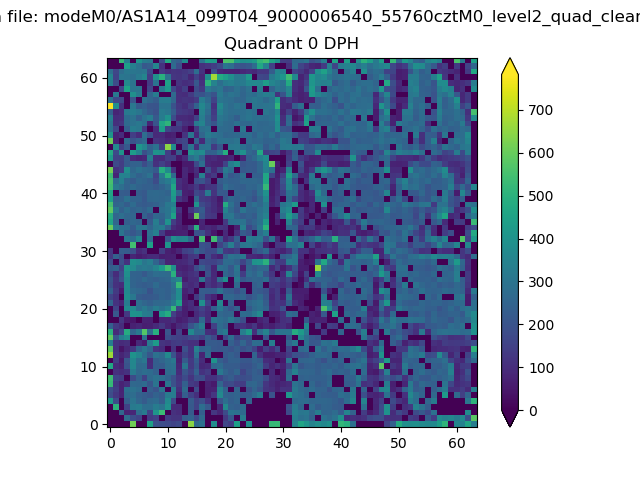 |
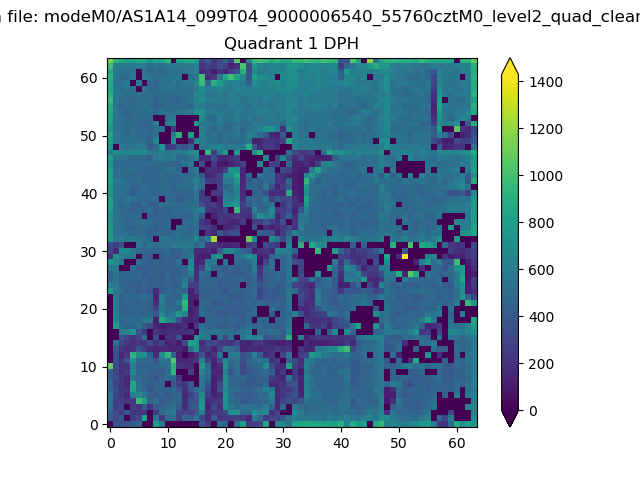 |
Quadrant B |
|---|---|---|---|
| Quadrant D | 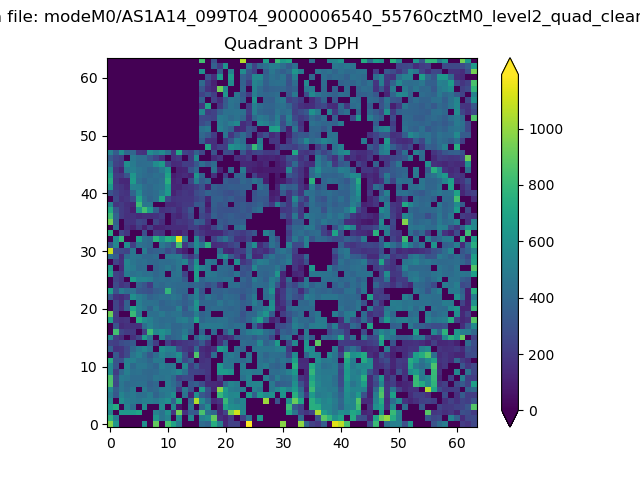 |
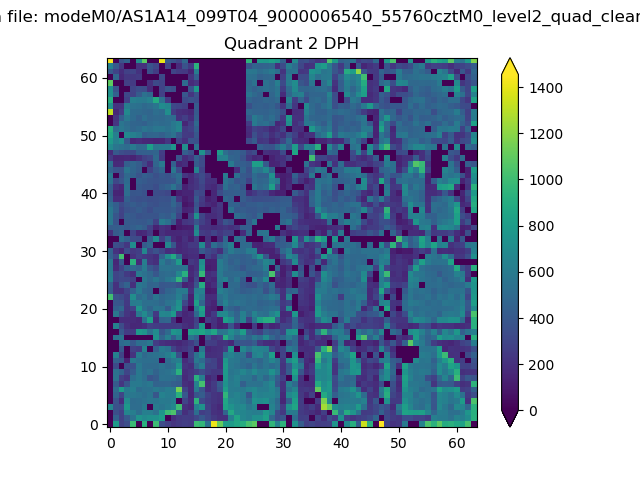 |
Quadrant C |
| Plot type | Count rate plots | Images |
|---|---|---|
| Comparison with Poisson distribution Blue bars denote a histogram of data divided into 1 sec bins. Red curve is a Poisson curve with rate = median count rate of data. |
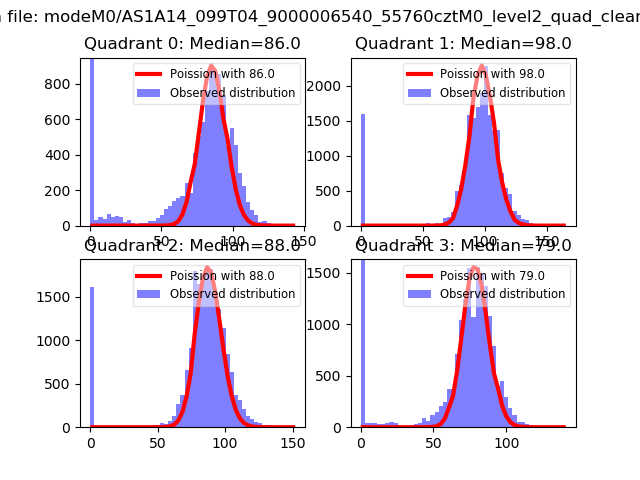 |
 |
| Quadrant-wise count rates Data is divided into 100 sec bins |
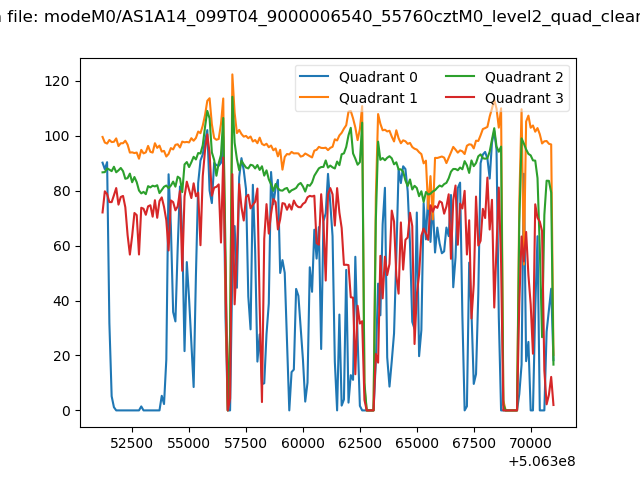 |
|
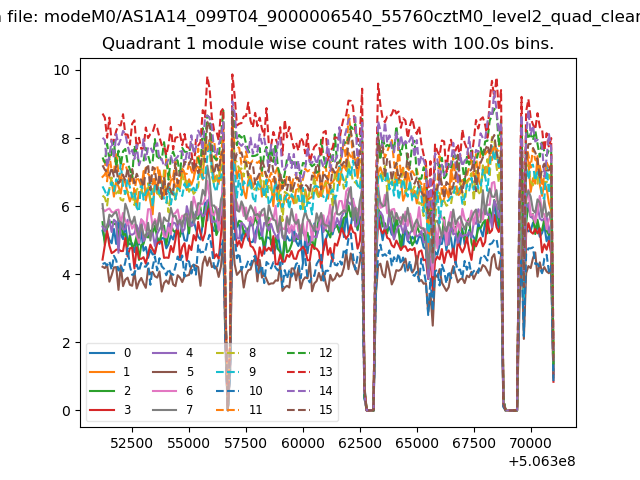
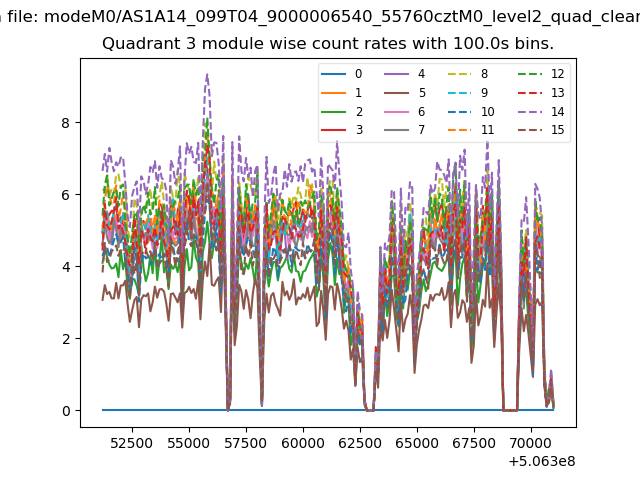
| Module-wise count rates for Quadrant A Data is divided into 100 sec bins |
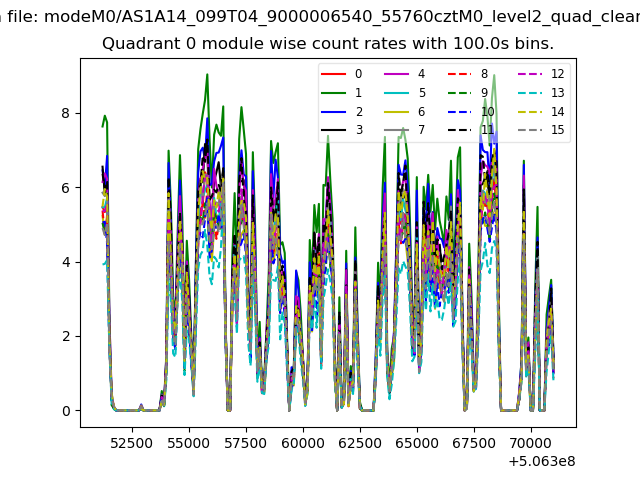 |
 |
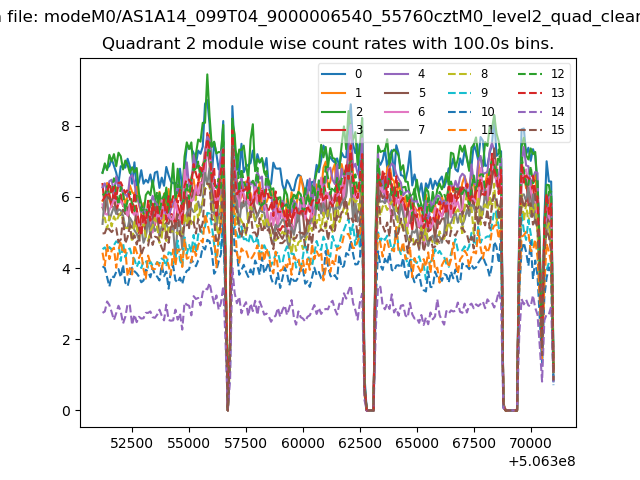
| Module-wise count rates for Quadrant B Data is divided into 100 sec bins |
 |
 |
| Module-wise count rates for Quadrant C Data is divided into 100 sec bins |
 |
 |
| Module-wise count rates for Quadrant D Data is divided into 100 sec bins |
 |
 |
| Parameter | Plot |
|---|---|
| CZT HV Monitor |  |
| D_VDD | 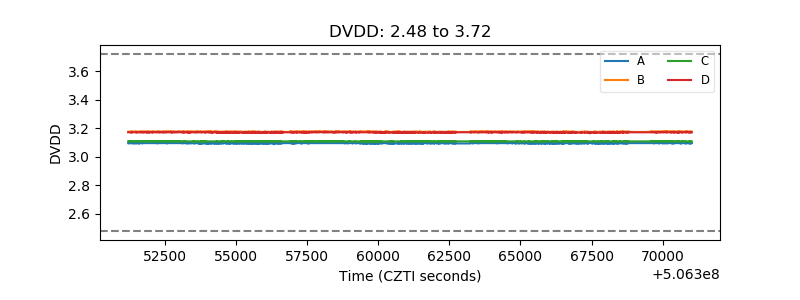 |
| Temperature 1 | 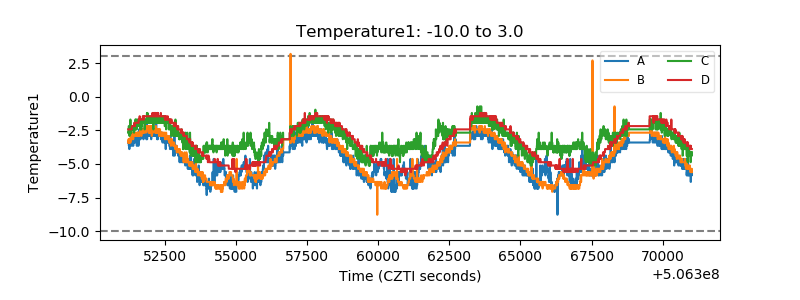 |
| Veto HV Monitor | 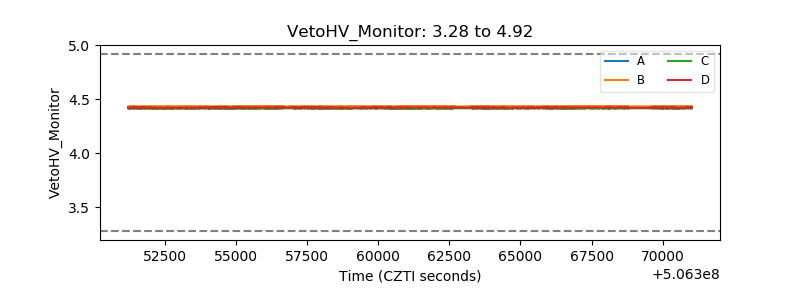 |
| Veto LLD | 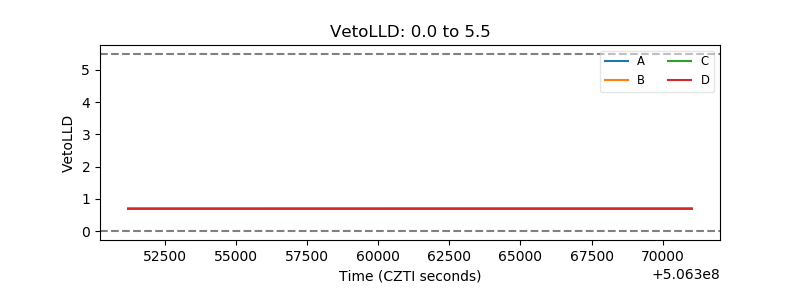 |
| Alpha Counter | 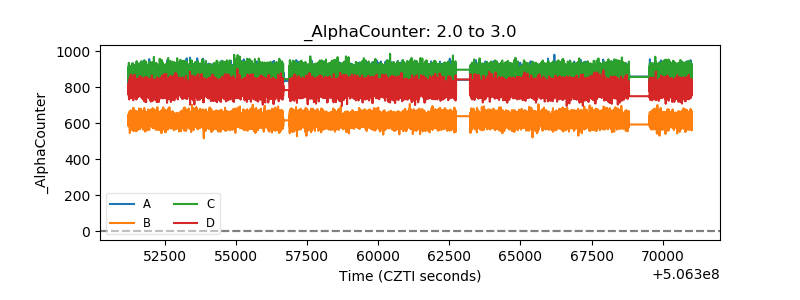 |
| _CPM_Rate | 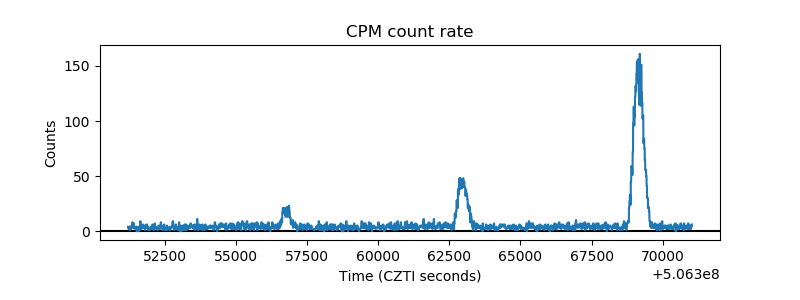 |
| CZT Counter | 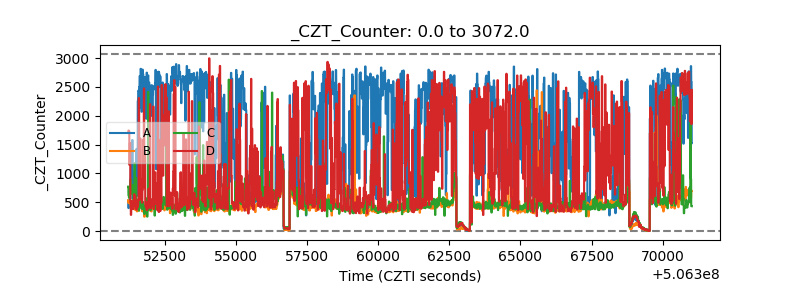 |
| +2.5 Volts monitor | 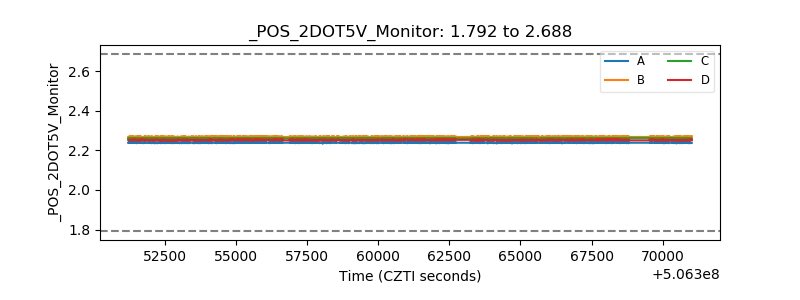 |
| +5 Volts monitor |  |
| _ROLL_ROT | 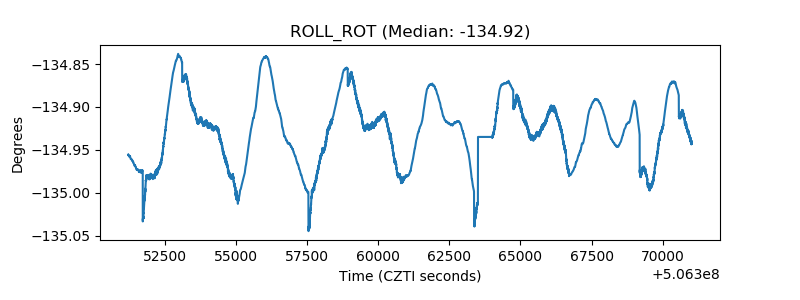 |
| _Roll_DEC | 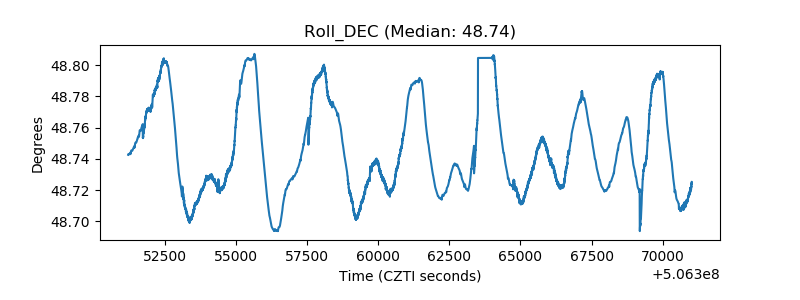 |
| _Roll_RA | 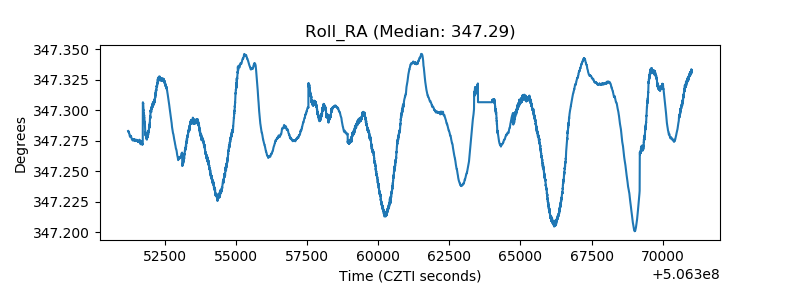 |
| Veto Counter | 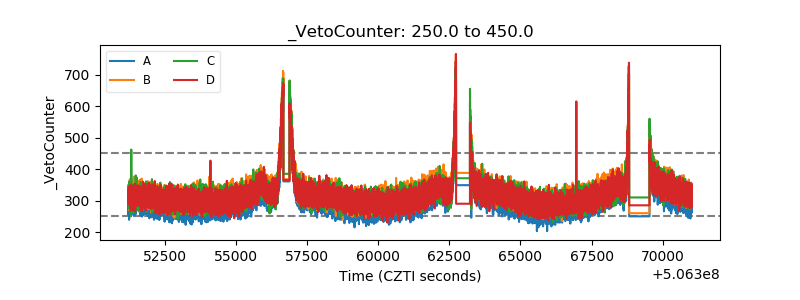 |