| Param | Original file | Final file |
|---|---|---|
| Filename | modeM0/AS1A14_099T04_9000006540_55761cztM0_level2.fits | modeM0/AS1A14_099T04_9000006540_55761cztM0_level2_quad_clean.evt |
| Size (bytes) | 973,457,280 | 75,585,600 |
| Size | 928.4 MB | 72.1 MB |
| Events in quadrant A | 14,154,587 | 232,596 |
| Events in quadrant B | 3,689,955 | 692,114 |
| Events in quadrant C | 4,194,040 | 616,338 |
| Events in quadrant D | 13,463,998 | 268,224 |
| Mode M0 | |||
|---|---|---|---|
| Quadrant | BADHDUFLAG | Total packets | Discarded packets |
| A | 0 | 46778 | 7 |
| B | 0 | 15492 | 2 |
| C | 0 | 16911 | 2 |
| D | 0 | 44731 | 2 |
| Mode M9 | |||
|---|---|---|---|
| Quadrant | BADHDUFLAG | Total packets | Discarded packets |
| A | 0 | 9 | 0 |
| B | 0 | 10 | 0 |
| C | 0 | 10 | 0 |
| D | 0 | 10 | 0 |
| Mode SS | |||
|---|---|---|---|
| Quadrant | BADHDUFLAG | Total packets | Discarded packets |
| A | 0 | 140 | 0 |
| B | 0 | 140 | 0 |
| C | 0 | 140 | 0 |
| D | 0 | 140 | 0 |
| Quadrant | Total seconds | Saturated seconds | Saturation percentage |
|---|---|---|---|
| A | 6873 | 4773 | 69.445657% |
| B | 6873 | 91 | 1.324022% |
| C | 6873 | 203 | 2.953586% |
| D | 6873 | 4036 | 58.722537% |
Noise dominated data is calculated using 1-second bins in cleaned event files. If a bin has >2000 counts, and if more than 50% of those come from <1% of pixels, then it is considered to be noise-dominated and hence unusable.
| Quadrant | # 1 sec bins | Bins with >0 counts | Bins with >2000 counts | High rate bins dominated by noise | Noise dominated (total time) | Noise dominated (detector-on time) | Marked lightcurve |
|---|---|---|---|---|---|---|---|
| A | 7798 | 6873 | 4378 | 4378 | 56.14% | 63.70% | 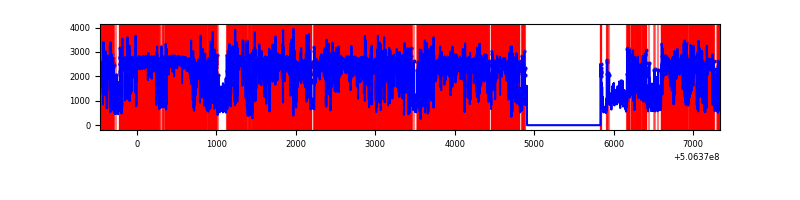 |
| B | 7798 | 6874 | 25 | 25 | 0.32% | 0.36% | 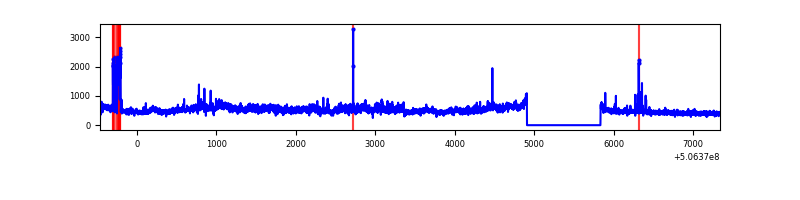 |
| C | 7798 | 6874 | 125 | 125 | 1.60% | 1.82% | 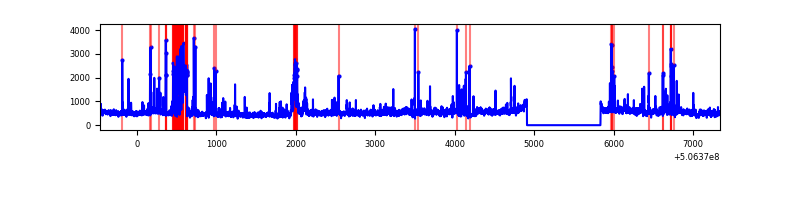 |
| D | 7797 | 6872 | 3919 | 3919 | 50.26% | 57.03% | 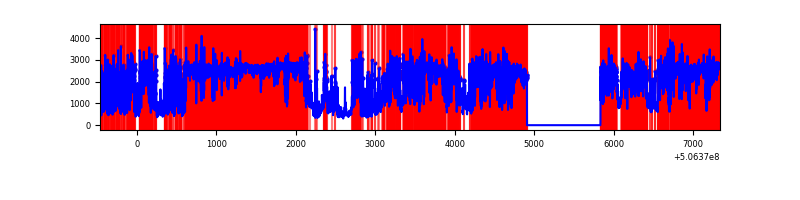 |
Top three noisy pixels from each quadrant. If the there are fewer than three noisy pixels in the level2.evt file, extra rows are filled as -1
| Pixel properties | Quadrant properties | ||||||
|---|---|---|---|---|---|---|---|
| Quadrant | DetID | PixID | Counts | Sigma | Mean | Median | Sigma |
| A | 15 | 32 | 11598349 | 103109.39 | 448 | 436 | 112.5 |
| A | 4 | 249 | 312781 | 2776.85 | 448 | 436 | 112.5 |
| A | 3 | 14 | 254206 | 2256.1 | 448 | 436 | 112.5 |
| B | 7 | 0 | 635761 | 4149.08 | 710 | 685 | 153.1 |
| B | 5 | 172 | 179940 | 1171.11 | 710 | 685 | 153.1 |
| B | 7 | 252 | 25224 | 160.32 | 710 | 685 | 153.1 |
| C | 1 | 16 | 681459 | 3516.25 | 703 | 696 | 193.6 |
| C | 9 | 38 | 410401 | 2116.19 | 703 | 696 | 193.6 |
| C | 9 | 237 | 117175 | 601.63 | 703 | 696 | 193.6 |
| D | 11 | 129 | 11037717 | 79378.53 | 488 | 467 | 139.0 |
| D | 8 | 245 | 278584 | 2000.18 | 488 | 467 | 139.0 |
| D | 7 | 70 | 70787 | 505.73 | 488 | 467 | 139.0 |
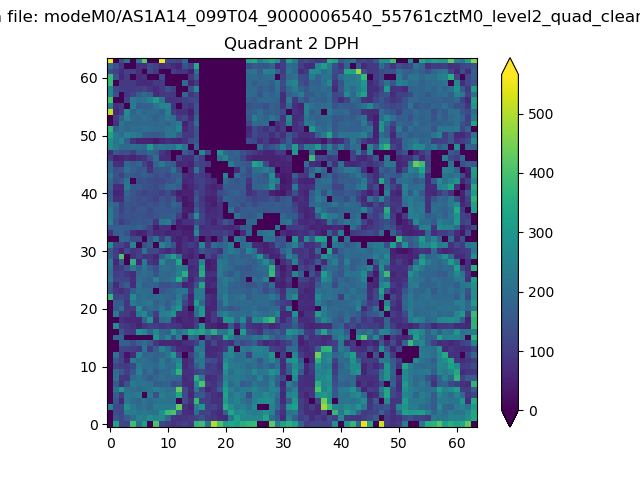
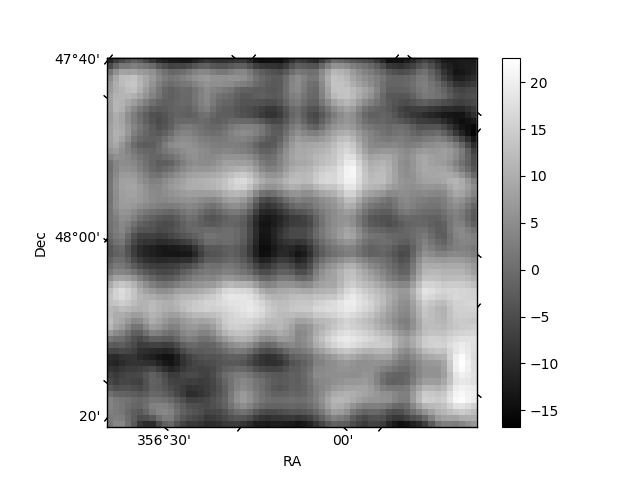
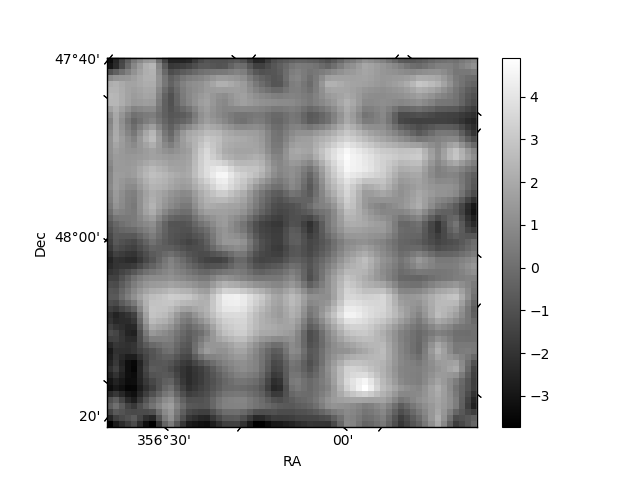
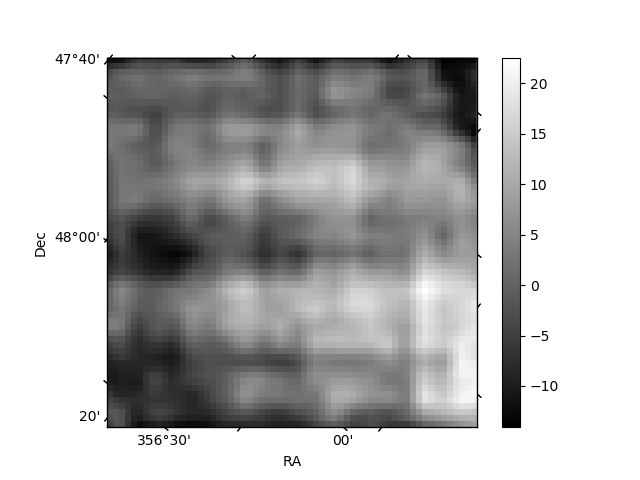
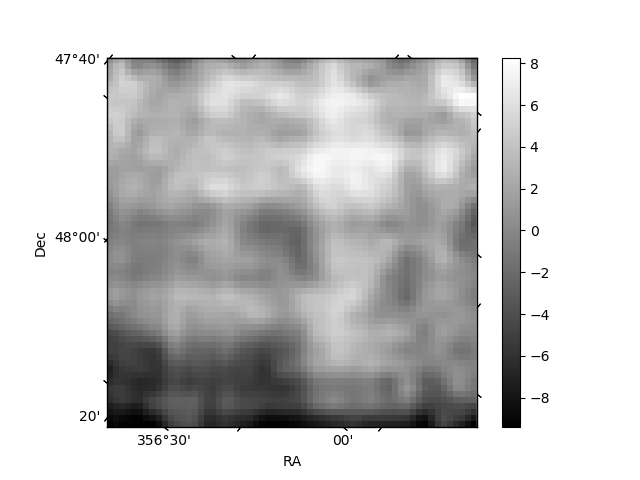
Histogram calculated using DETX and DETY for each event in the final _common_clean file
| Quadrant A | 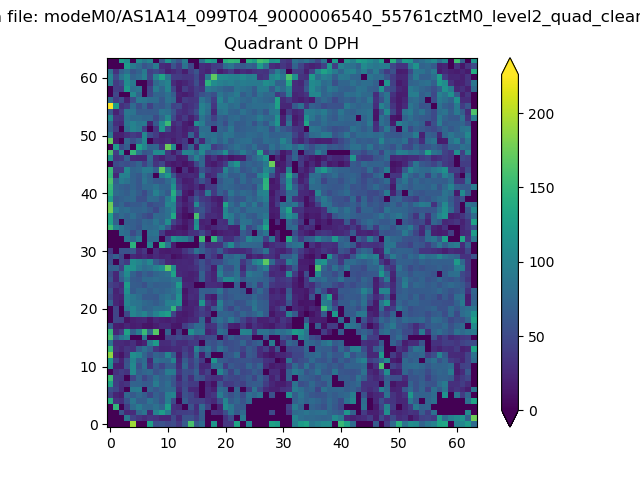 |
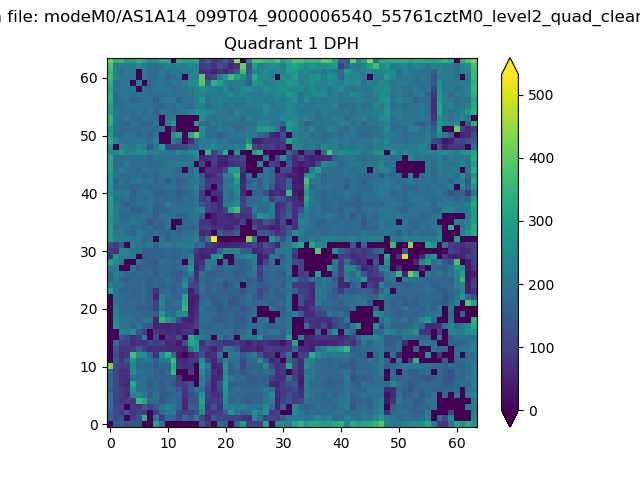 |
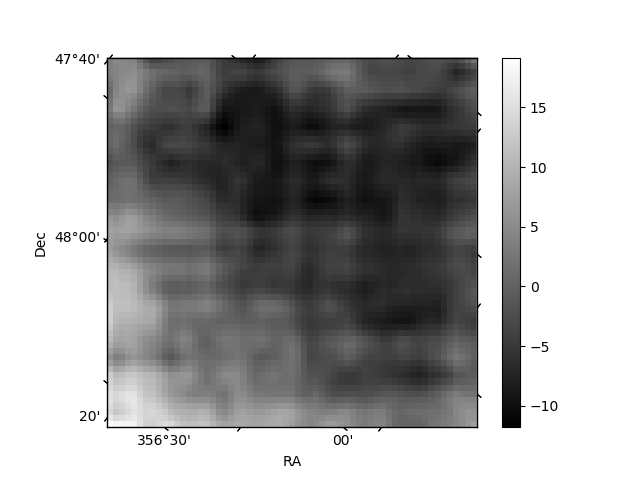
Quadrant B |
|---|---|---|---|
| Quadrant D | 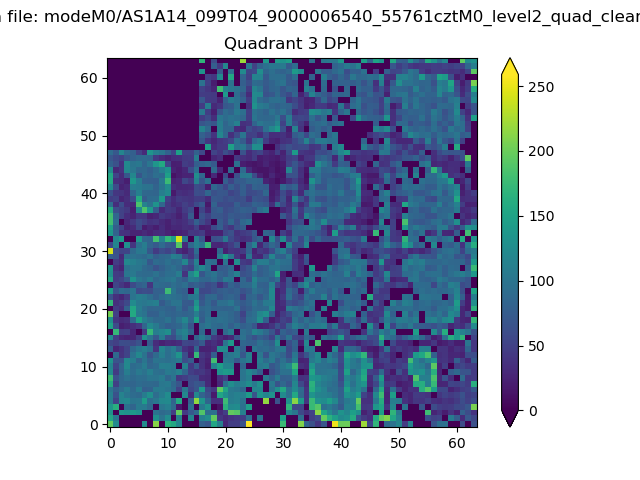 |
 |
Quadrant C |
| Plot type | Count rate plots | Images |
|---|---|---|
| Comparison with Poisson distribution Blue bars denote a histogram of data divided into 1 sec bins. Red curve is a Poisson curve with rate = median count rate of data. |
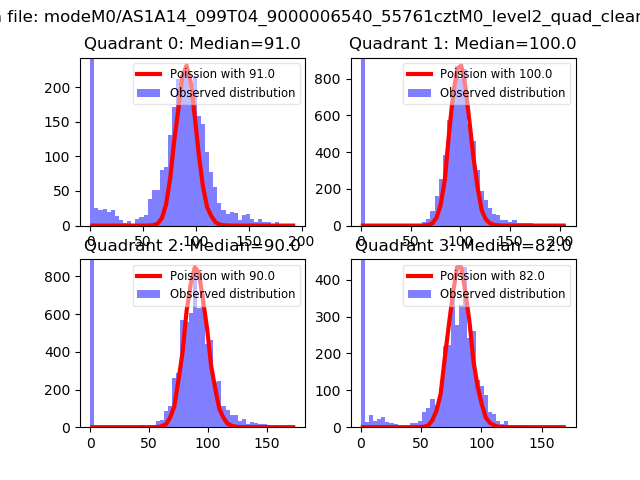 |
 |
| Quadrant-wise count rates Data is divided into 100 sec bins |
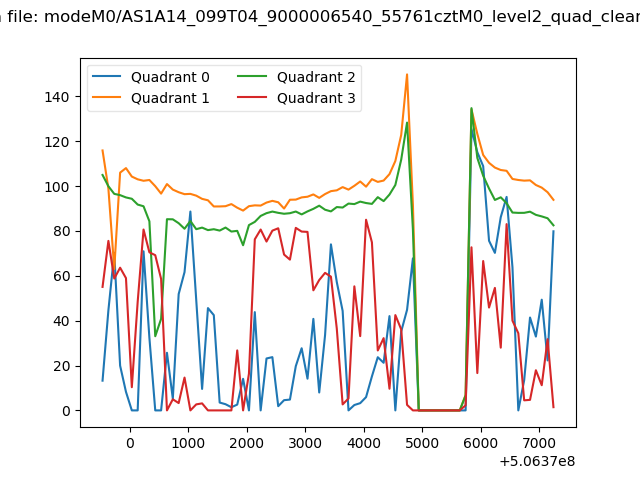 |
|
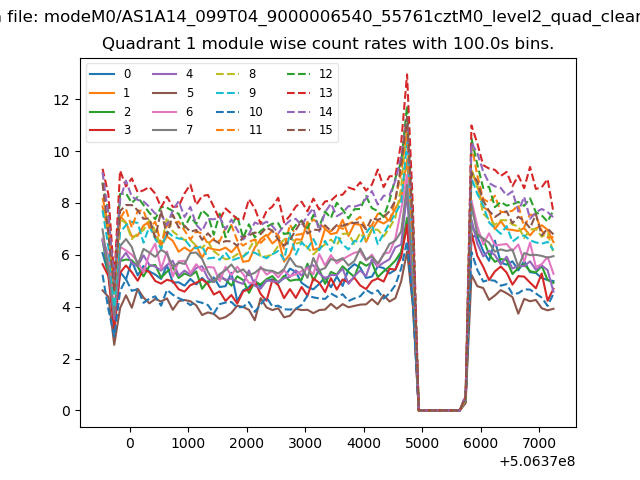
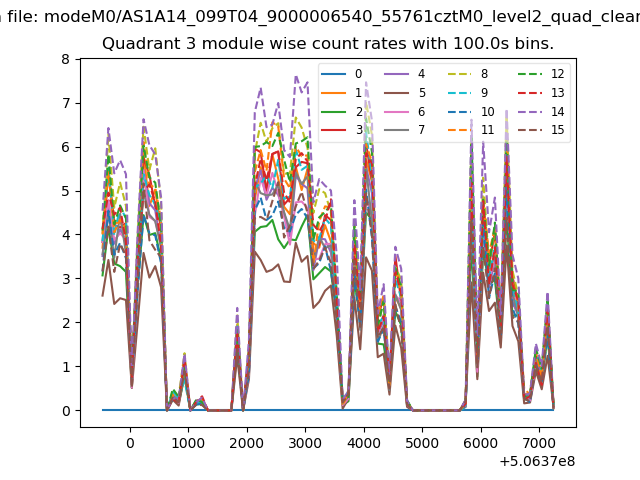
| Module-wise count rates for Quadrant A Data is divided into 100 sec bins |
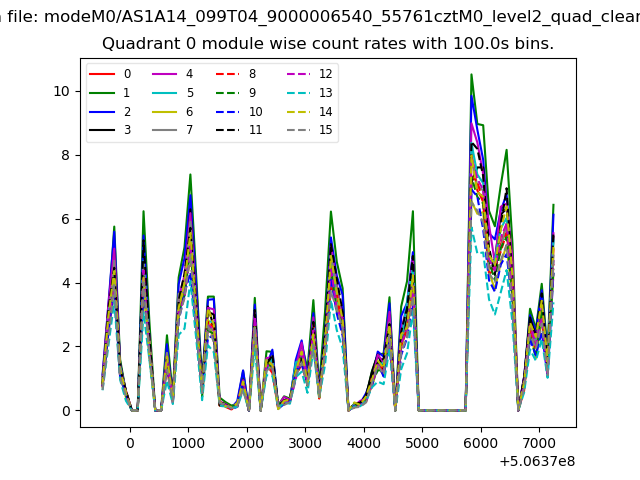 |
 |
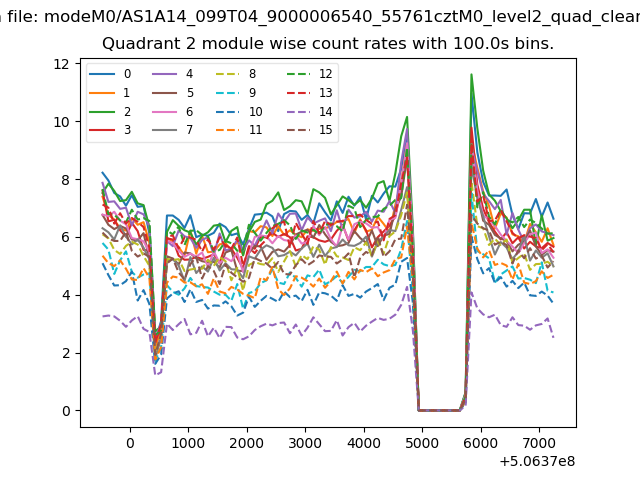
| Module-wise count rates for Quadrant B Data is divided into 100 sec bins |
 |
 |
| Module-wise count rates for Quadrant C Data is divided into 100 sec bins |
 |
 |
| Module-wise count rates for Quadrant D Data is divided into 100 sec bins |
 |
 |
| Parameter | Plot |
|---|---|
| CZT HV Monitor | 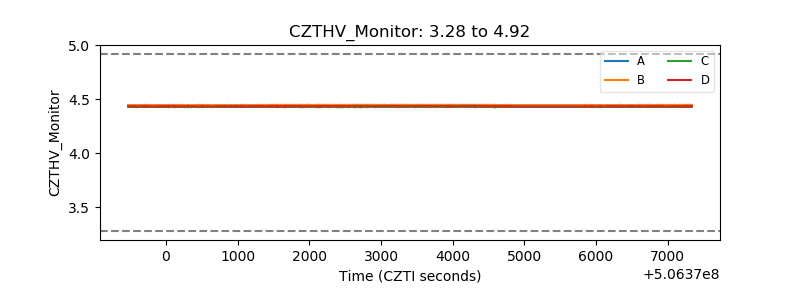 |
| D_VDD | 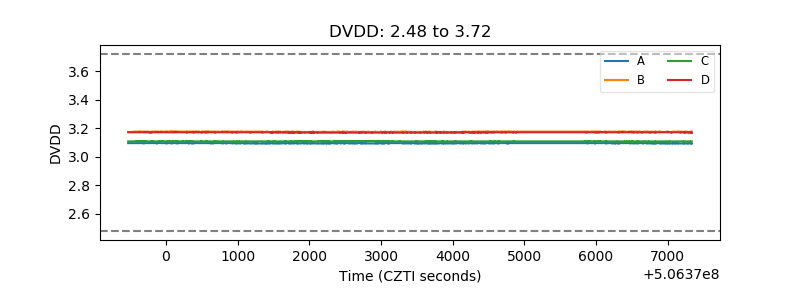 |
| Temperature 1 | 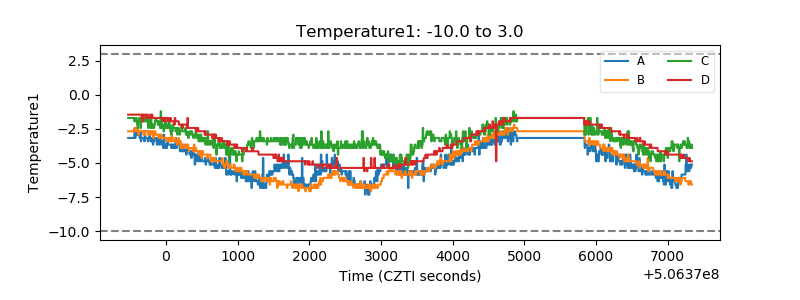 |
| Veto HV Monitor | 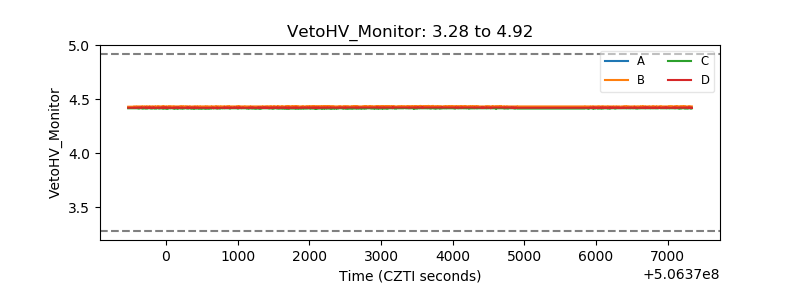 |
| Veto LLD | 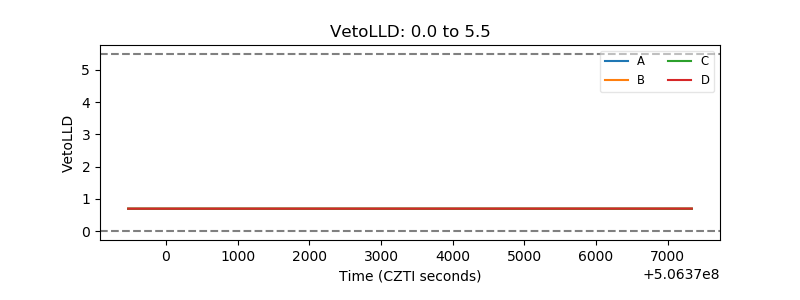 |
| Alpha Counter | 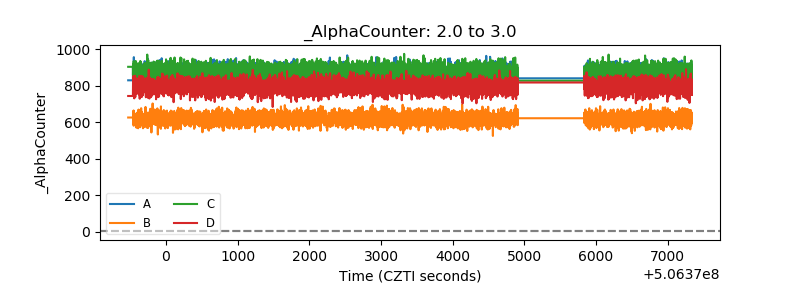 |
| _CPM_Rate | 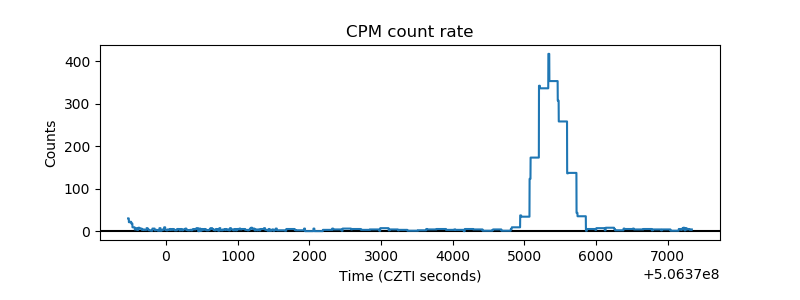 |
| CZT Counter | 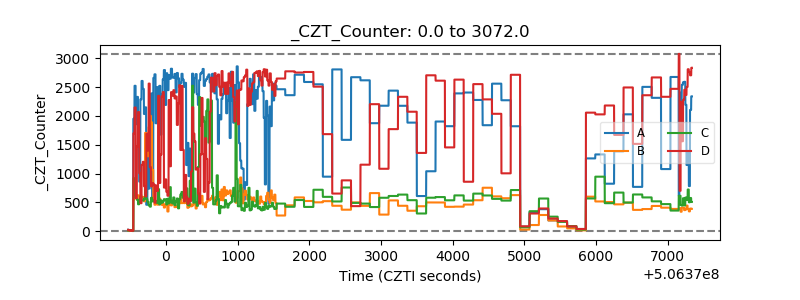 |
| +2.5 Volts monitor |  |
| +5 Volts monitor |  |
| _ROLL_ROT | 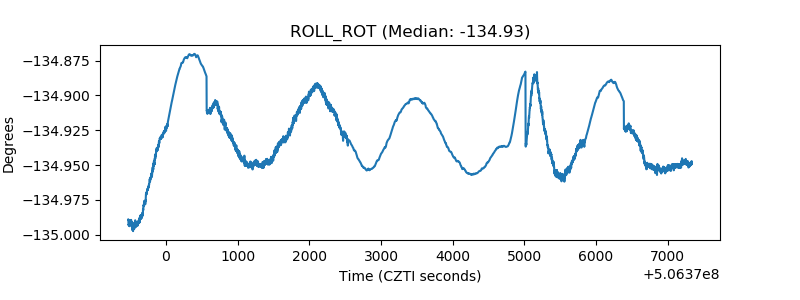 |
| _Roll_DEC | 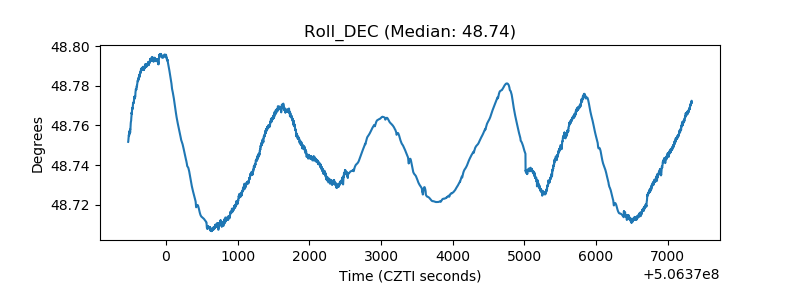 |
| _Roll_RA | 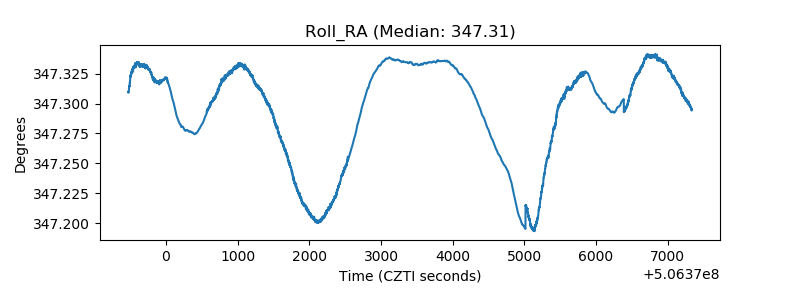 |
| Veto Counter | 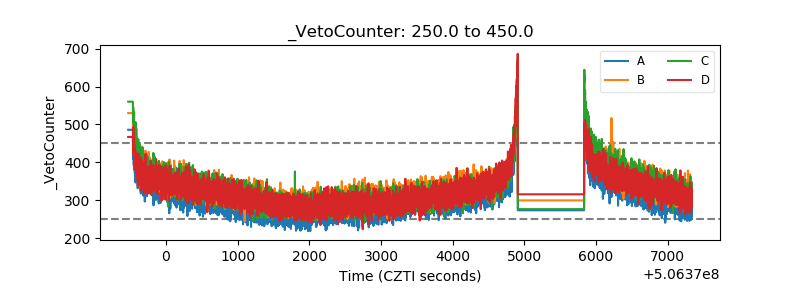 |