| Param | Original file | Final file |
|---|---|---|
| Filename | modeM0/AS1A14_099T04_9000006540_55763cztM0_level2.fits | modeM0/AS1A14_099T04_9000006540_55763cztM0_level2_quad_clean.evt |
| Size (bytes) | 813,634,560 | 74,471,040 |
| Size | 775.9 MB | 71.0 MB |
| Events in quadrant A | 11,141,495 | 352,014 |
| Events in quadrant B | 2,691,402 | 643,115 |
| Events in quadrant C | 3,292,899 | 578,097 |
| Events in quadrant D | 12,503,662 | 241,274 |
| Mode M0 | |||
|---|---|---|---|
| Quadrant | BADHDUFLAG | Total packets | Discarded packets |
| A | 0 | 37466 | 1 |
| B | 0 | 12942 | 1 |
| C | 0 | 13961 | 1 |
| D | 0 | 41505 | 1 |
| Mode M9 | |||
|---|---|---|---|
| Quadrant | BADHDUFLAG | Total packets | Discarded packets |
| A | 0 | 11 | 0 |
| B | 0 | 11 | 0 |
| C | 0 | 11 | 0 |
| D | 0 | 11 | 0 |
| Mode SS | |||
|---|---|---|---|
| Quadrant | BADHDUFLAG | Total packets | Discarded packets |
| A | 0 | 126 | 0 |
| B | 0 | 126 | 0 |
| C | 0 | 126 | 0 |
| D | 0 | 126 | 0 |
| Quadrant | Total seconds | Saturated seconds | Saturation percentage |
|---|---|---|---|
| A | 6313 | 2902 | 45.968636% |
| B | 6313 | 25 | 0.396008% |
| C | 6313 | 38 | 0.601933% |
| D | 6313 | 3755 | 59.480437% |
Noise dominated data is calculated using 1-second bins in cleaned event files. If a bin has >2000 counts, and if more than 50% of those come from <1% of pixels, then it is considered to be noise-dominated and hence unusable.
| Quadrant | # 1 sec bins | Bins with >0 counts | Bins with >2000 counts | High rate bins dominated by noise | Noise dominated (total time) | Noise dominated (detector-on time) | Marked lightcurve |
|---|---|---|---|---|---|---|---|
| A | 7378 | 6313 | 2690 | 2690 | 36.46% | 42.61% | 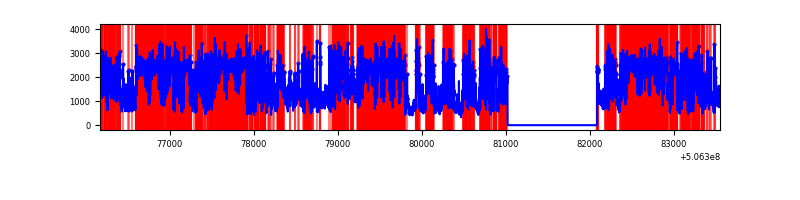 |
| B | 7378 | 6314 | 6 | 6 | 0.08% | 0.10% | 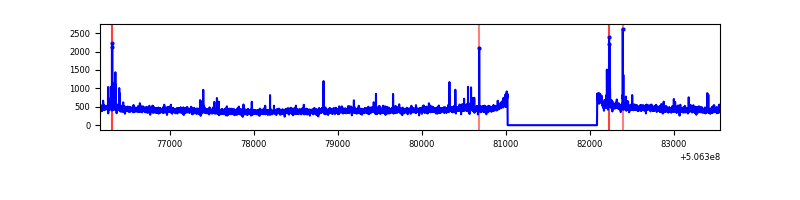 |
| C | 7378 | 6313 | 27 | 27 | 0.37% | 0.43% | 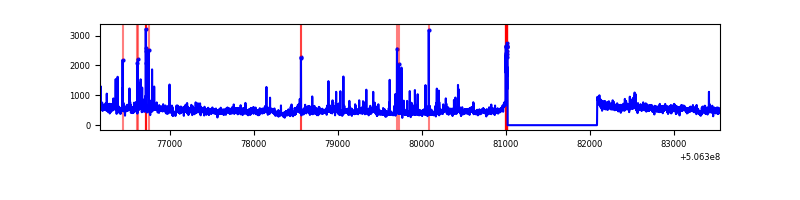 |
| D | 7378 | 6313 | 3722 | 3722 | 50.45% | 58.96% | 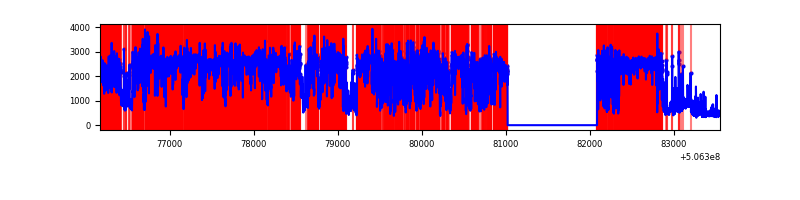 |
Top three noisy pixels from each quadrant. If the there are fewer than three noisy pixels in the level2.evt file, extra rows are filled as -1
| Pixel properties | Quadrant properties | ||||||
|---|---|---|---|---|---|---|---|
| Quadrant | DetID | PixID | Counts | Sigma | Mean | Median | Sigma |
| A | 15 | 32 | 8071562 | 63182.28 | 511 | 497 | 127.7 |
| A | 12 | 115 | 388591 | 3038.1 | 511 | 497 | 127.7 |
| A | 3 | 14 | 369357 | 2887.53 | 511 | 497 | 127.7 |
| B | 10 | 247 | 44465 | 310.38 | 654 | 628 | 141.2 |
| B | 7 | 252 | 20600 | 141.4 | 654 | 628 | 141.2 |
| B | 12 | 111 | 17138 | 116.89 | 654 | 628 | 141.2 |
| C | 1 | 16 | 501988 | 2813.32 | 646 | 640 | 178.2 |
| C | 12 | 250 | 91062 | 507.4 | 646 | 640 | 178.2 |
| C | 6 | 223 | 76233 | 424.19 | 646 | 640 | 178.2 |
| D | 11 | 129 | 10271056 | 78672.5 | 455 | 435 | 130.5 |
| D | 7 | 70 | 248816 | 1902.59 | 455 | 435 | 130.5 |
| D | 7 | 129 | 40174 | 304.4 | 455 | 435 | 130.5 |
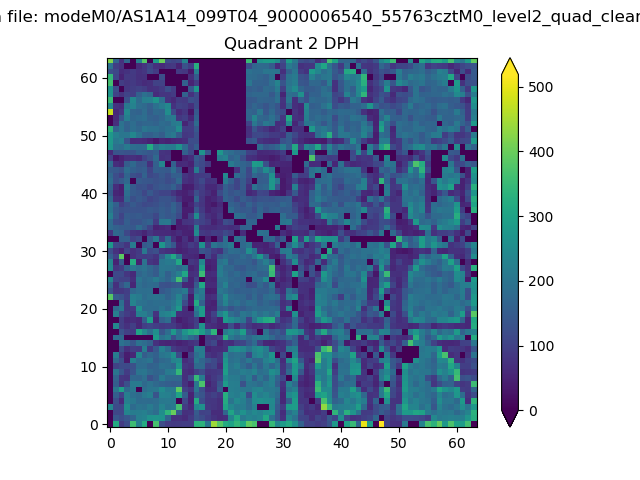
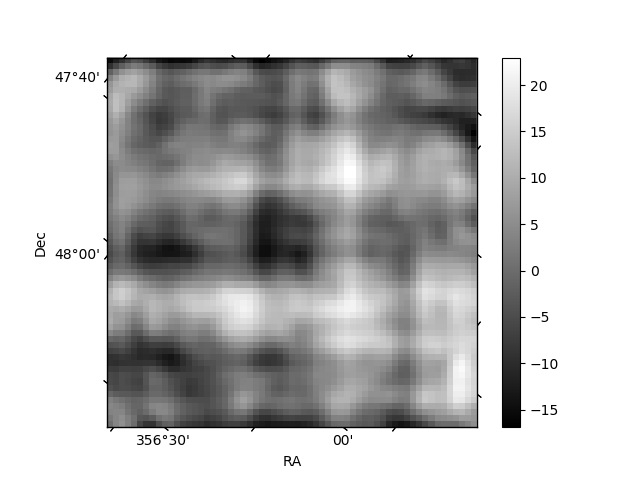
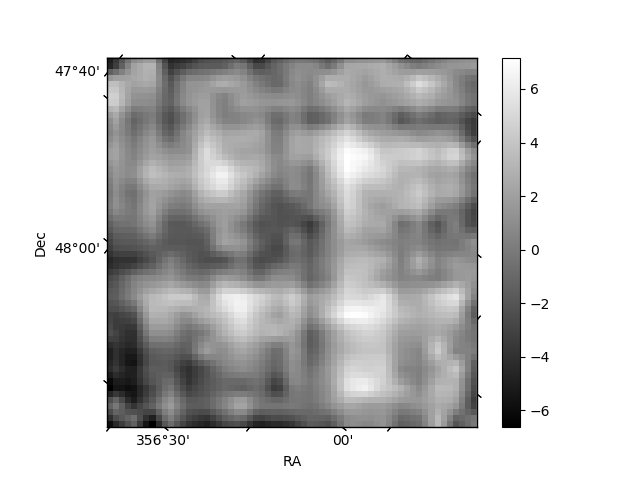
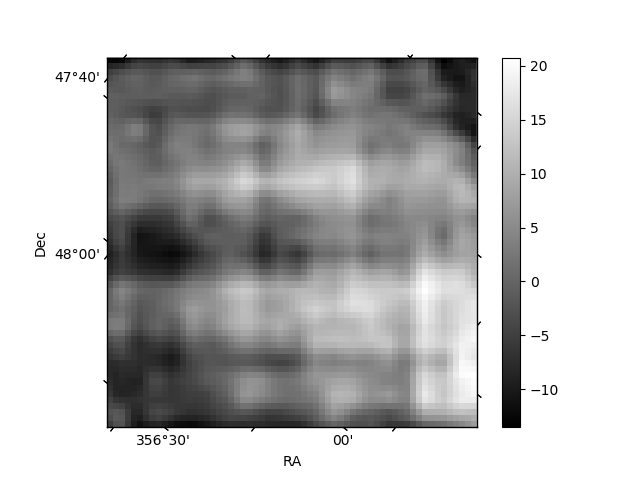
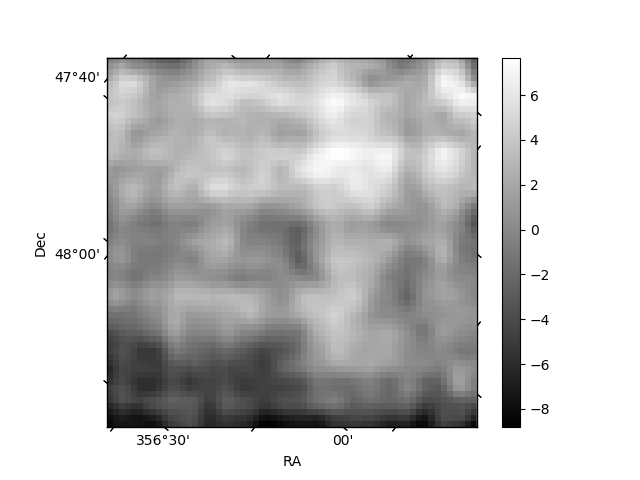
Histogram calculated using DETX and DETY for each event in the final _common_clean file
| Quadrant A | 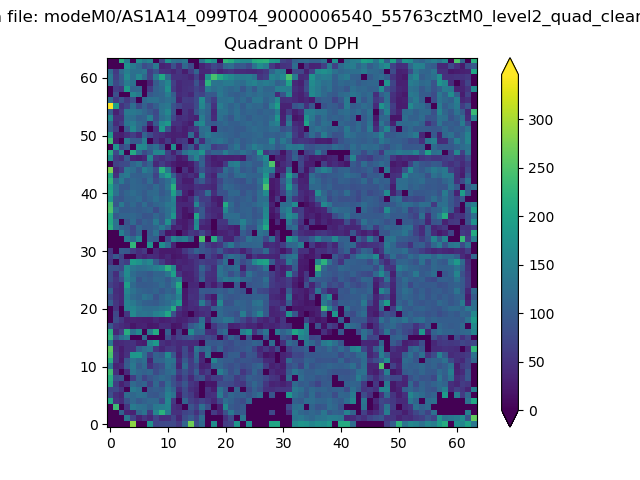 |
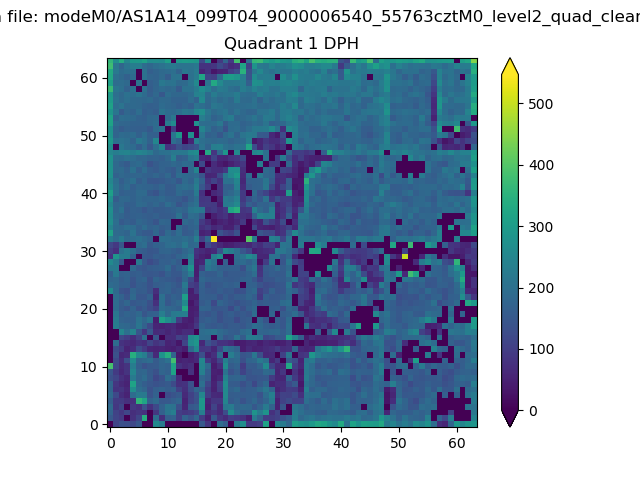 |
Quadrant B |
|---|---|---|---|
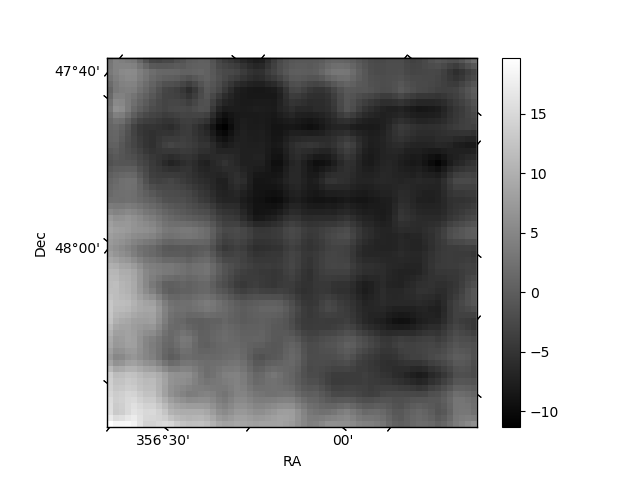
| Quadrant D | 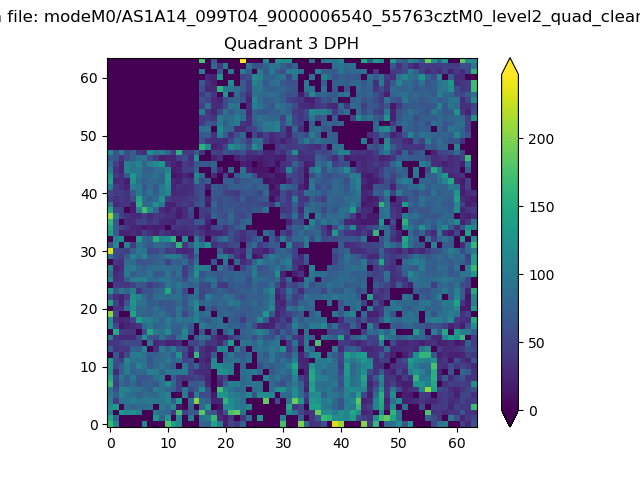 |
 |
Quadrant C |
| Plot type | Count rate plots | Images |
|---|---|---|
| Comparison with Poisson distribution Blue bars denote a histogram of data divided into 1 sec bins. Red curve is a Poisson curve with rate = median count rate of data. |
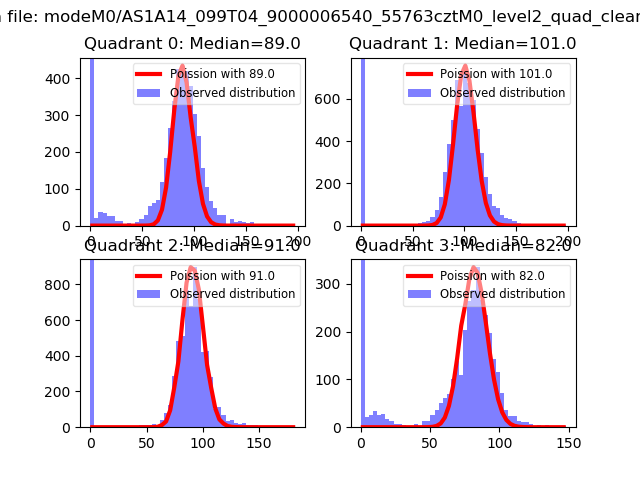 |
 |
| Quadrant-wise count rates Data is divided into 100 sec bins |
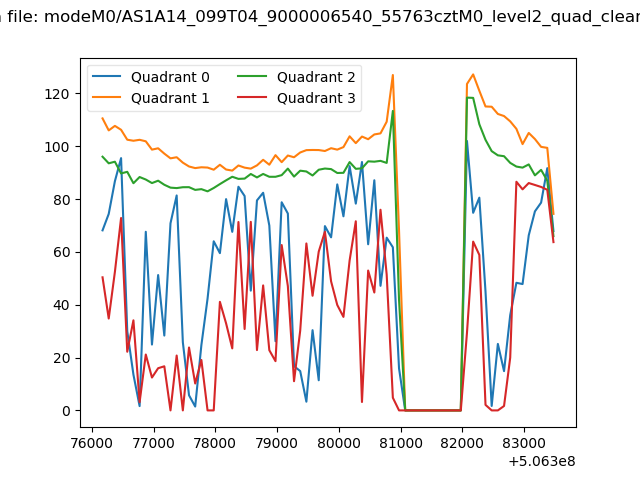 |
|
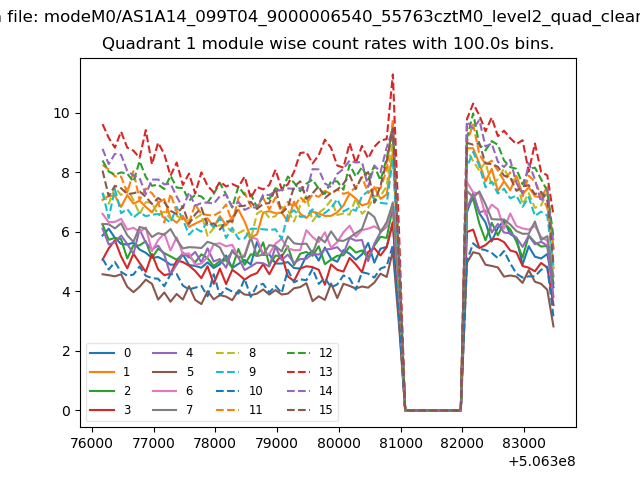
| Module-wise count rates for Quadrant A Data is divided into 100 sec bins |
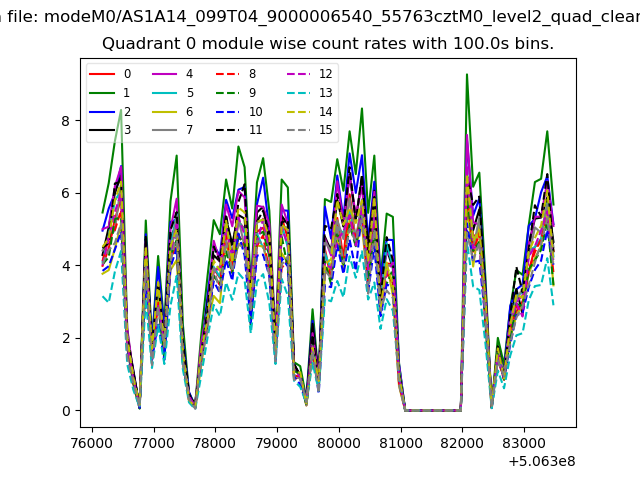 |
 |
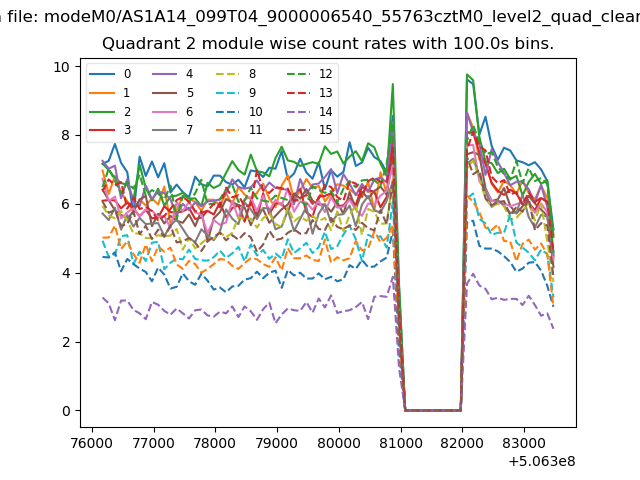
| Module-wise count rates for Quadrant B Data is divided into 100 sec bins |
 |
 |
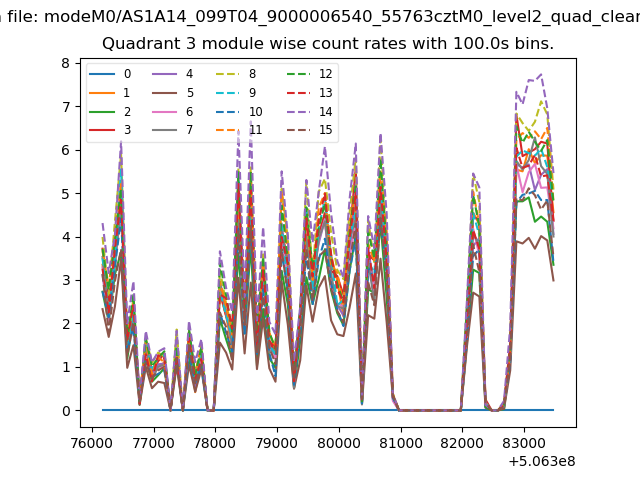
| Module-wise count rates for Quadrant C Data is divided into 100 sec bins |
 |
 |
| Module-wise count rates for Quadrant D Data is divided into 100 sec bins |
 |
 |
| Parameter | Plot |
|---|---|
| CZT HV Monitor | 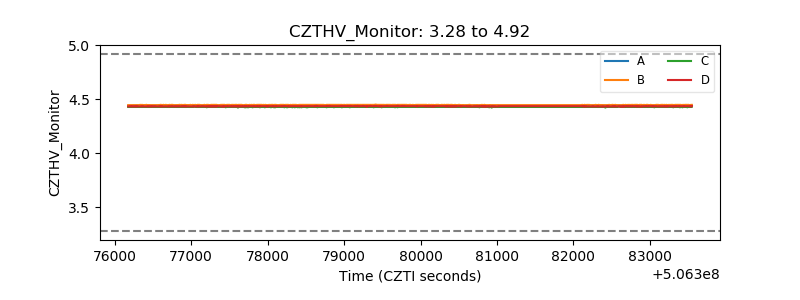 |
| D_VDD | 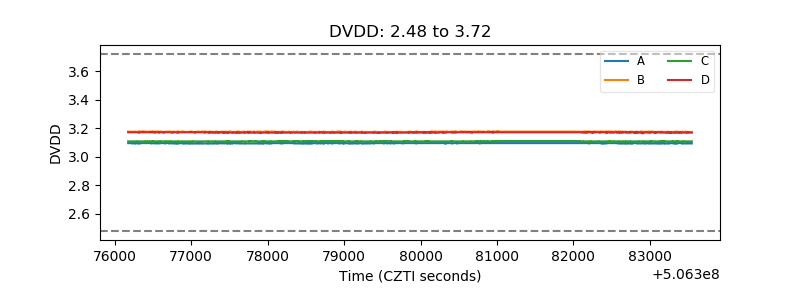 |
| Temperature 1 | 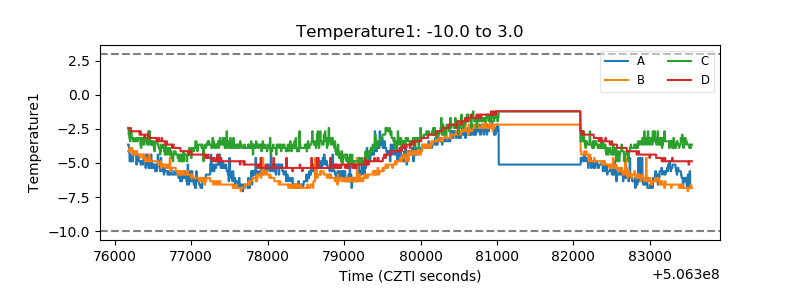 |
| Veto HV Monitor | 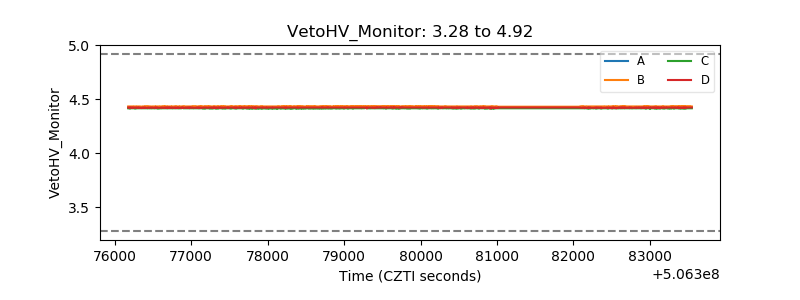 |
| Veto LLD | 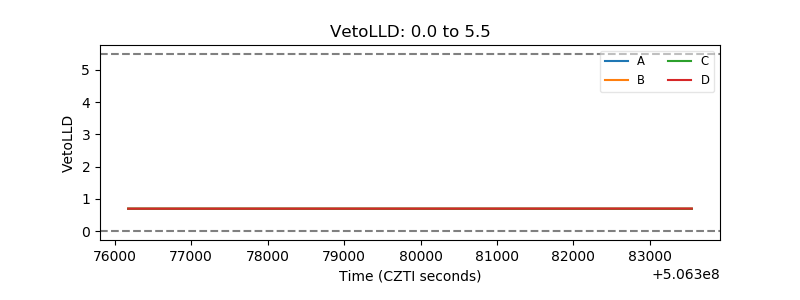 |
| Alpha Counter | 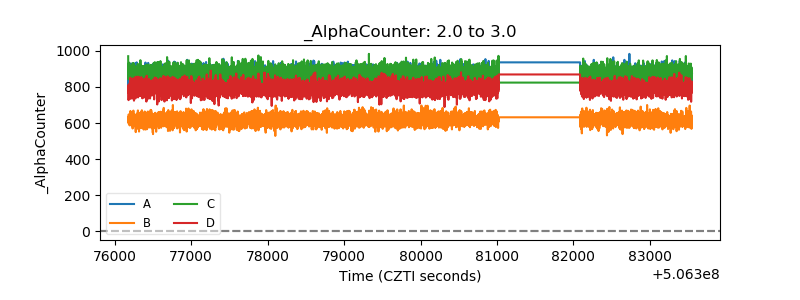 |
| _CPM_Rate | 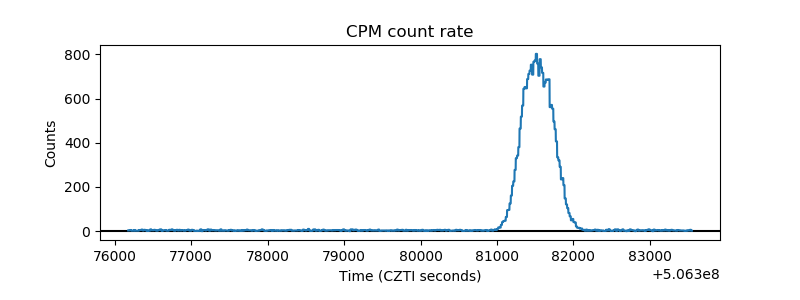 |
| CZT Counter | 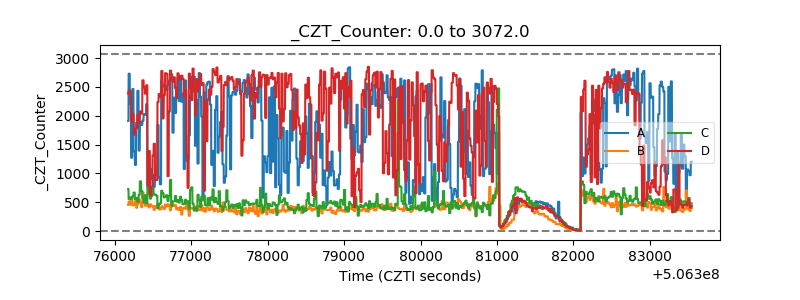 |
| +2.5 Volts monitor | 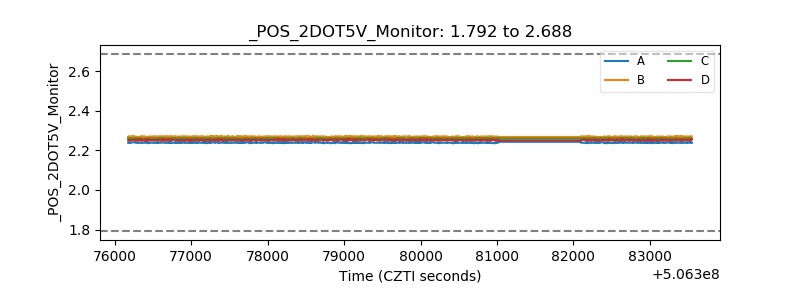 |
| +5 Volts monitor | 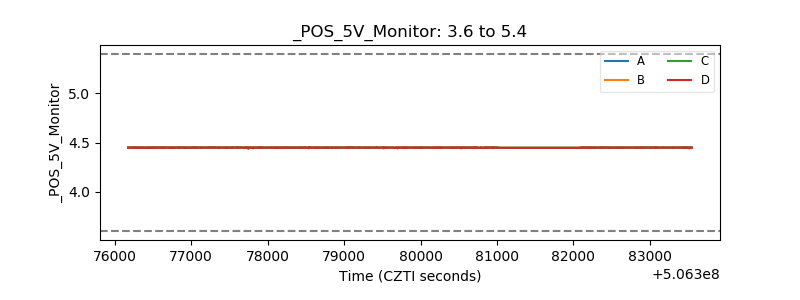 |
| _ROLL_ROT | 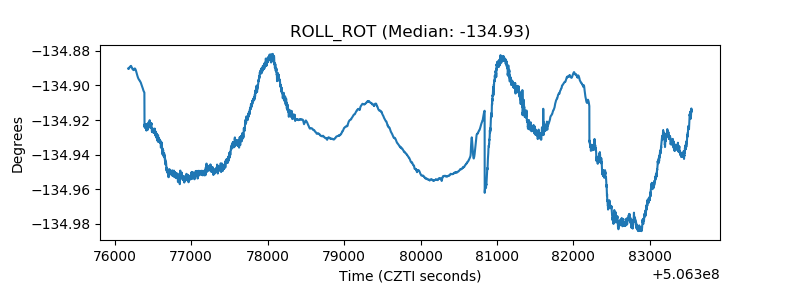 |
| _Roll_DEC | 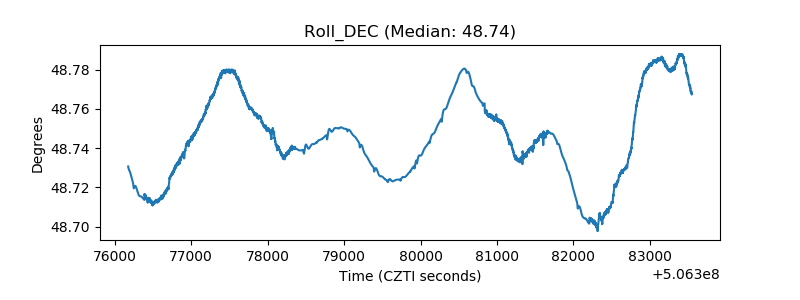 |
| _Roll_RA | 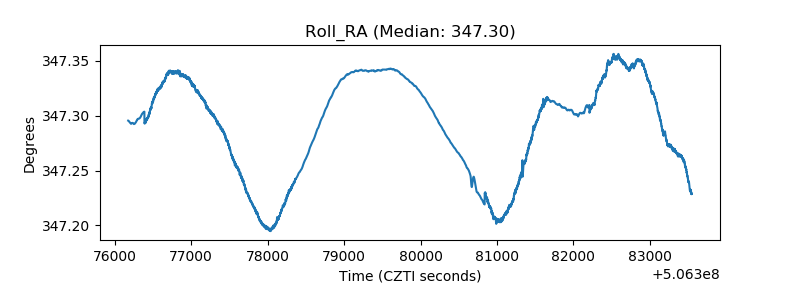 |
| Veto Counter | 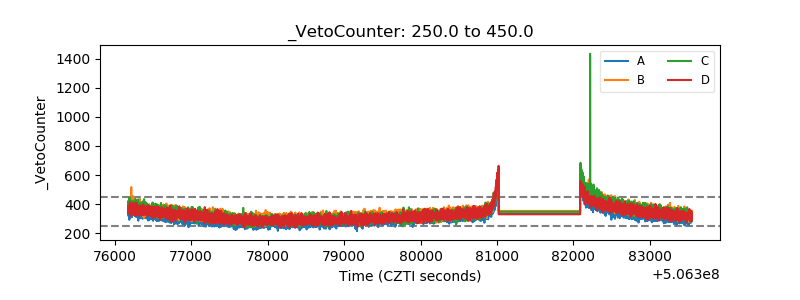 |