| Param | Original file | Final file |
|---|---|---|
| Filename | modeM0/AS1A14_099T04_9000006540_55765cztM0_level2.fits | modeM0/AS1A14_099T04_9000006540_55765cztM0_level2_quad_clean.evt |
| Size (bytes) | 622,131,840 | 90,676,800 |
| Size | 593.3 MB | 86.5 MB |
| Events in quadrant A | 10,505,117 | 406,460 |
| Events in quadrant B | 3,036,709 | 698,221 |
| Events in quadrant C | 3,548,221 | 629,113 |
| Events in quadrant D | 5,431,318 | 555,609 |
| Mode M0 | |||
|---|---|---|---|
| Quadrant | BADHDUFLAG | Total packets | Discarded packets |
| A | 0 | 35754 | 2 |
| B | 0 | 13833 | 2 |
| C | 0 | 14970 | 2 |
| D | 0 | 20664 | 2 |
| Mode M9 | |||
|---|---|---|---|
| Quadrant | BADHDUFLAG | Total packets | Discarded packets |
| A | 0 | 24 | 0 |
| B | 0 | 24 | 0 |
| C | 0 | 24 | 0 |
| D | 0 | 24 | 0 |
| Mode SS | |||
|---|---|---|---|
| Quadrant | BADHDUFLAG | Total packets | Discarded packets |
| A | 0 | 134 | 0 |
| B | 0 | 134 | 0 |
| C | 0 | 134 | 0 |
| D | 0 | 134 | 0 |
| Quadrant | Total seconds | Saturated seconds | Saturation percentage |
|---|---|---|---|
| A | 6544 | 2694 | 41.167482% |
| B | 6545 | 69 | 1.054240% |
| C | 6545 | 89 | 1.359817% |
| D | 6545 | 483 | 7.379679% |
Noise dominated data is calculated using 1-second bins in cleaned event files. If a bin has >2000 counts, and if more than 50% of those come from <1% of pixels, then it is considered to be noise-dominated and hence unusable.
| Quadrant | # 1 sec bins | Bins with >0 counts | Bins with >2000 counts | High rate bins dominated by noise | Noise dominated (total time) | Noise dominated (detector-on time) | Marked lightcurve |
|---|---|---|---|---|---|---|---|
| A | 8914 | 6545 | 2441 | 2441 | 27.38% | 37.30% | 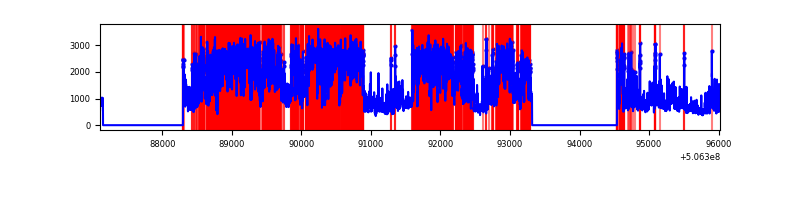 |
| B | 8915 | 6546 | 3 | 3 | 0.03% | 0.05% | 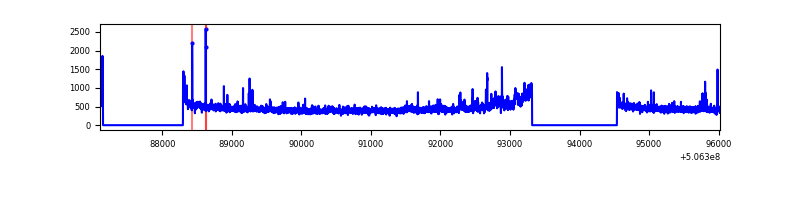 |
| C | 8915 | 6547 | 73 | 73 | 0.82% | 1.12% | 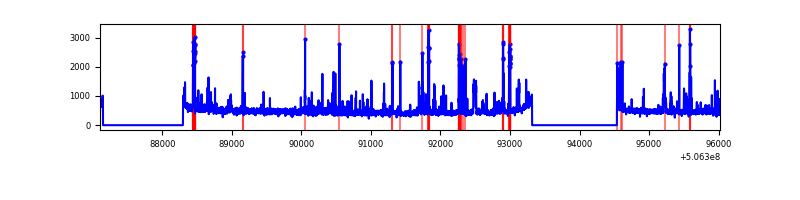 |
| D | 8915 | 6546 | 435 | 435 | 4.88% | 6.65% | 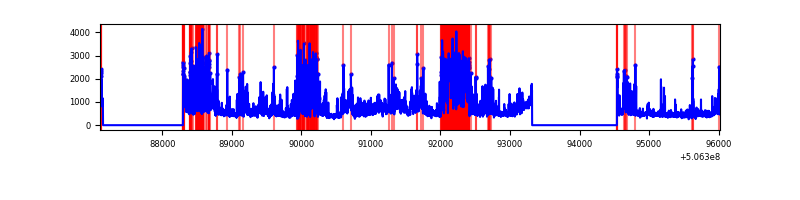 |
Top three noisy pixels from each quadrant. If the there are fewer than three noisy pixels in the level2.evt file, extra rows are filled as -1
| Pixel properties | Quadrant properties | ||||||
|---|---|---|---|---|---|---|---|
| Quadrant | DetID | PixID | Counts | Sigma | Mean | Median | Sigma |
| A | 15 | 32 | 4447358 | 29976.07 | 597 | 582 | 148.3 |
| A | 12 | 115 | 2994811 | 20184.34 | 597 | 582 | 148.3 |
| A | 4 | 249 | 237746 | 1598.74 | 597 | 582 | 148.3 |
| B | 7 | 0 | 95623 | 623.78 | 707 | 679 | 152.2 |
| B | 5 | 172 | 80937 | 527.29 | 707 | 679 | 152.2 |
| B | 10 | 247 | 22823 | 145.49 | 707 | 679 | 152.2 |
| C | 1 | 16 | 250064 | 1303.48 | 698 | 691 | 191.3 |
| C | 12 | 249 | 211723 | 1103.07 | 698 | 691 | 191.3 |
| C | 9 | 38 | 166546 | 866.93 | 698 | 691 | 191.3 |
| D | 11 | 129 | 2128693 | 10969.24 | 675 | 641 | 194.0 |
| D | 7 | 70 | 466798 | 2402.85 | 675 | 641 | 194.0 |
| D | 5 | 173 | 43295 | 219.86 | 675 | 641 | 194.0 |
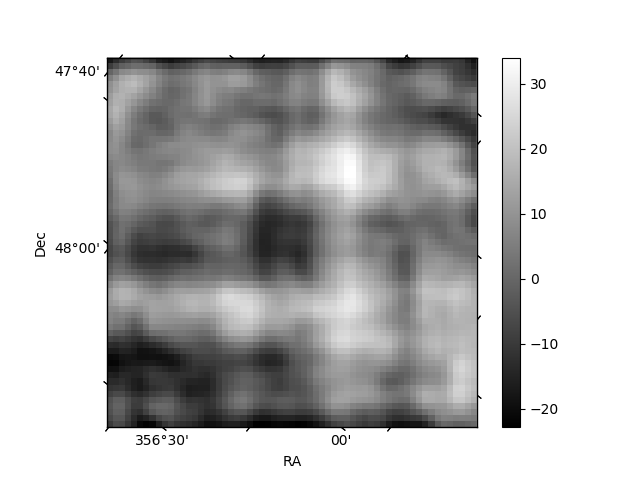
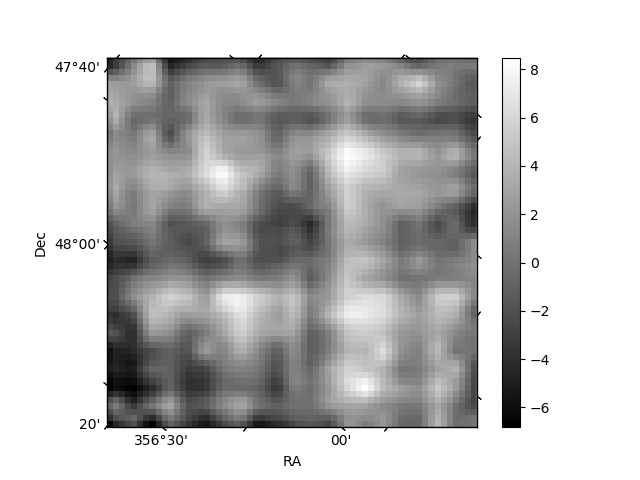
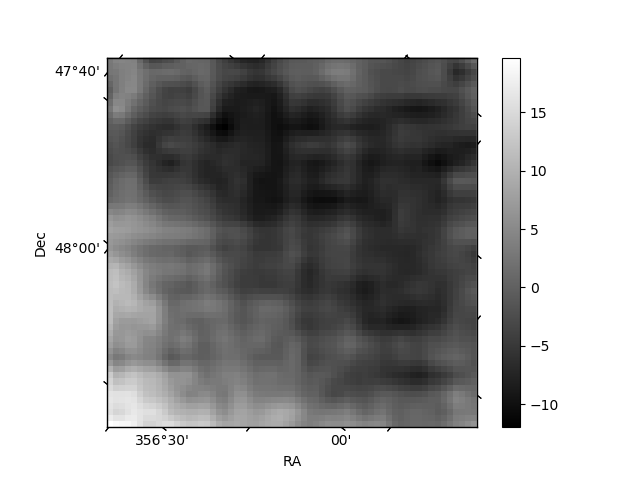
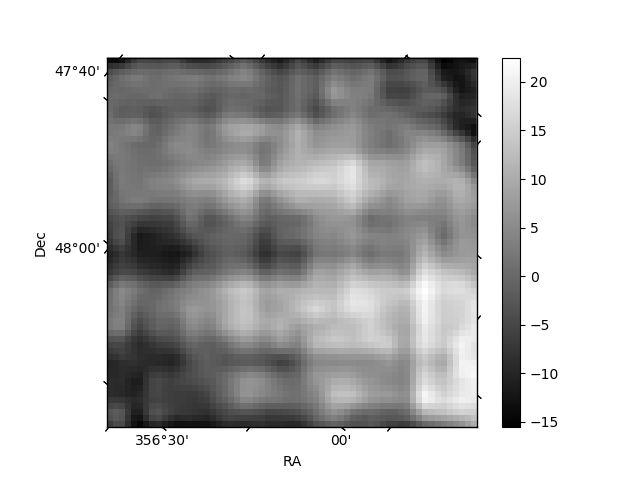
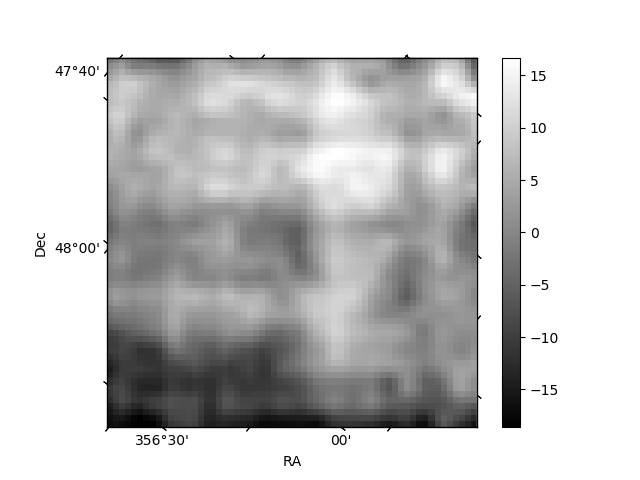
Histogram calculated using DETX and DETY for each event in the final _common_clean file
| Quadrant A | 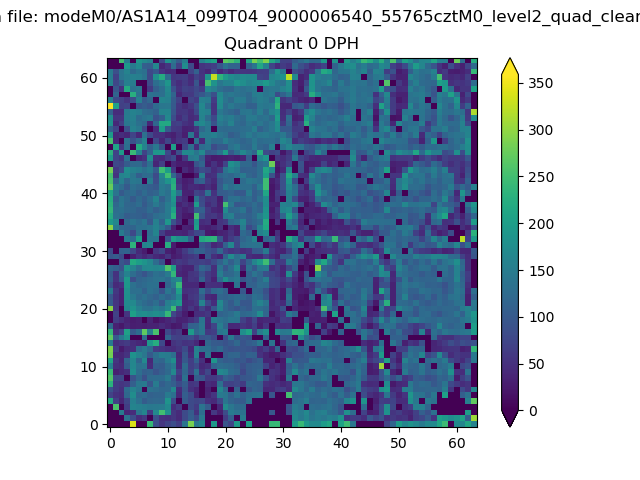 |
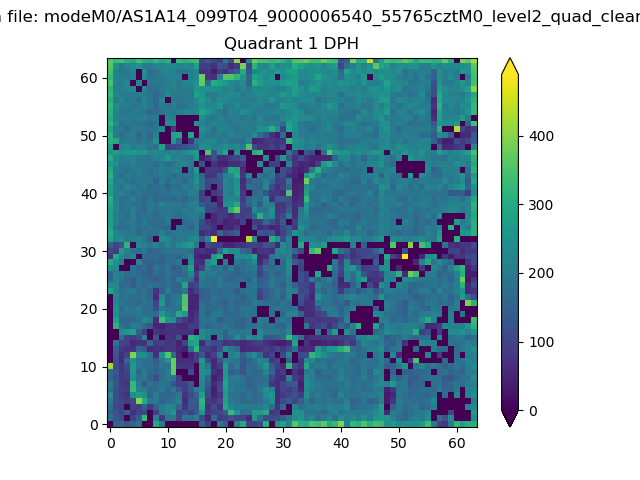 |
Quadrant B |
|---|---|---|---|
| Quadrant D | 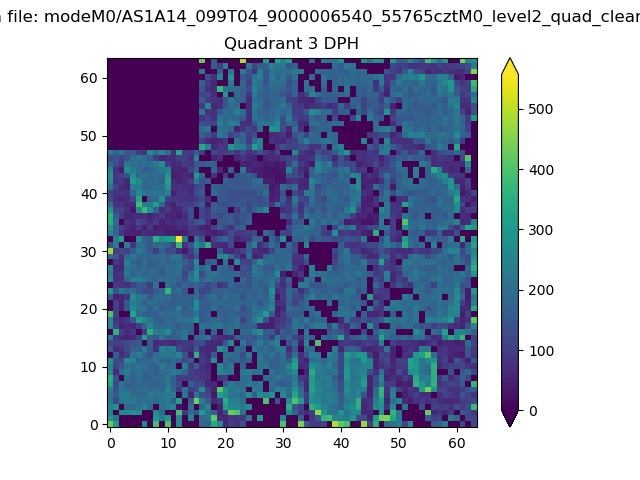 |
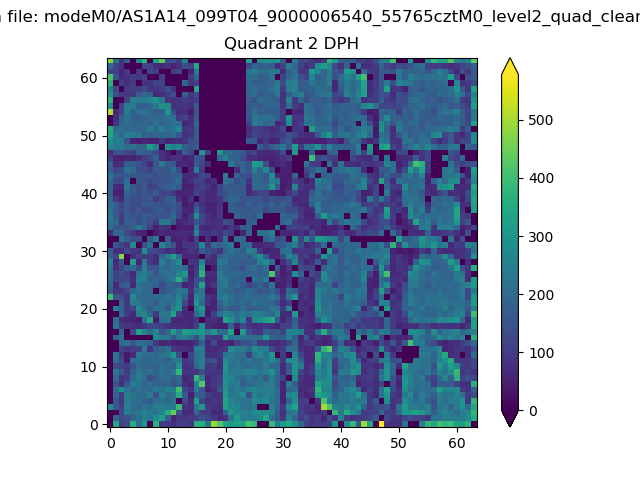 |
Quadrant C |
| Plot type | Count rate plots | Images |
|---|---|---|
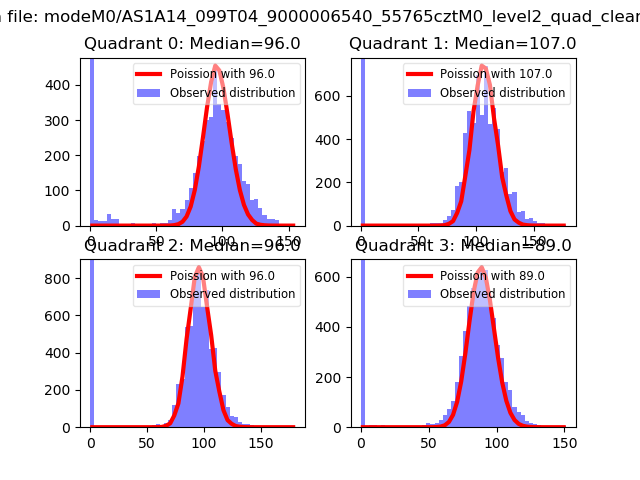
| Comparison with Poisson distribution Blue bars denote a histogram of data divided into 1 sec bins. Red curve is a Poisson curve with rate = median count rate of data. |
 |
 |
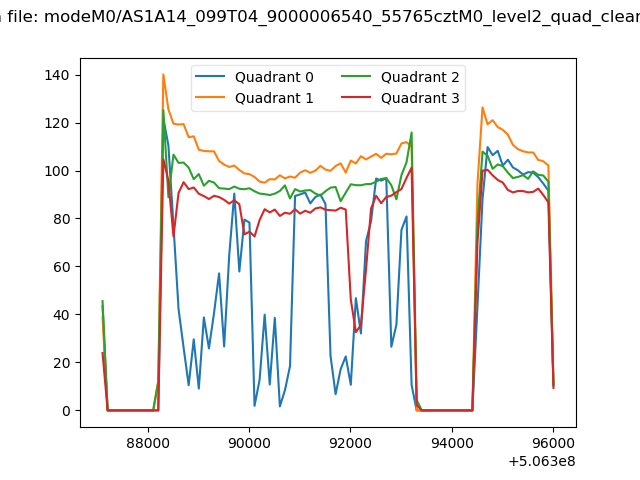
| Quadrant-wise count rates Data is divided into 100 sec bins |
 |
|
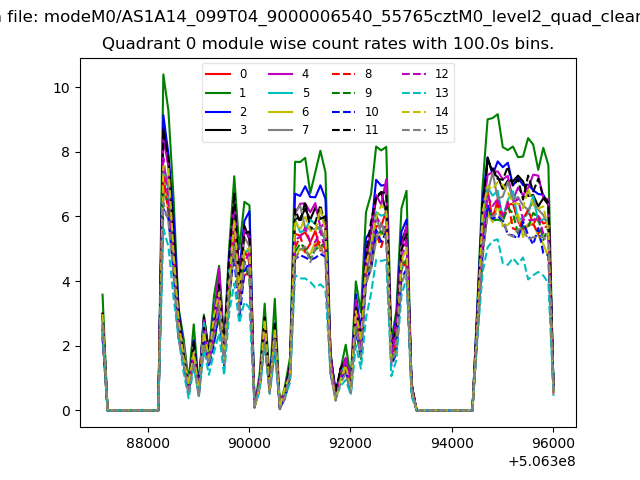
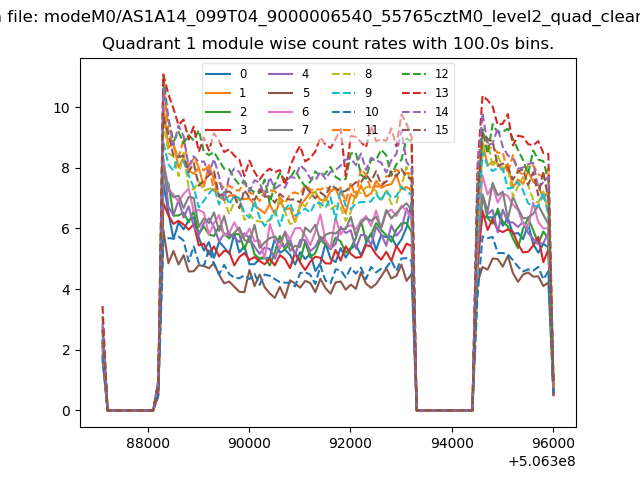
| Module-wise count rates for Quadrant A Data is divided into 100 sec bins |
 |
 |
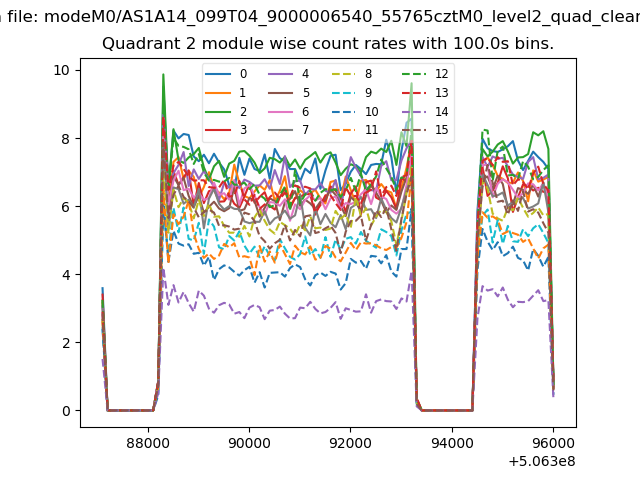
| Module-wise count rates for Quadrant B Data is divided into 100 sec bins |
 |
 |
| Module-wise count rates for Quadrant C Data is divided into 100 sec bins |
 |
 |
| Module-wise count rates for Quadrant D Data is divided into 100 sec bins |
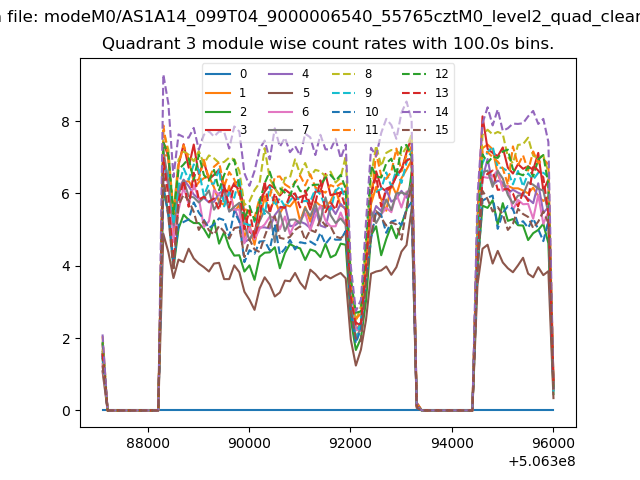 |
 |
| Parameter | Plot |
|---|---|
| CZT HV Monitor | 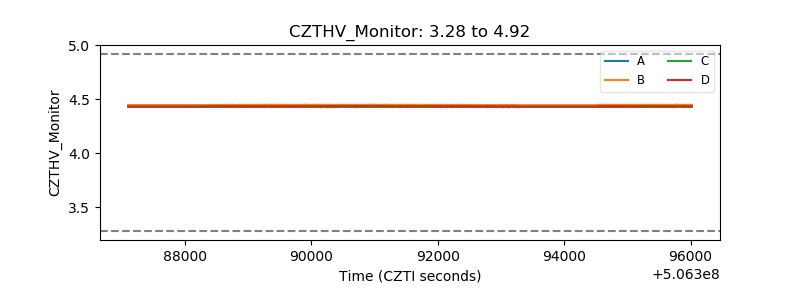 |
| D_VDD | 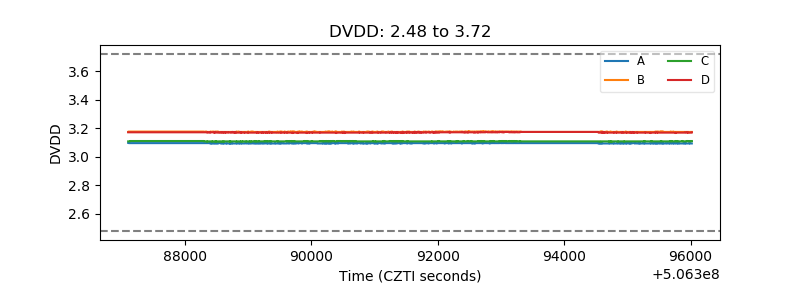 |
| Temperature 1 | 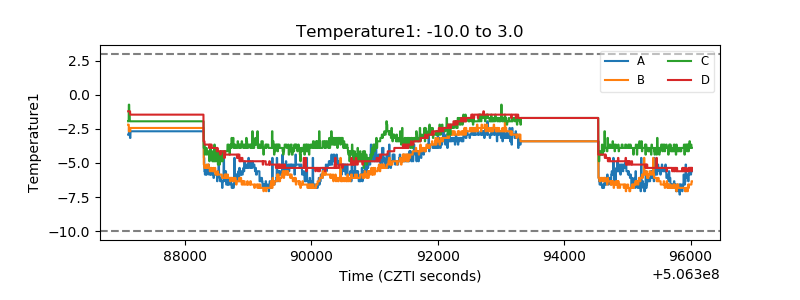 |
| Veto HV Monitor | 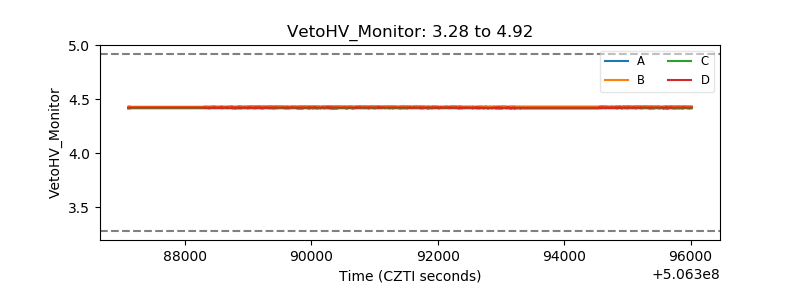 |
| Veto LLD | 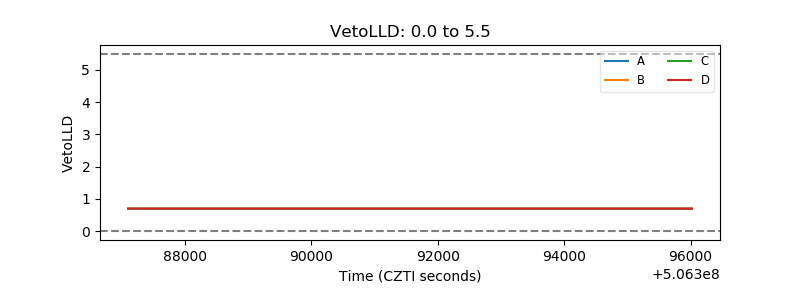 |
| Alpha Counter | 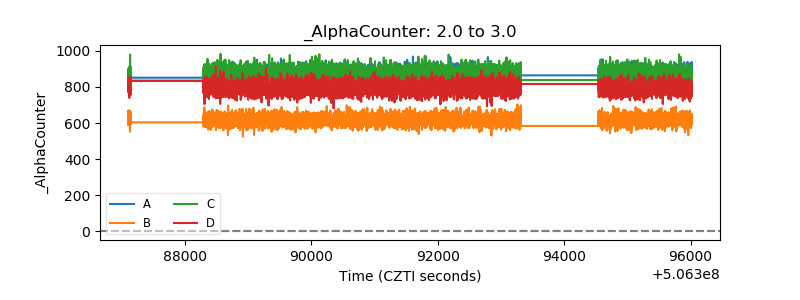 |
| _CPM_Rate | 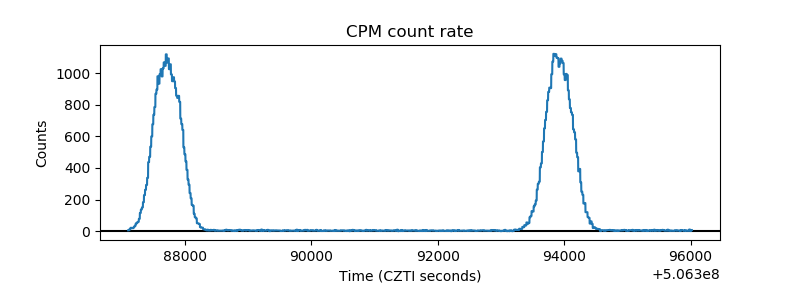 |
| CZT Counter | 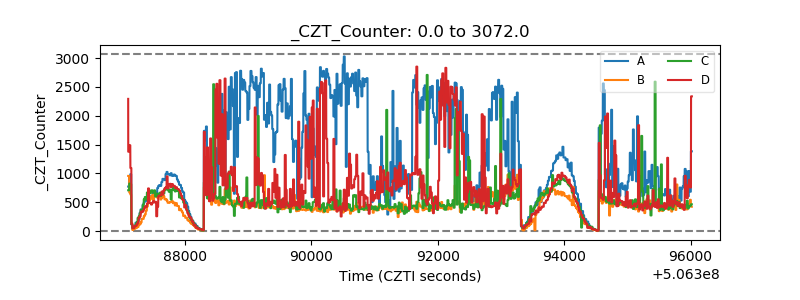 |
| +2.5 Volts monitor |  |
| +5 Volts monitor |  |
| _ROLL_ROT | 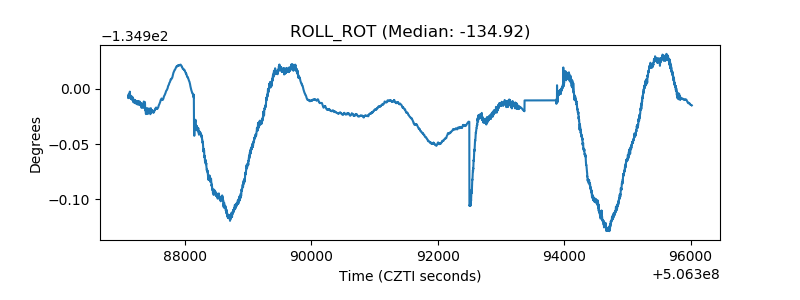 |
| _Roll_DEC | 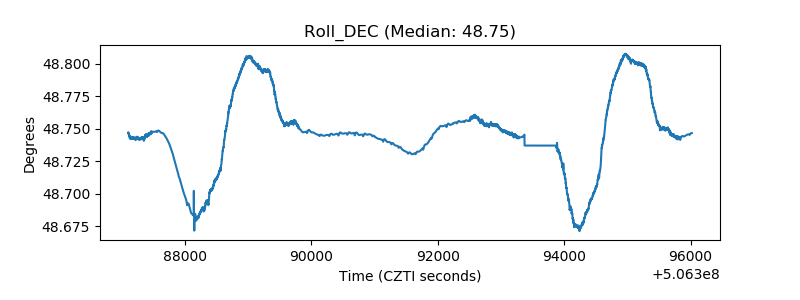 |
| _Roll_RA | 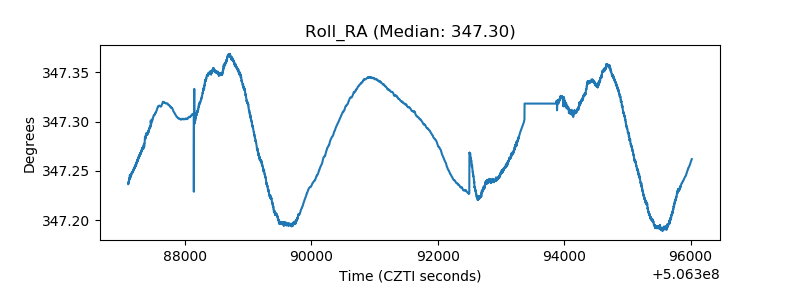 |
| Veto Counter | 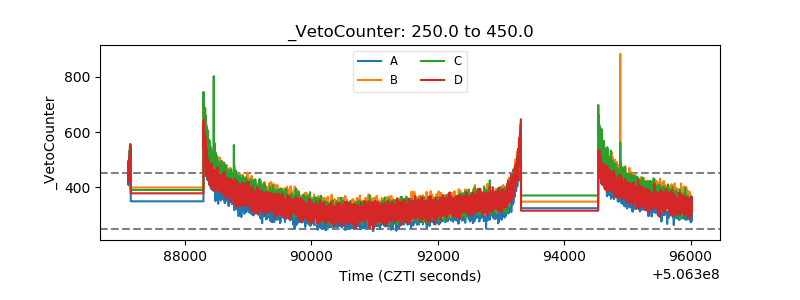 |