| Param | Original file | Final file |
|---|---|---|
| Filename | modeM0/AS1A14_099T04_9000006540_55766cztM0_level2.fits | modeM0/AS1A14_099T04_9000006540_55766cztM0_level2_quad_clean.evt |
| Size (bytes) | 555,572,160 | 94,279,680 |
| Size | 529.8 MB | 89.9 MB |
| Events in quadrant A | 6,829,891 | 565,625 |
| Events in quadrant B | 2,852,383 | 691,982 |
| Events in quadrant C | 5,578,172 | 578,761 |
| Events in quadrant D | 4,803,888 | 567,591 |
| Mode M0 | |||
|---|---|---|---|
| Quadrant | BADHDUFLAG | Total packets | Discarded packets |
| A | 0 | 24734 | 2 |
| B | 0 | 13301 | 2 |
| C | 0 | 20911 | 2 |
| D | 0 | 18812 | 7 |
| Mode M9 | |||
|---|---|---|---|
| Quadrant | BADHDUFLAG | Total packets | Discarded packets |
| A | 0 | 17 | 0 |
| B | 0 | 18 | 0 |
| C | 0 | 18 | 0 |
| D | 0 | 18 | 0 |
| Mode SS | |||
|---|---|---|---|
| Quadrant | BADHDUFLAG | Total packets | Discarded packets |
| A | 0 | 132 | 0 |
| B | 0 | 132 | 0 |
| C | 0 | 132 | 0 |
| D | 0 | 132 | 0 |
| Quadrant | Total seconds | Saturated seconds | Saturation percentage |
|---|---|---|---|
| A | 6460 | 909 | 14.071207% |
| B | 6460 | 26 | 0.402477% |
| C | 6460 | 665 | 10.294118% |
| D | 6459 | 224 | 3.468029% |
Noise dominated data is calculated using 1-second bins in cleaned event files. If a bin has >2000 counts, and if more than 50% of those come from <1% of pixels, then it is considered to be noise-dominated and hence unusable.
| Quadrant | # 1 sec bins | Bins with >0 counts | Bins with >2000 counts | High rate bins dominated by noise | Noise dominated (total time) | Noise dominated (detector-on time) | Marked lightcurve |
|---|---|---|---|---|---|---|---|
| A | 7695 | 6460 | 798 | 798 | 10.37% | 12.35% | 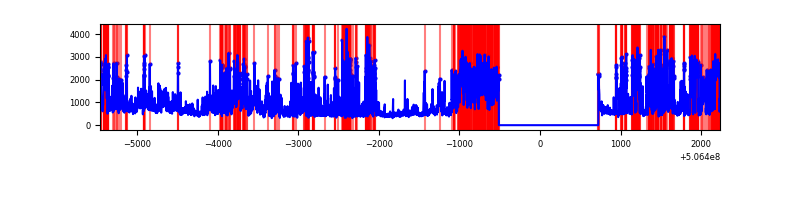 |
| B | 7695 | 6461 | 3 | 3 | 0.04% | 0.05% | 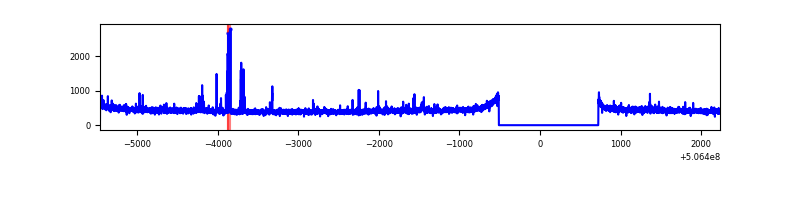 |
| C | 7695 | 6461 | 739 | 739 | 9.60% | 11.44% | 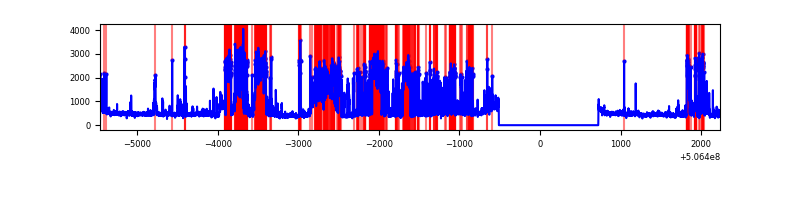 |
| D | 7693 | 6459 | 220 | 220 | 2.86% | 3.41% | 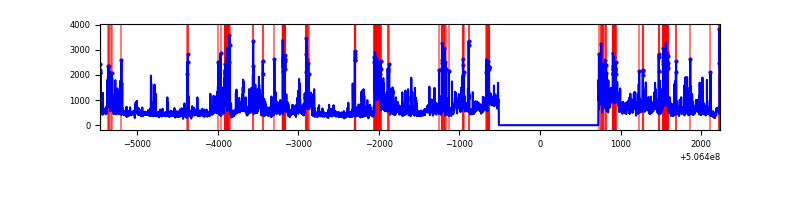 |
Top three noisy pixels from each quadrant. If the there are fewer than three noisy pixels in the level2.evt file, extra rows are filled as -1
| Pixel properties | Quadrant properties | ||||||
|---|---|---|---|---|---|---|---|
| Quadrant | DetID | PixID | Counts | Sigma | Mean | Median | Sigma |
| A | 15 | 32 | 3047626 | 18775.62 | 658 | 642 | 162.3 |
| A | 7 | 64 | 423331 | 2604.62 | 658 | 642 | 162.3 |
| A | 12 | 115 | 246258 | 1513.49 | 658 | 642 | 162.3 |
| B | 2 | 249 | 54973 | 363.46 | 695 | 669 | 149.4 |
| B | 12 | 111 | 18301 | 118.01 | 695 | 669 | 149.4 |
| B | 11 | 111 | 16944 | 108.93 | 695 | 669 | 149.4 |
| C | 12 | 249 | 1477323 | 8104.44 | 665 | 661 | 182.2 |
| C | 9 | 38 | 819693 | 4495.14 | 665 | 661 | 182.2 |
| C | 1 | 16 | 309519 | 1695.12 | 665 | 661 | 182.2 |
| D | 11 | 129 | 1683885 | 8844.61 | 667 | 636 | 190.3 |
| D | 7 | 70 | 293372 | 1538.18 | 667 | 636 | 190.3 |
| D | 7 | 129 | 64632 | 336.26 | 667 | 636 | 190.3 |
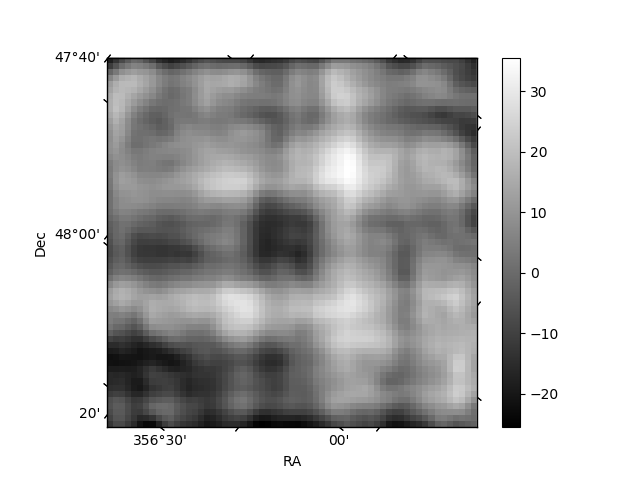
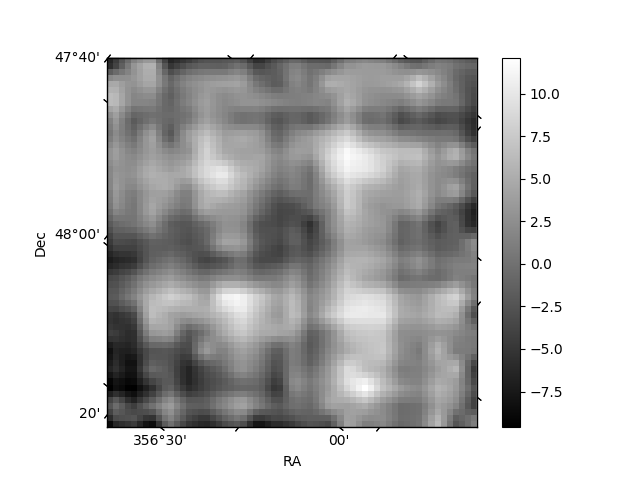
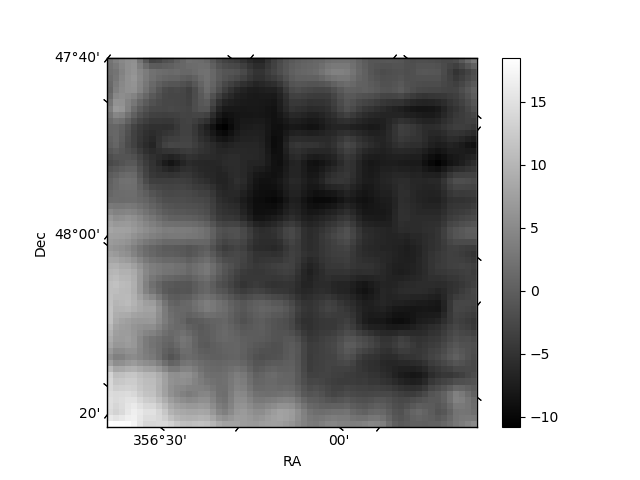
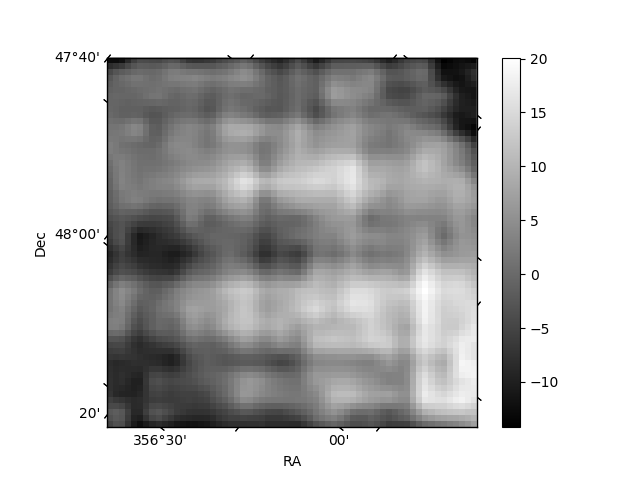
Histogram calculated using DETX and DETY for each event in the final _common_clean file
| Quadrant A | 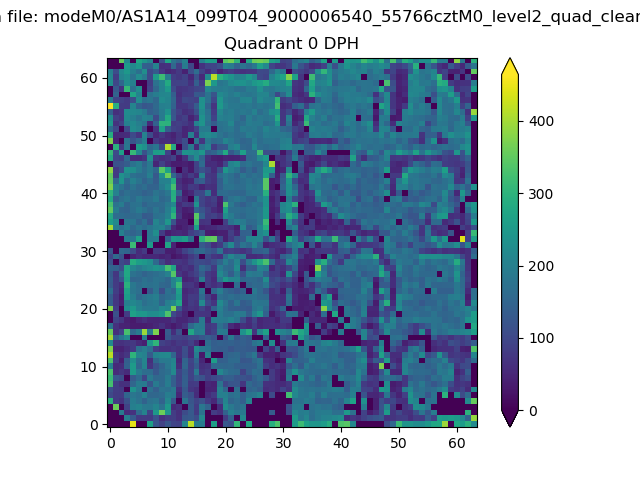 |
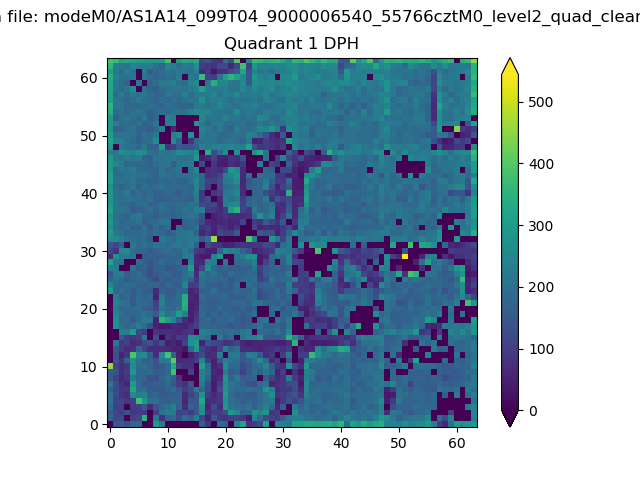 |
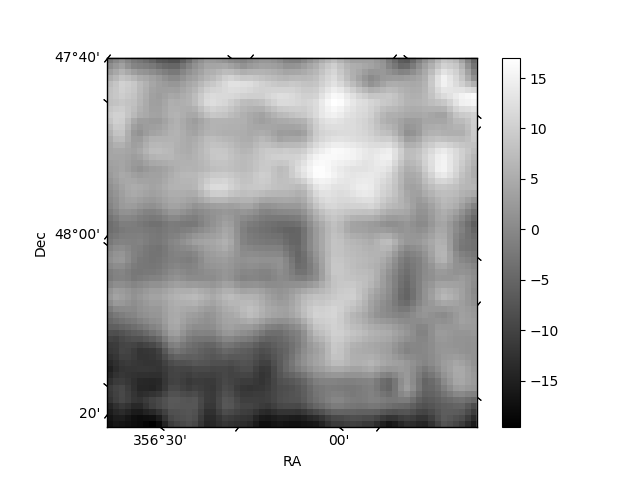
Quadrant B |
|---|---|---|---|
| Quadrant D | 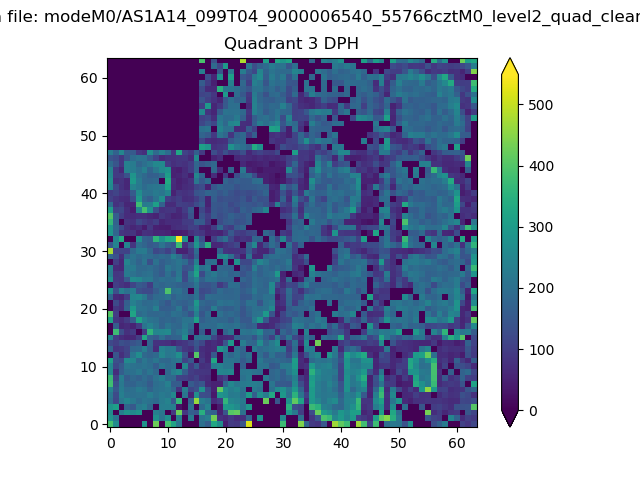 |
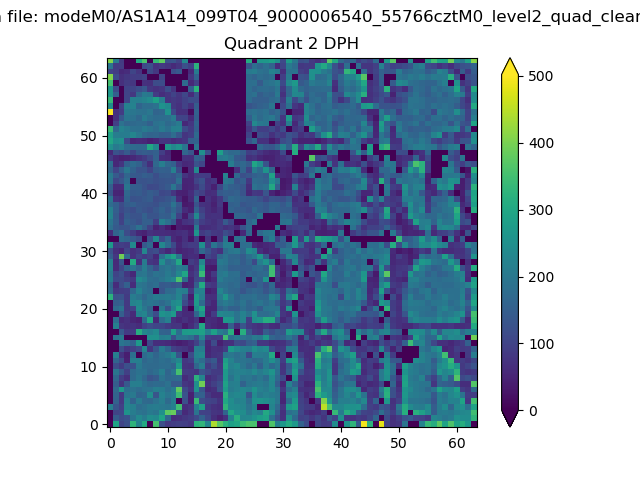 |
Quadrant C |
| Plot type | Count rate plots | Images |
|---|---|---|
| Comparison with Poisson distribution Blue bars denote a histogram of data divided into 1 sec bins. Red curve is a Poisson curve with rate = median count rate of data. |
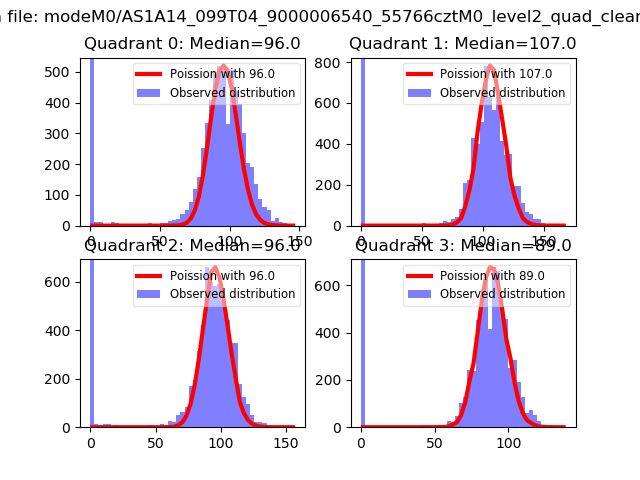 |
 |
| Quadrant-wise count rates Data is divided into 100 sec bins |
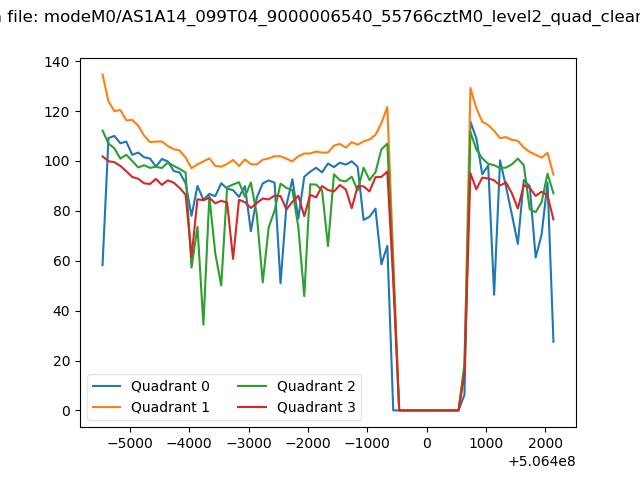 |
|
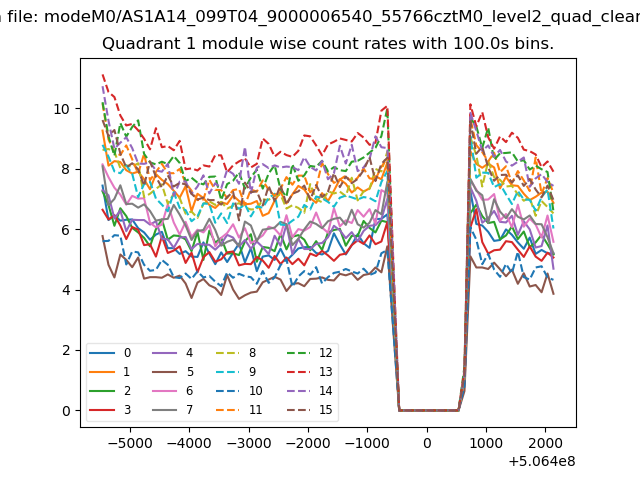
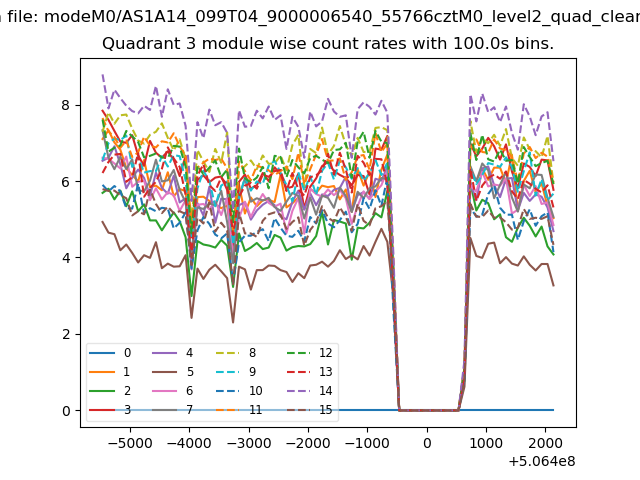
| Module-wise count rates for Quadrant A Data is divided into 100 sec bins |
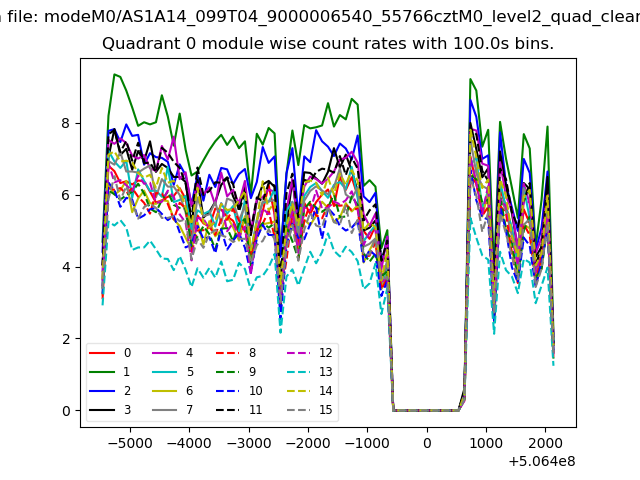 |
 |
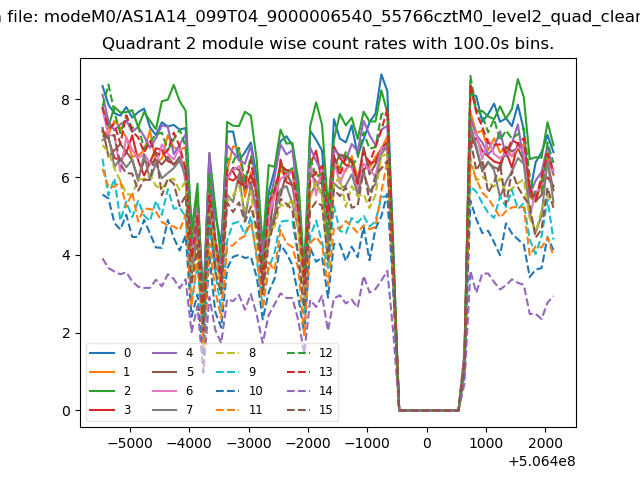
| Module-wise count rates for Quadrant B Data is divided into 100 sec bins |
 |
 |
| Module-wise count rates for Quadrant C Data is divided into 100 sec bins |
 |
 |
| Module-wise count rates for Quadrant D Data is divided into 100 sec bins |
 |
 |
| Parameter | Plot |
|---|---|
| CZT HV Monitor | 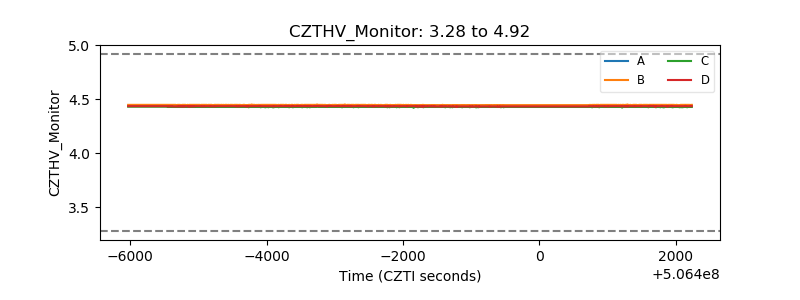 |
| D_VDD | 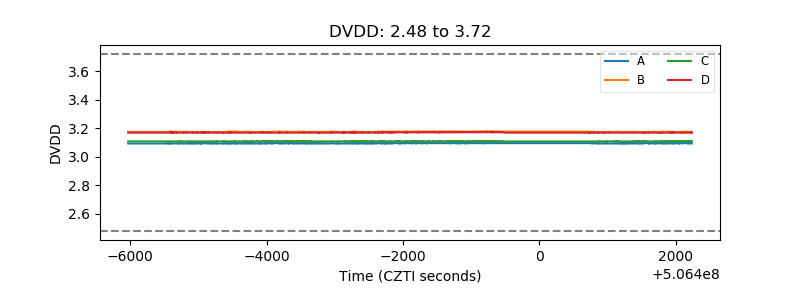 |
| Temperature 1 | 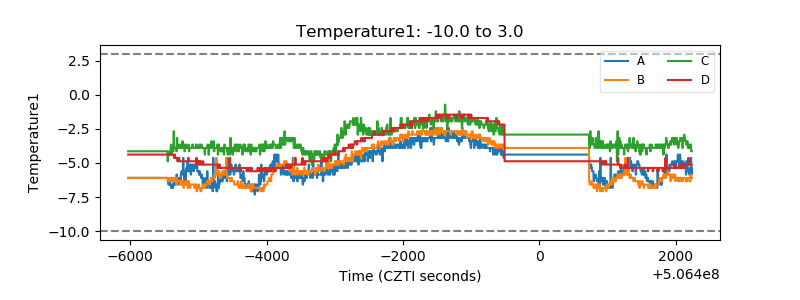 |
| Veto HV Monitor | 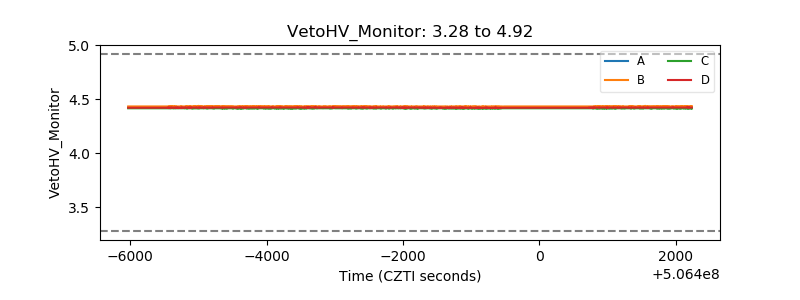 |
| Veto LLD | 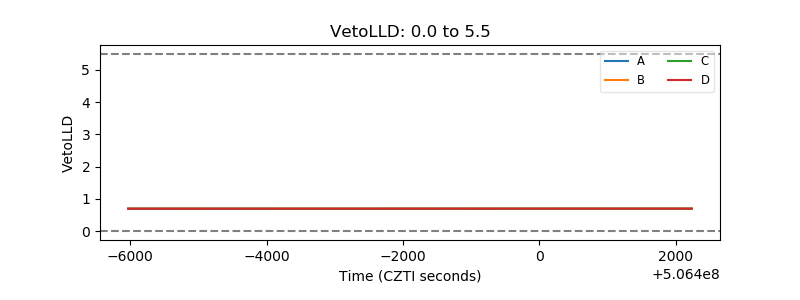 |
| Alpha Counter | 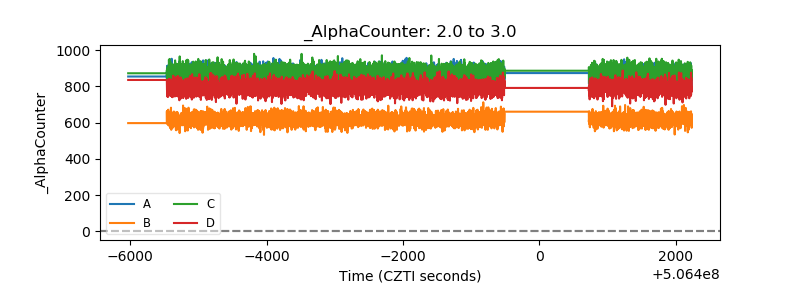 |
| _CPM_Rate | 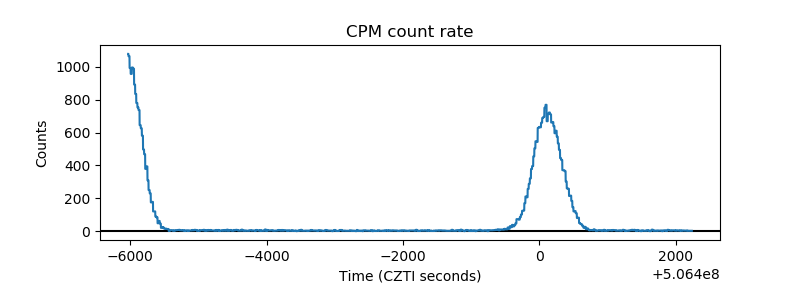 |
| CZT Counter | 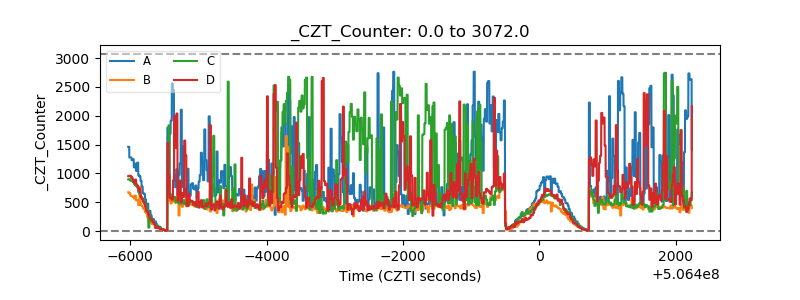 |
| +2.5 Volts monitor | 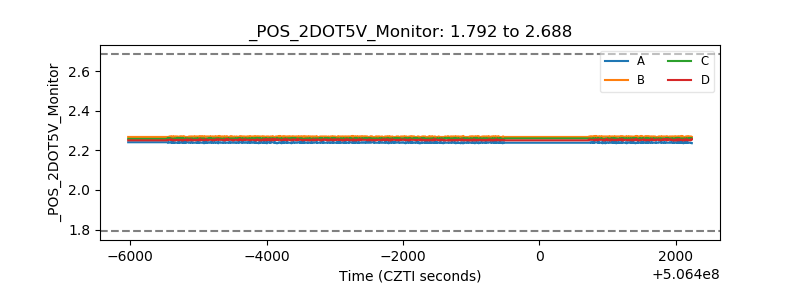 |
| +5 Volts monitor | 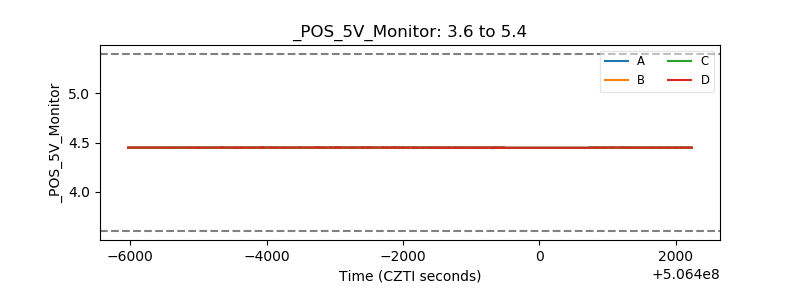 |
| _ROLL_ROT | 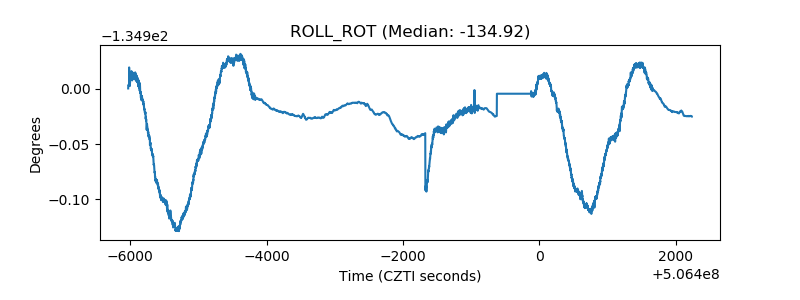 |
| _Roll_DEC | 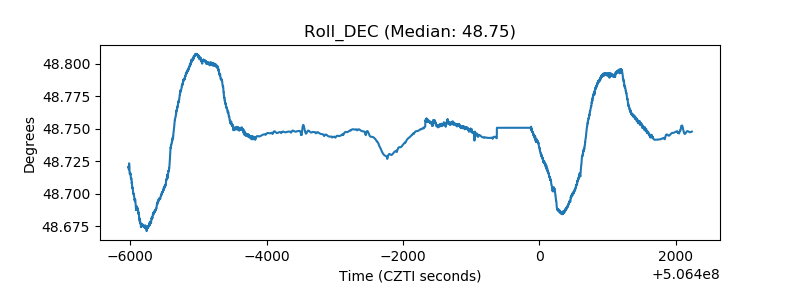 |
| _Roll_RA | 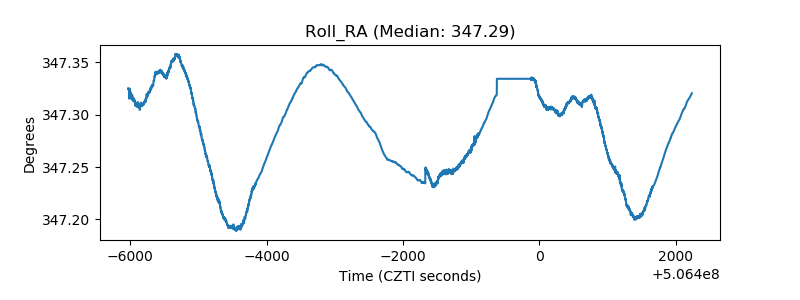 |
| Veto Counter | 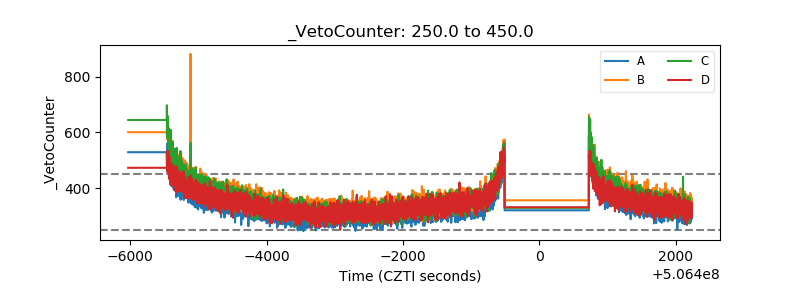 |