| Param | Original file | Final file |
|---|---|---|
| Filename | modeM0/AS1A14_099T04_9000006540_55767cztM0_level2.fits | modeM0/AS1A14_099T04_9000006540_55767cztM0_level2_quad_clean.evt |
| Size (bytes) | 714,991,680 | 85,026,240 |
| Size | 681.9 MB | 81.1 MB |
| Events in quadrant A | 11,961,461 | 330,956 |
| Events in quadrant B | 3,088,232 | 681,595 |
| Events in quadrant C | 3,356,271 | 618,998 |
| Events in quadrant D | 7,548,201 | 482,893 |
| Mode M0 | |||
|---|---|---|---|
| Quadrant | BADHDUFLAG | Total packets | Discarded packets |
| A | 0 | 40094 | 2 |
| B | 0 | 14127 | 2 |
| C | 0 | 14975 | 2 |
| D | 0 | 26998 | 4 |
| Mode M9 | |||
|---|---|---|---|
| Quadrant | BADHDUFLAG | Total packets | Discarded packets |
| A | 0 | 18 | 0 |
| B | 0 | 19 | 0 |
| C | 0 | 19 | 0 |
| D | 0 | 19 | 0 |
| Mode SS | |||
|---|---|---|---|
| Quadrant | BADHDUFLAG | Total packets | Discarded packets |
| A | 0 | 132 | 0 |
| B | 0 | 132 | 0 |
| C | 0 | 132 | 0 |
| D | 0 | 132 | 0 |
| Quadrant | Total seconds | Saturated seconds | Saturation percentage |
|---|---|---|---|
| A | 6604 | 3542 | 53.634161% |
| B | 6604 | 145 | 2.195639% |
| C | 6604 | 165 | 2.498486% |
| D | 6603 | 1352 | 20.475541% |
Noise dominated data is calculated using 1-second bins in cleaned event files. If a bin has >2000 counts, and if more than 50% of those come from <1% of pixels, then it is considered to be noise-dominated and hence unusable.
| Quadrant | # 1 sec bins | Bins with >0 counts | Bins with >2000 counts | High rate bins dominated by noise | Noise dominated (total time) | Noise dominated (detector-on time) | Marked lightcurve |
|---|---|---|---|---|---|---|---|
| A | 7645 | 6604 | 3296 | 3296 | 43.11% | 49.91% | 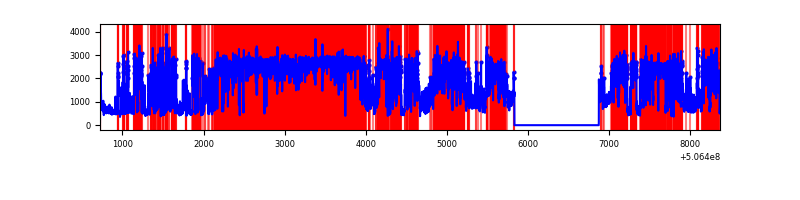 |
| B | 7645 | 6604 | 4 | 4 | 0.05% | 0.06% | 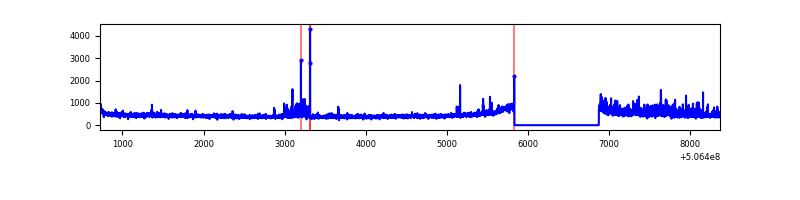 |
| C | 7645 | 6604 | 111 | 111 | 1.45% | 1.68% | 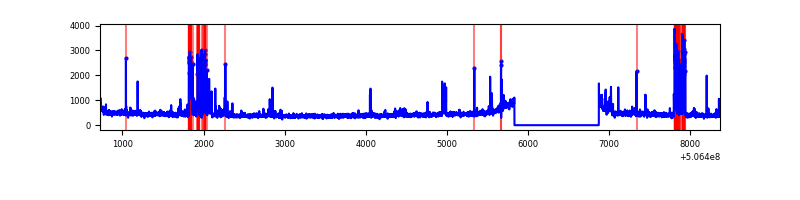 |
| D | 7644 | 6604 | 1373 | 1373 | 17.96% | 20.79% | 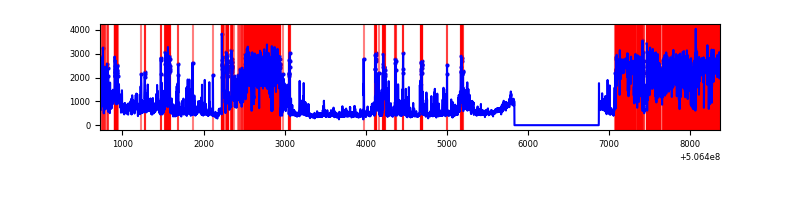 |
Top three noisy pixels from each quadrant. If the there are fewer than three noisy pixels in the level2.evt file, extra rows are filled as -1
| Pixel properties | Quadrant properties | ||||||
|---|---|---|---|---|---|---|---|
| Quadrant | DetID | PixID | Counts | Sigma | Mean | Median | Sigma |
| A | 15 | 32 | 9034243 | 65305.95 | 562 | 547 | 138.3 |
| A | 7 | 64 | 222575 | 1605.07 | 562 | 547 | 138.3 |
| A | 8 | 192 | 162529 | 1170.99 | 562 | 547 | 138.3 |
| B | 5 | 172 | 110045 | 711.92 | 709 | 682 | 153.6 |
| B | 0 | 199 | 104211 | 673.94 | 709 | 682 | 153.6 |
| B | 4 | 206 | 22865 | 144.4 | 709 | 682 | 153.6 |
| C | 10 | 22 | 392417 | 2041.6 | 698 | 690 | 191.9 |
| C | 1 | 16 | 101463 | 525.21 | 698 | 690 | 191.9 |
| C | 9 | 38 | 34965 | 178.63 | 698 | 690 | 191.9 |
| D | 7 | 70 | 3529136 | 19222.05 | 650 | 619 | 183.6 |
| D | 11 | 129 | 1259301 | 6856.83 | 650 | 619 | 183.6 |
| D | 8 | 160 | 65968 | 356.0 | 650 | 619 | 183.6 |
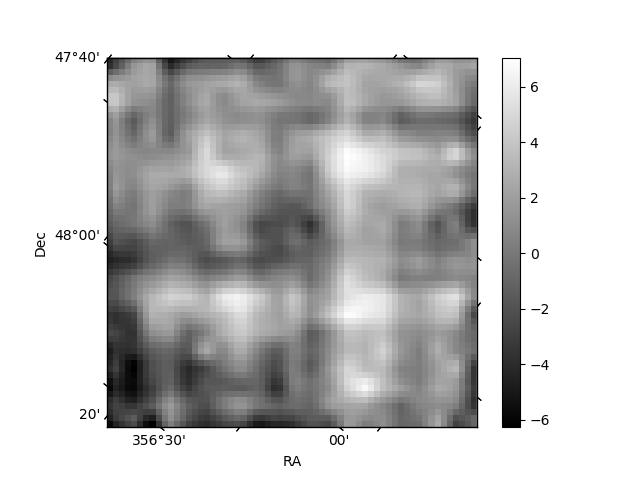
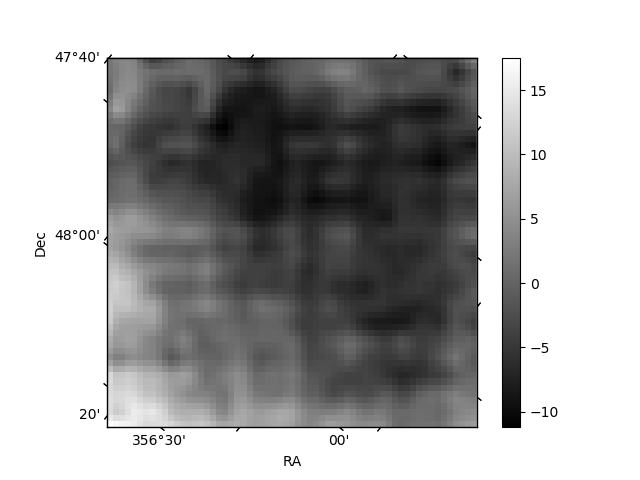
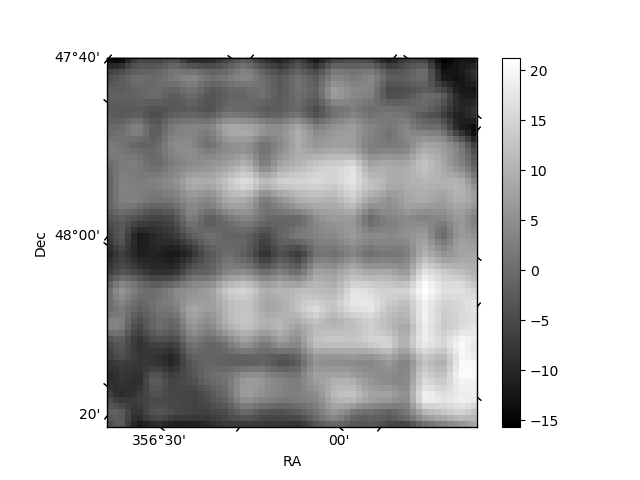
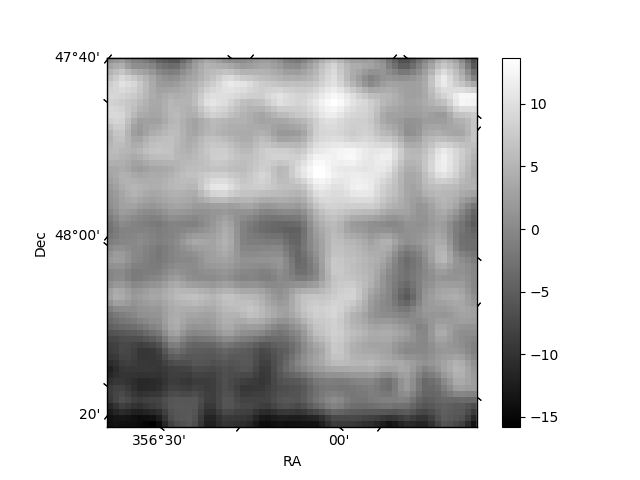
Histogram calculated using DETX and DETY for each event in the final _common_clean file
| Quadrant A | 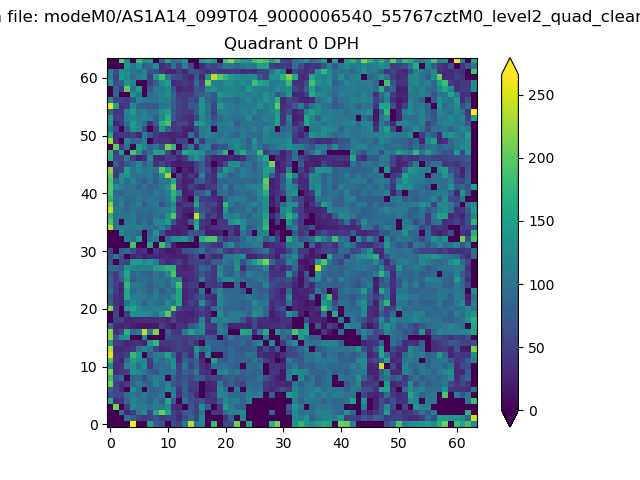 |
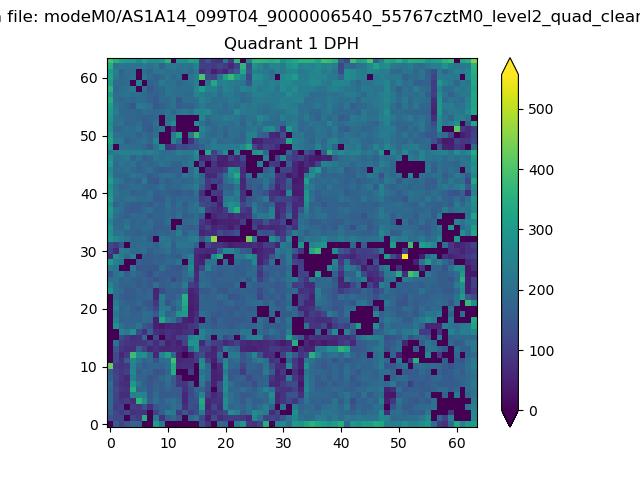 |
Quadrant B |
|---|---|---|---|
| Quadrant D | 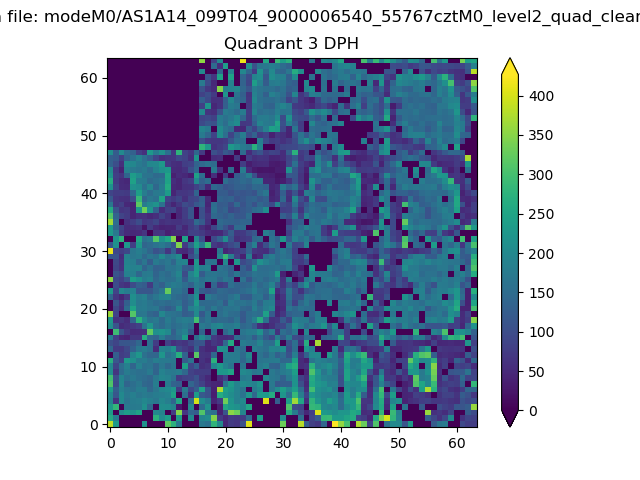 |
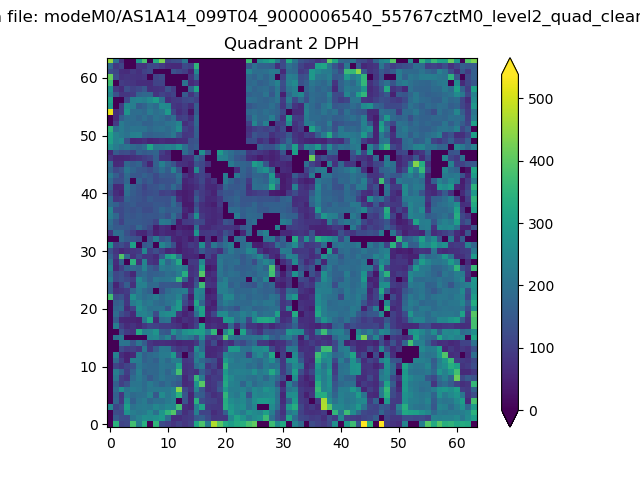 |
Quadrant C |
| Plot type | Count rate plots | Images |
|---|---|---|
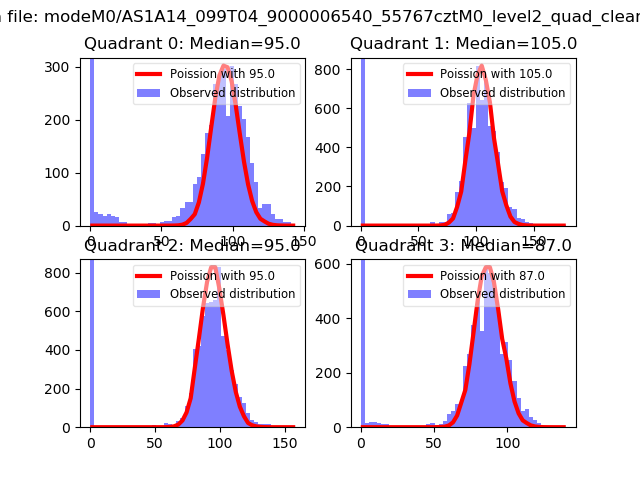
| Comparison with Poisson distribution Blue bars denote a histogram of data divided into 1 sec bins. Red curve is a Poisson curve with rate = median count rate of data. |
 |
 |
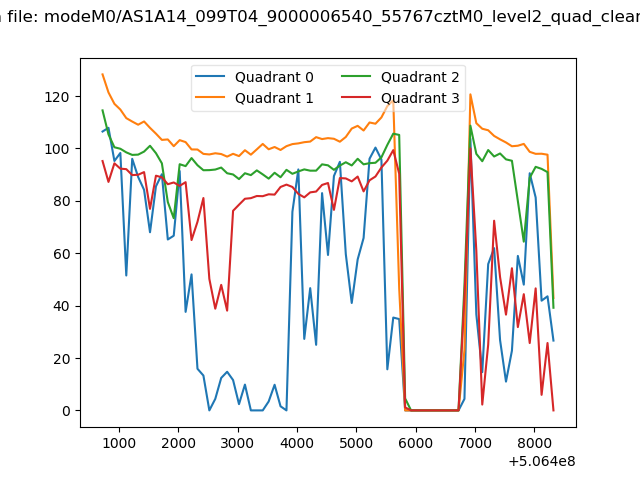
| Quadrant-wise count rates Data is divided into 100 sec bins |
 |
|
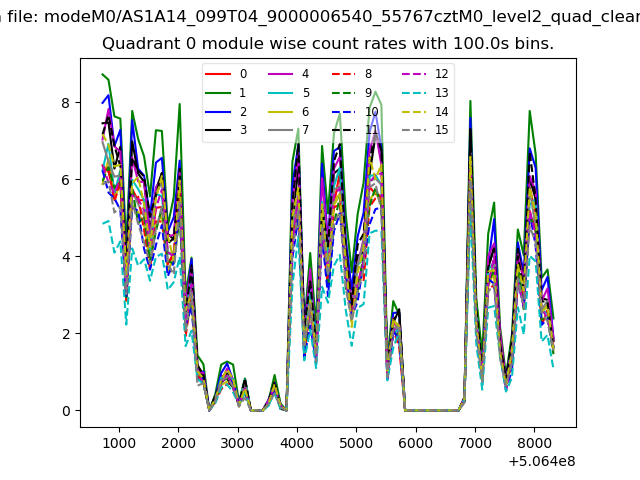
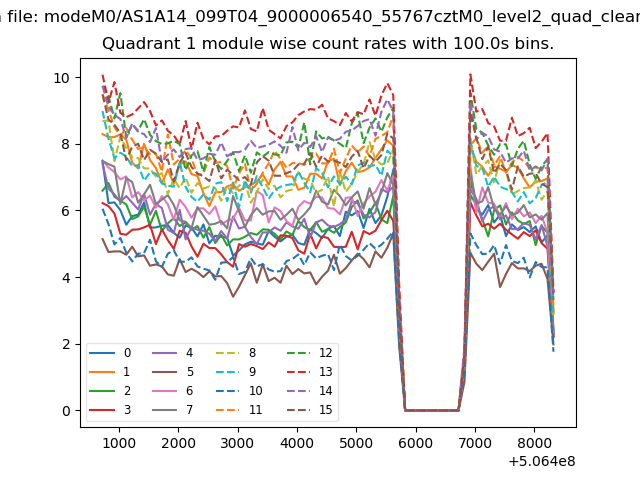
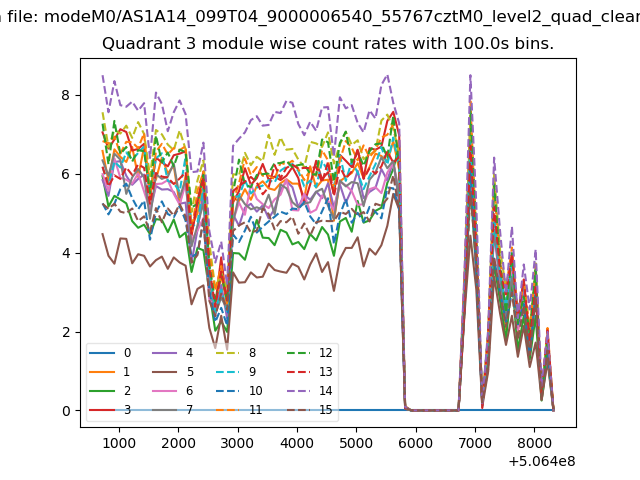
| Module-wise count rates for Quadrant A Data is divided into 100 sec bins |
 |
 |
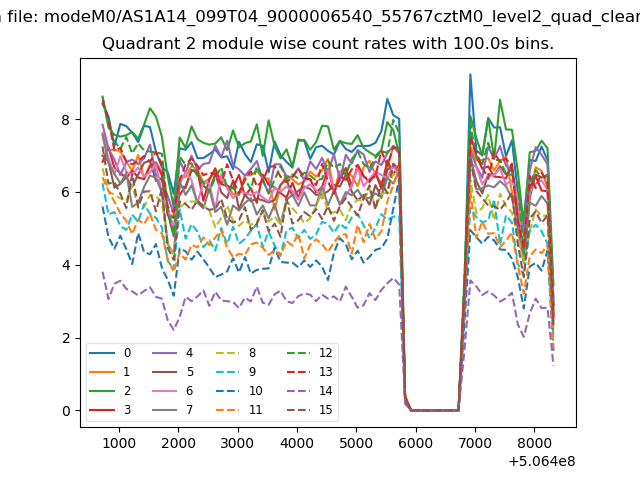
| Module-wise count rates for Quadrant B Data is divided into 100 sec bins |
 |
 |
| Module-wise count rates for Quadrant C Data is divided into 100 sec bins |
 |
 |
| Module-wise count rates for Quadrant D Data is divided into 100 sec bins |
 |
 |
| Parameter | Plot |
|---|---|
| CZT HV Monitor | 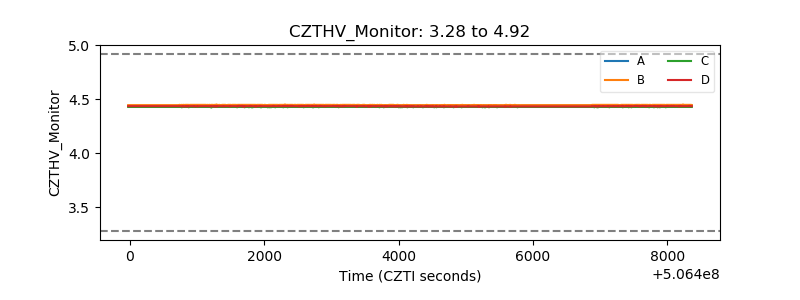 |
| D_VDD | 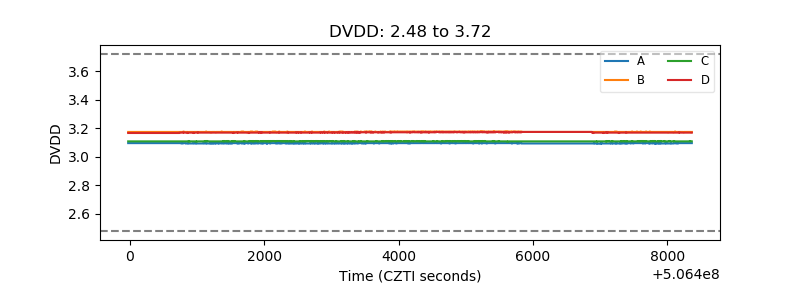 |
| Temperature 1 | 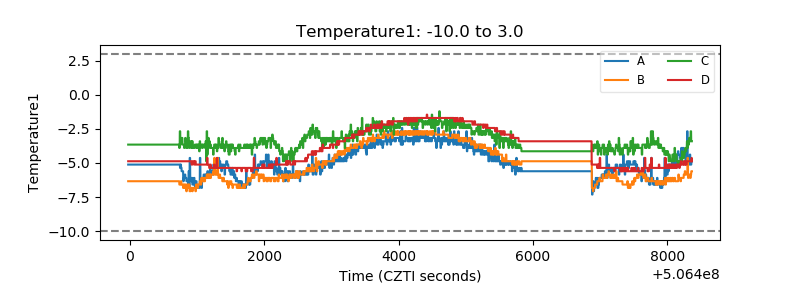 |
| Veto HV Monitor | 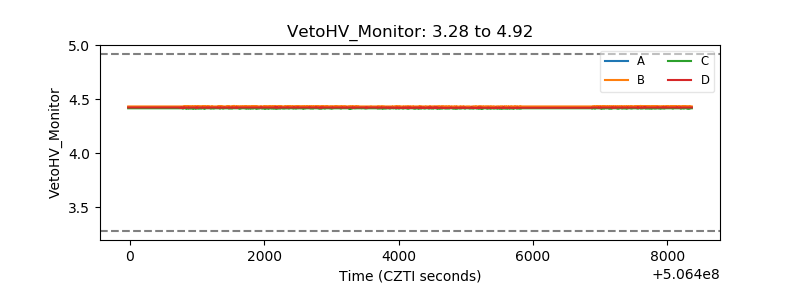 |
| Veto LLD | 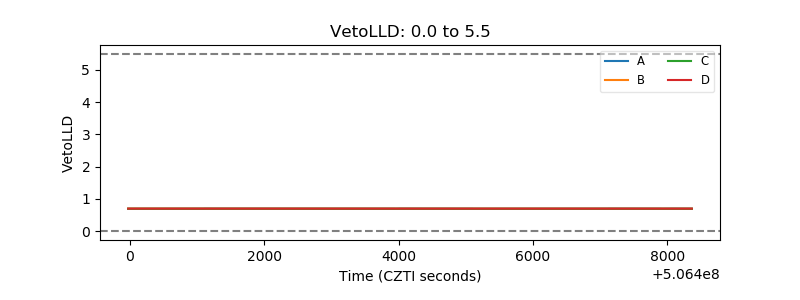 |
| Alpha Counter | 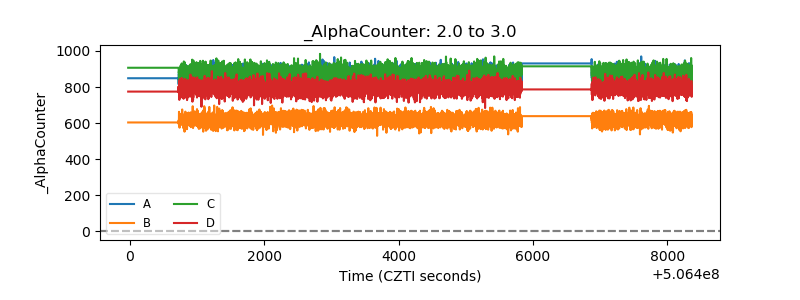 |
| _CPM_Rate | 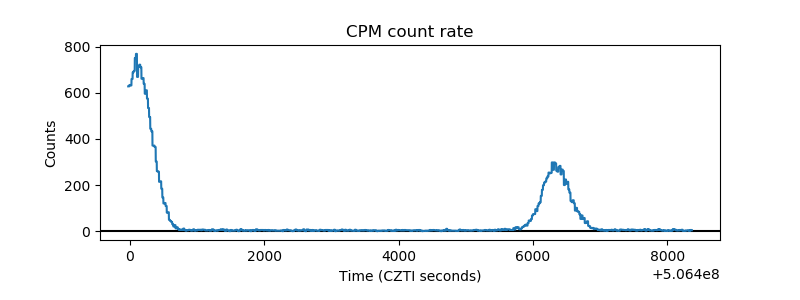 |
| CZT Counter | 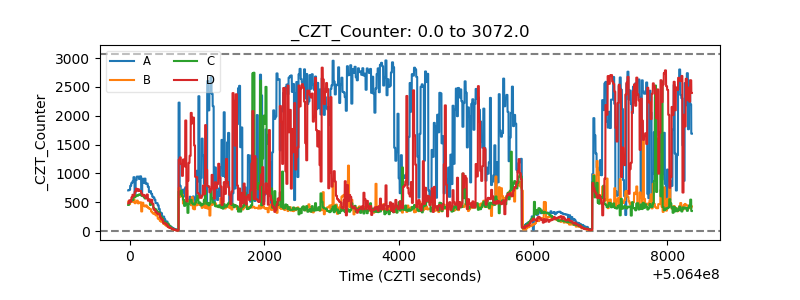 |
| +2.5 Volts monitor |  |
| +5 Volts monitor |  |
| _ROLL_ROT | 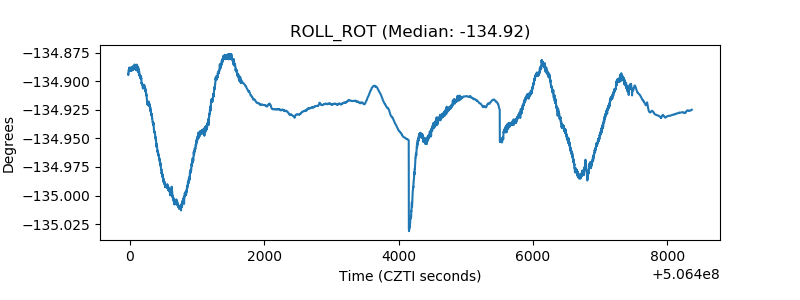 |
| _Roll_DEC | 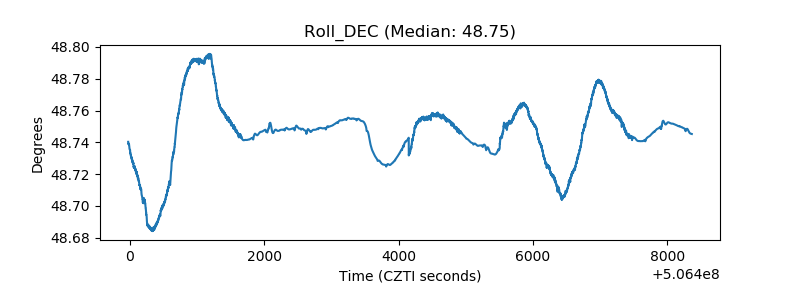 |
| _Roll_RA | 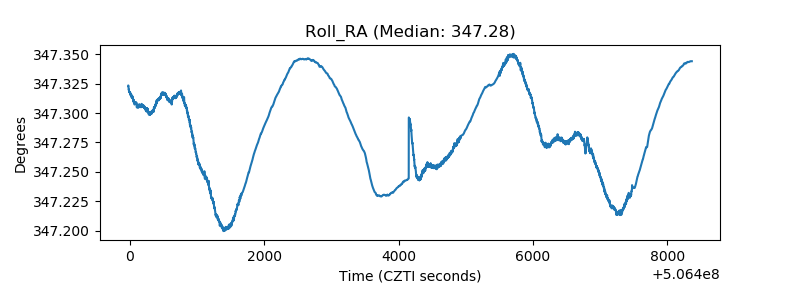 |
| Veto Counter | 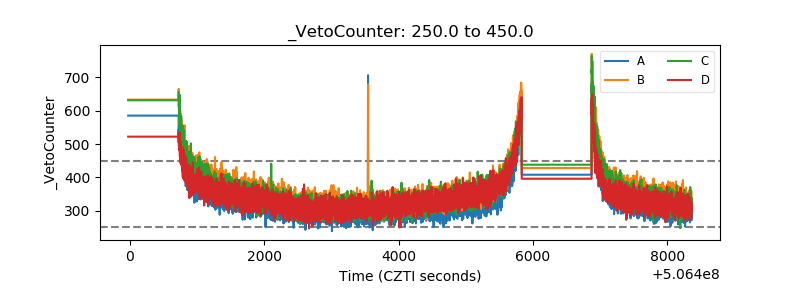 |