| Param | Original file | Final file |
|---|---|---|
| Filename | modeM0/AS1A14_099T04_9000006540_55768cztM0_level2.fits | modeM0/AS1A14_099T04_9000006540_55768cztM0_level2_quad_clean.evt |
| Size (bytes) | 693,377,280 | 83,252,160 |
| Size | 661.3 MB | 79.4 MB |
| Events in quadrant A | 9,867,309 | 411,026 |
| Events in quadrant B | 3,228,407 | 647,808 |
| Events in quadrant C | 2,963,392 | 595,865 |
| Events in quadrant D | 9,101,006 | 410,269 |
| Mode M0 | |||
|---|---|---|---|
| Quadrant | BADHDUFLAG | Total packets | Discarded packets |
| A | 0 | 33876 | 1 |
| B | 0 | 14231 | 1 |
| C | 0 | 14050 | 1 |
| D | 0 | 31529 | 1 |
| Mode M9 | |||
|---|---|---|---|
| Quadrant | BADHDUFLAG | Total packets | Discarded packets |
| A | 0 | 7 | 0 |
| B | 0 | 7 | 0 |
| C | 0 | 7 | 0 |
| D | 0 | 7 | 0 |
| Mode SS | |||
|---|---|---|---|
| Quadrant | BADHDUFLAG | Total packets | Discarded packets |
| A | 0 | 134 | 0 |
| B | 0 | 134 | 0 |
| C | 0 | 134 | 0 |
| D | 0 | 134 | 0 |
| Quadrant | Total seconds | Saturated seconds | Saturation percentage |
|---|---|---|---|
| A | 6528 | 2366 | 36.243873% |
| B | 6528 | 166 | 2.542892% |
| C | 6529 | 128 | 1.960484% |
| D | 6529 | 2027 | 31.046102% |
Noise dominated data is calculated using 1-second bins in cleaned event files. If a bin has >2000 counts, and if more than 50% of those come from <1% of pixels, then it is considered to be noise-dominated and hence unusable.
| Quadrant | # 1 sec bins | Bins with >0 counts | Bins with >2000 counts | High rate bins dominated by noise | Noise dominated (total time) | Noise dominated (detector-on time) | Marked lightcurve |
|---|---|---|---|---|---|---|---|
| A | 7298 | 6528 | 2121 | 2121 | 29.06% | 32.49% | 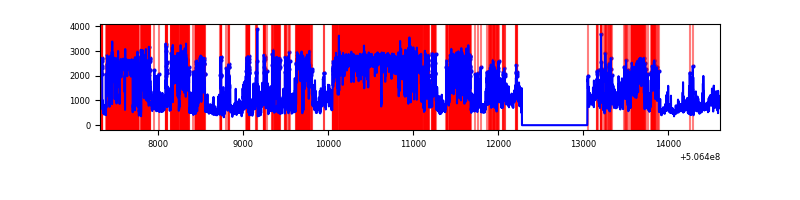 |
| B | 7298 | 6528 | 6 | 6 | 0.08% | 0.09% | 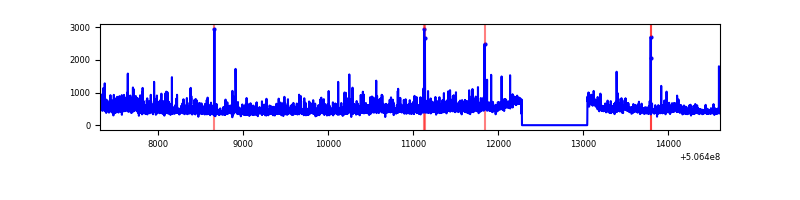 |
| C | 7299 | 6530 | 60 | 60 | 0.82% | 0.92% | 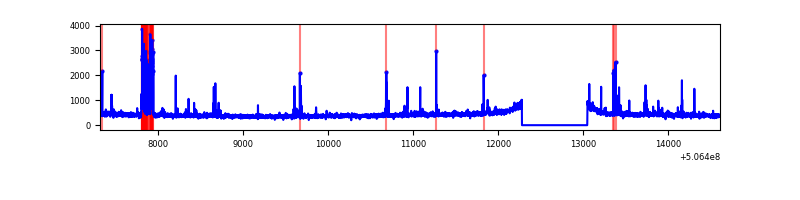 |
| D | 7299 | 6529 | 2005 | 2005 | 27.47% | 30.71% | 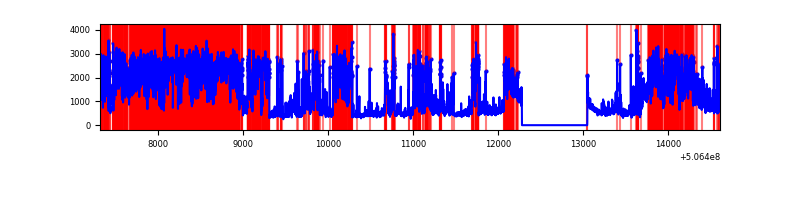 |
Top three noisy pixels from each quadrant. If the there are fewer than three noisy pixels in the level2.evt file, extra rows are filled as -1
| Pixel properties | Quadrant properties | ||||||
|---|---|---|---|---|---|---|---|
| Quadrant | DetID | PixID | Counts | Sigma | Mean | Median | Sigma |
| A | 15 | 32 | 5828416 | 40326.93 | 590 | 574 | 144.5 |
| A | 7 | 64 | 785328 | 5430.26 | 590 | 574 | 144.5 |
| A | 12 | 115 | 349244 | 2412.69 | 590 | 574 | 144.5 |
| B | 5 | 172 | 366497 | 2486.31 | 681 | 655 | 147.1 |
| B | 0 | 199 | 72654 | 489.32 | 681 | 655 | 147.1 |
| B | 9 | 251 | 23551 | 155.6 | 681 | 655 | 147.1 |
| C | 10 | 22 | 198729 | 1074.78 | 672 | 662 | 184.3 |
| C | 12 | 250 | 31508 | 167.38 | 672 | 662 | 184.3 |
| C | 14 | 254 | 27605 | 146.2 | 672 | 662 | 184.3 |
| D | 7 | 70 | 5322230 | 31007.21 | 604 | 575 | 171.6 |
| D | 11 | 129 | 521669 | 3036.21 | 604 | 575 | 171.6 |
| D | 9 | 102 | 324546 | 1887.65 | 604 | 575 | 171.6 |
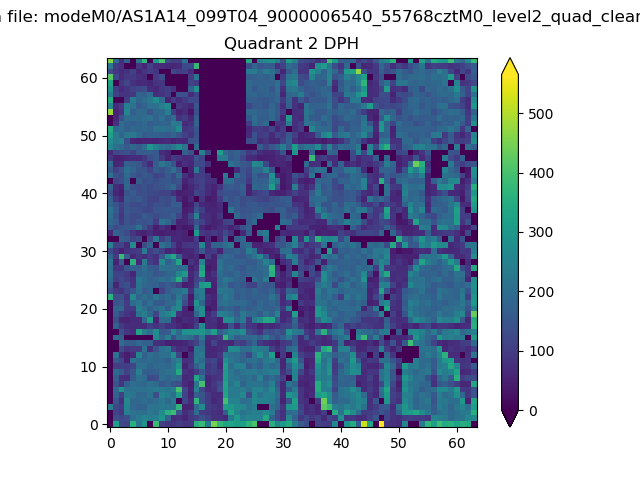
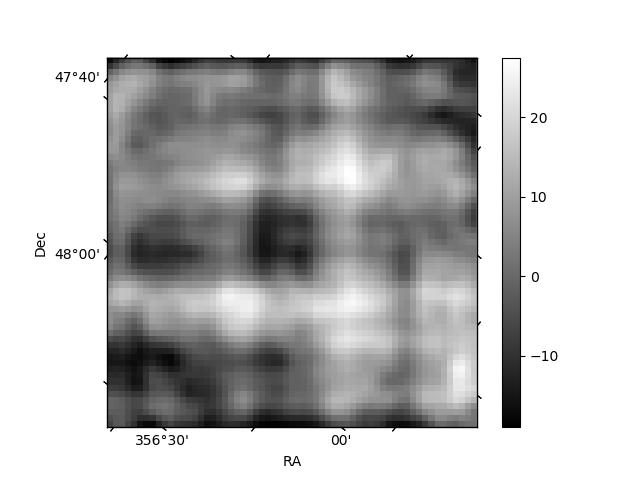
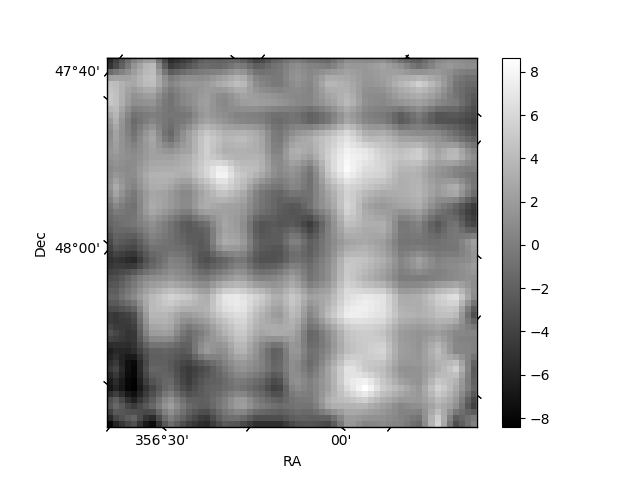
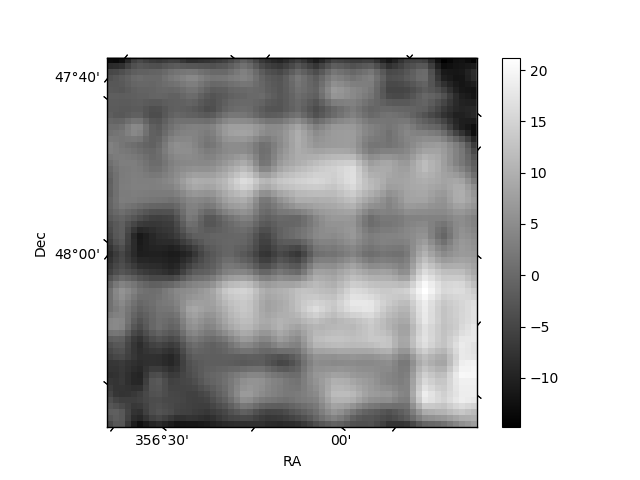
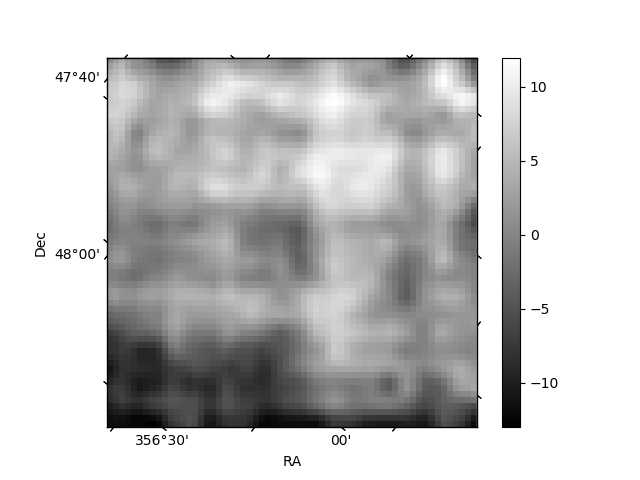
Histogram calculated using DETX and DETY for each event in the final _common_clean file
| Quadrant A | 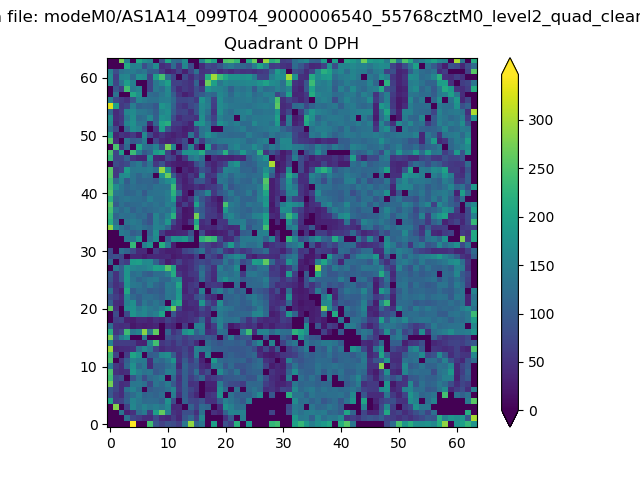 |
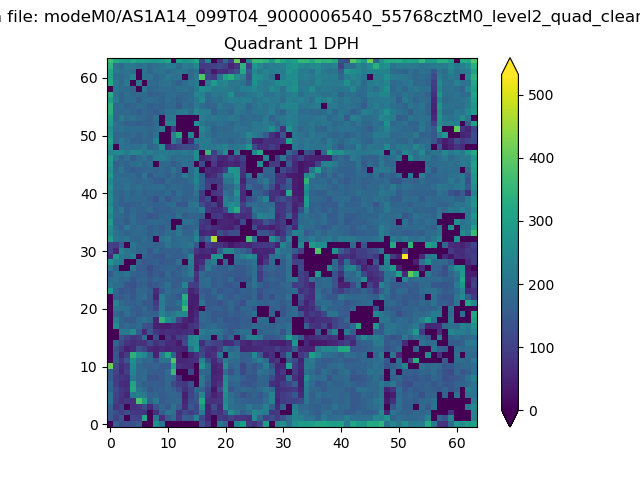 |
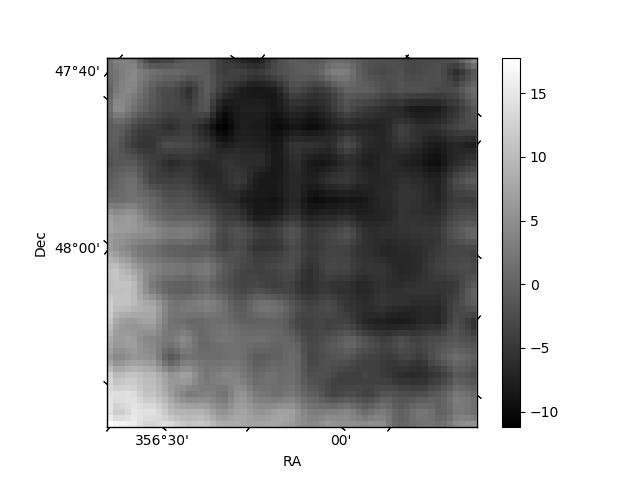
Quadrant B |
|---|---|---|---|
| Quadrant D | 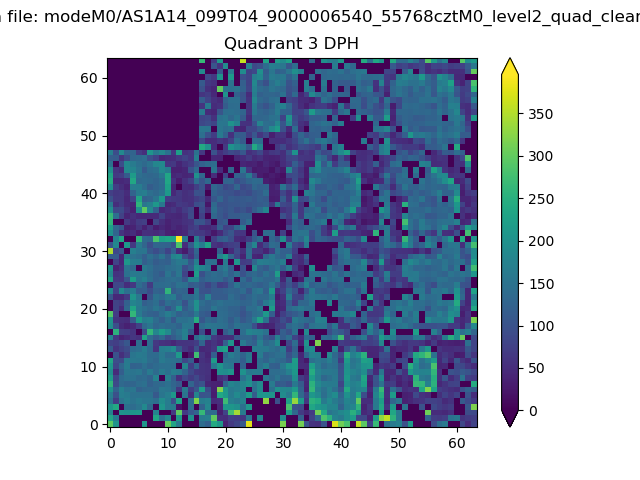 |
 |
Quadrant C |
| Plot type | Count rate plots | Images |
|---|---|---|
| Comparison with Poisson distribution Blue bars denote a histogram of data divided into 1 sec bins. Red curve is a Poisson curve with rate = median count rate of data. |
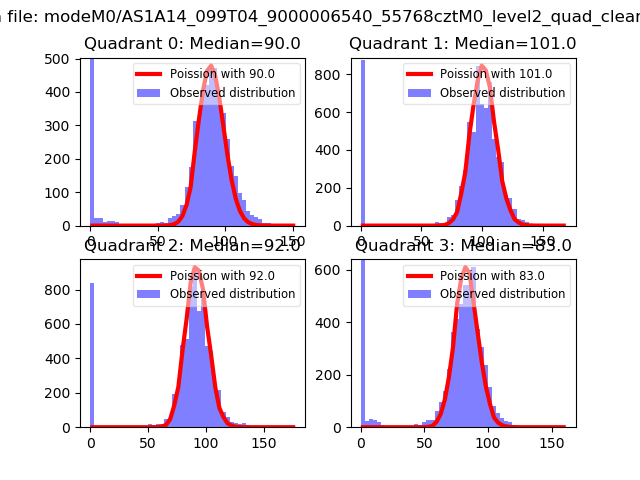 |
 |
| Quadrant-wise count rates Data is divided into 100 sec bins |
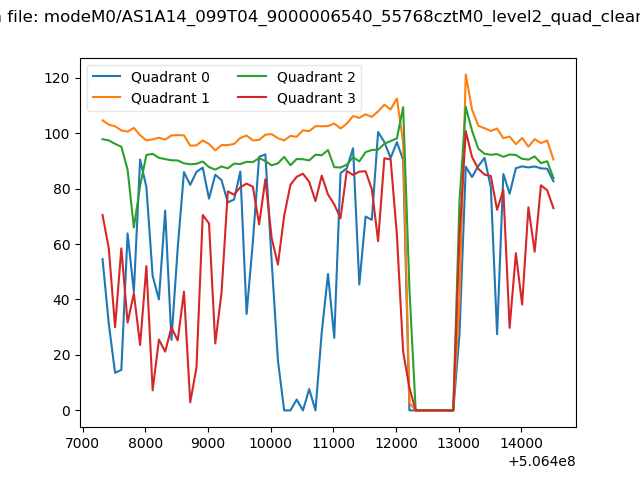 |
|
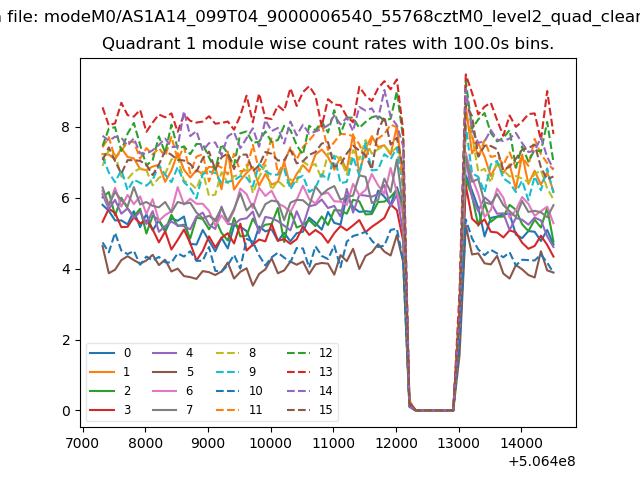
| Module-wise count rates for Quadrant A Data is divided into 100 sec bins |
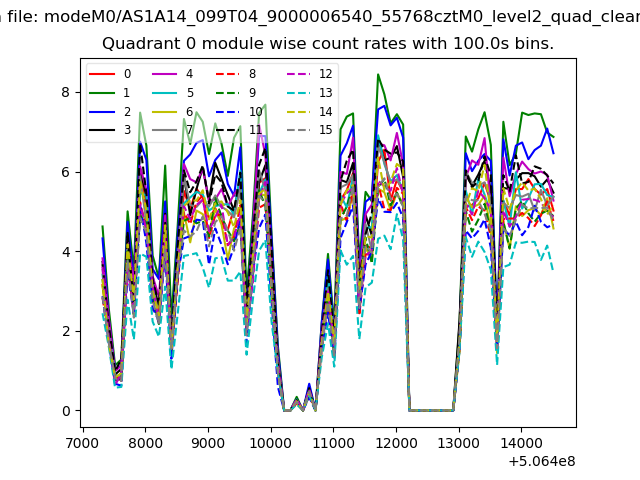 |
 |
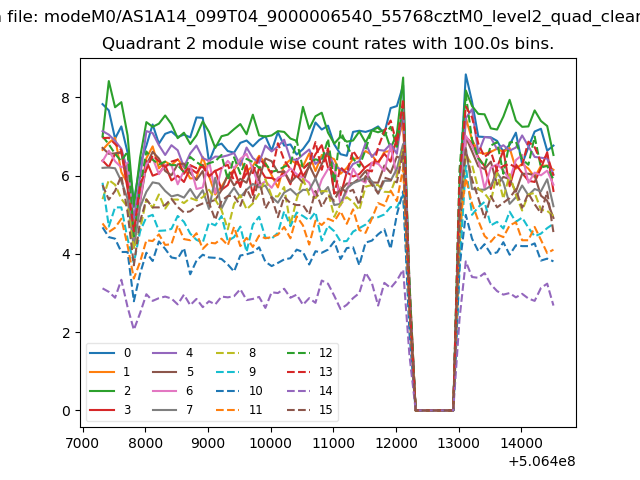
| Module-wise count rates for Quadrant B Data is divided into 100 sec bins |
 |
 |
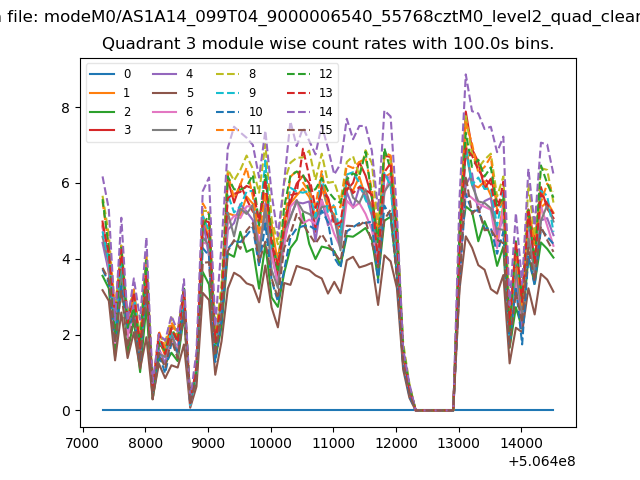
| Module-wise count rates for Quadrant C Data is divided into 100 sec bins |
 |
 |
| Module-wise count rates for Quadrant D Data is divided into 100 sec bins |
 |
 |
| Parameter | Plot |
|---|---|
| CZT HV Monitor |  |
| D_VDD | 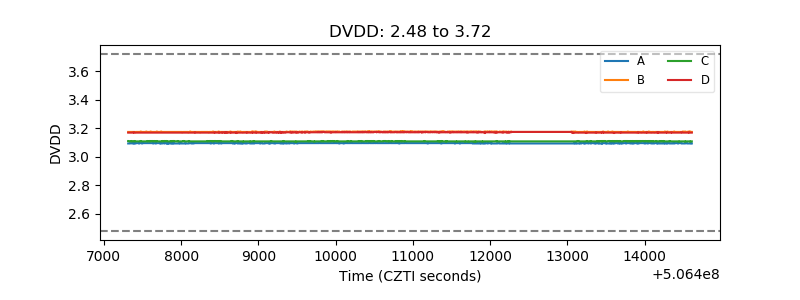 |
| Temperature 1 | 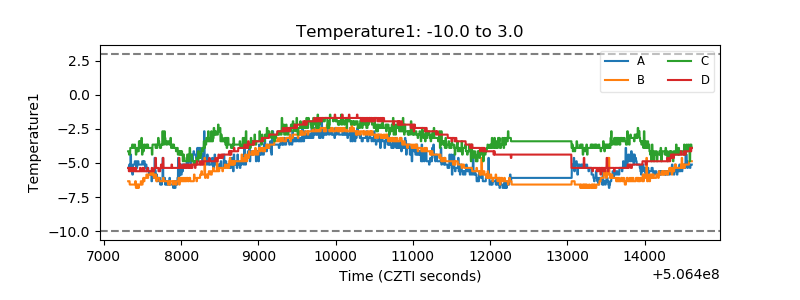 |
| Veto HV Monitor | 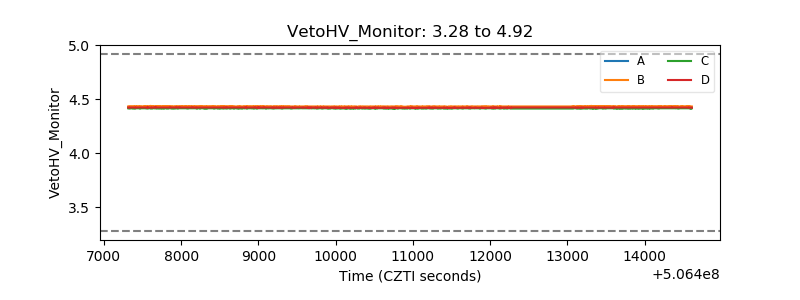 |
| Veto LLD | 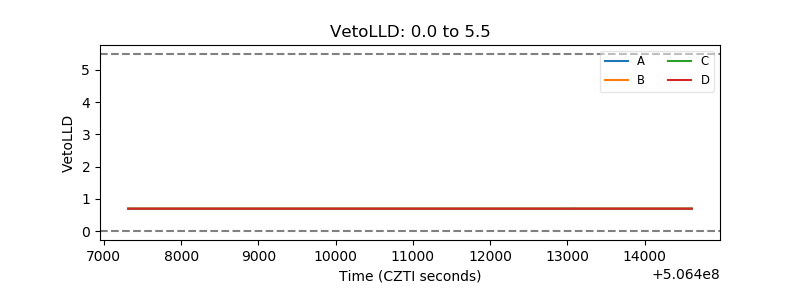 |
| Alpha Counter | 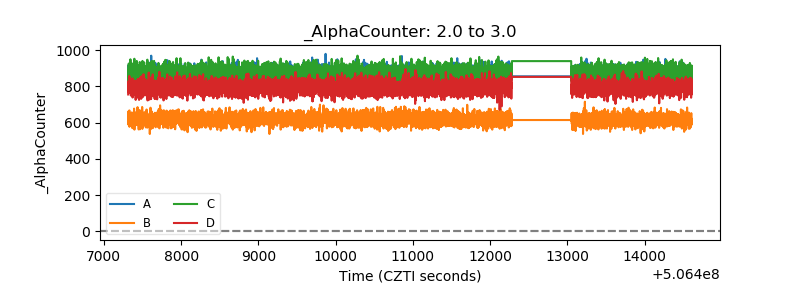 |
| _CPM_Rate | 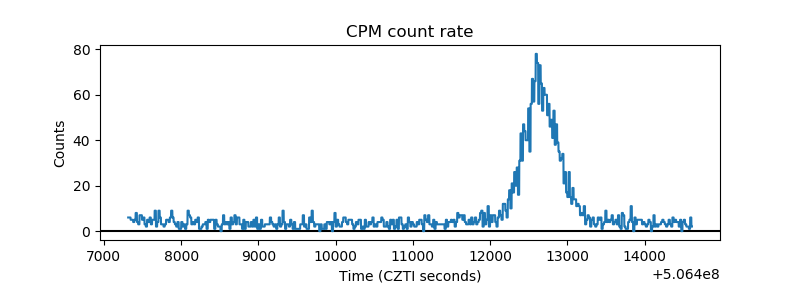 |
| CZT Counter | 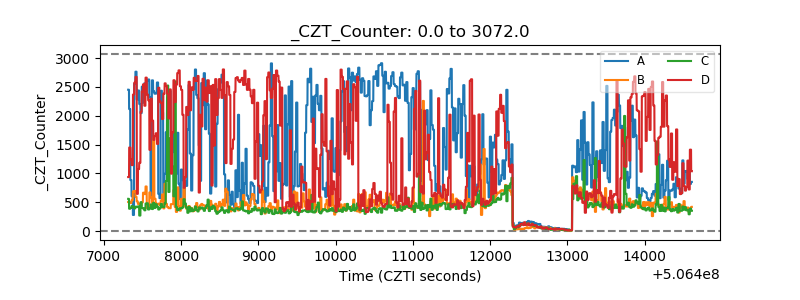 |
| +2.5 Volts monitor |  |
| +5 Volts monitor |  |
| _ROLL_ROT | 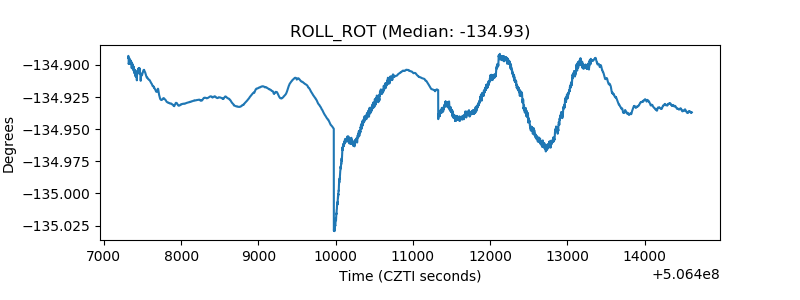 |
| _Roll_DEC | 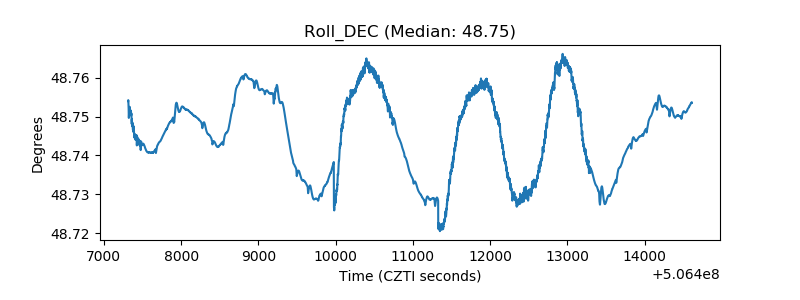 |
| _Roll_RA | 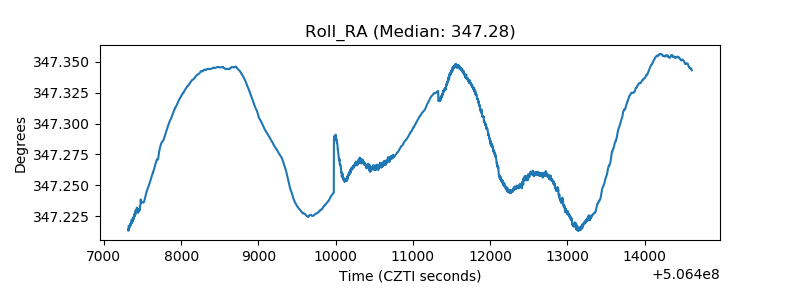 |
| Veto Counter | 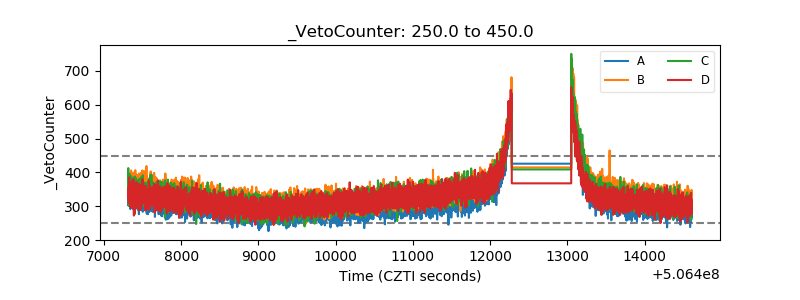 |