| Param | Original file | Final file |
|---|---|---|
| Filename | modeM0/AS1A14_099T04_9000006540_55769cztM0_level2.fits | modeM0/AS1A14_099T04_9000006540_55769cztM0_level2_quad_clean.evt |
| Size (bytes) | 649,607,040 | 95,955,840 |
| Size | 619.5 MB | 91.5 MB |
| Events in quadrant A | 9,531,571 | 516,269 |
| Events in quadrant B | 3,524,737 | 698,207 |
| Events in quadrant C | 3,665,954 | 641,568 |
| Events in quadrant D | 6,765,834 | 547,990 |
| Mode M0 | |||
|---|---|---|---|
| Quadrant | BADHDUFLAG | Total packets | Discarded packets |
| A | 0 | 33199 | 2 |
| B | 0 | 15696 | 3 |
| C | 0 | 16532 | 2 |
| D | 0 | 25198 | 2 |
| Mode SS | |||
|---|---|---|---|
| Quadrant | BADHDUFLAG | Total packets | Discarded packets |
| A | 0 | 144 | 0 |
| B | 0 | 144 | 0 |
| C | 0 | 144 | 0 |
| D | 0 | 144 | 0 |
| Quadrant | Total seconds | Saturated seconds | Saturation percentage |
|---|---|---|---|
| A | 7197 | 1879 | 26.108101% |
| B | 7197 | 317 | 4.404613% |
| C | 7197 | 231 | 3.209671% |
| D | 7197 | 970 | 13.477838% |
Noise dominated data is calculated using 1-second bins in cleaned event files. If a bin has >2000 counts, and if more than 50% of those come from <1% of pixels, then it is considered to be noise-dominated and hence unusable.
| Quadrant | # 1 sec bins | Bins with >0 counts | Bins with >2000 counts | High rate bins dominated by noise | Noise dominated (total time) | Noise dominated (detector-on time) | Marked lightcurve |
|---|---|---|---|---|---|---|---|
| A | 7227 | 7197 | 1580 | 1580 | 21.86% | 21.95% | 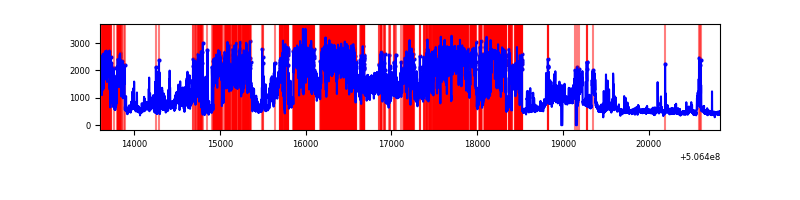 |
| B | 7227 | 7199 | 6 | 6 | 0.08% | 0.08% | 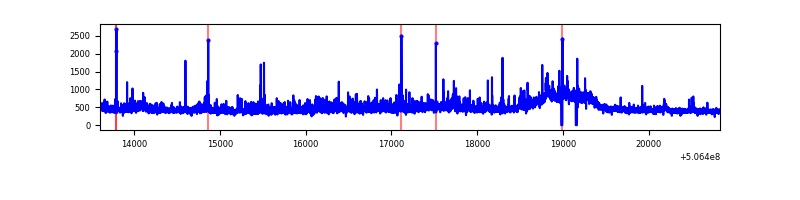 |
| C | 7227 | 7199 | 76 | 76 | 1.05% | 1.06% | 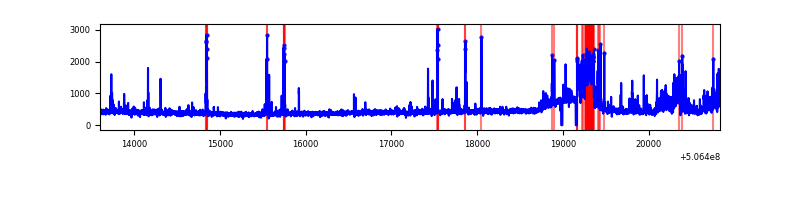 |
| D | 7226 | 7198 | 925 | 925 | 12.80% | 12.85% | 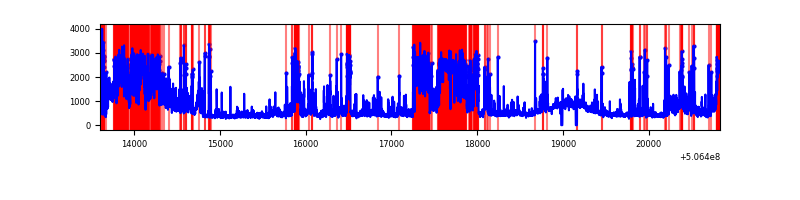 |
Top three noisy pixels from each quadrant. If the there are fewer than three noisy pixels in the level2.evt file, extra rows are filled as -1
| Pixel properties | Quadrant properties | ||||||
|---|---|---|---|---|---|---|---|
| Quadrant | DetID | PixID | Counts | Sigma | Mean | Median | Sigma |
| A | 15 | 32 | 5463765 | 31052.11 | 722 | 703 | 175.9 |
| A | 7 | 64 | 322045 | 1826.51 | 722 | 703 | 175.9 |
| A | 3 | 14 | 295902 | 1677.91 | 722 | 703 | 175.9 |
| B | 5 | 172 | 211874 | 1268.9 | 764 | 735 | 166.4 |
| B | 7 | 0 | 145621 | 870.73 | 764 | 735 | 166.4 |
| B | 0 | 199 | 55646 | 330.0 | 764 | 735 | 166.4 |
| C | 9 | 38 | 480469 | 2343.62 | 749 | 741 | 204.7 |
| C | 13 | 3 | 69179 | 334.34 | 749 | 741 | 204.7 |
| C | 6 | 223 | 68103 | 329.08 | 749 | 741 | 204.7 |
| D | 7 | 70 | 2630741 | 12933.83 | 729 | 696 | 203.3 |
| D | 11 | 129 | 653835 | 3211.95 | 729 | 696 | 203.3 |
| D | 8 | 240 | 163851 | 802.35 | 729 | 696 | 203.3 |
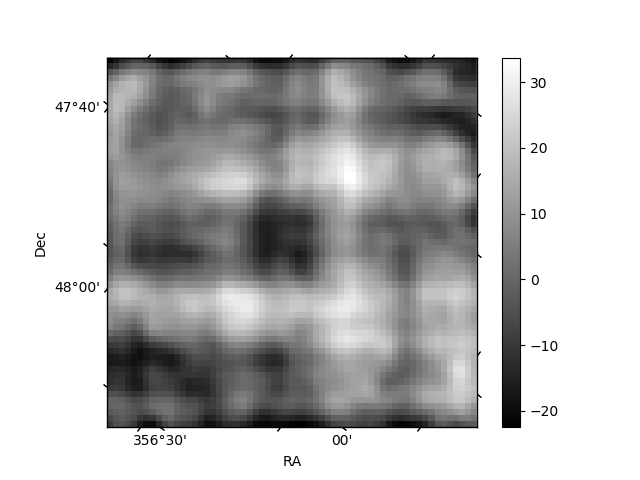
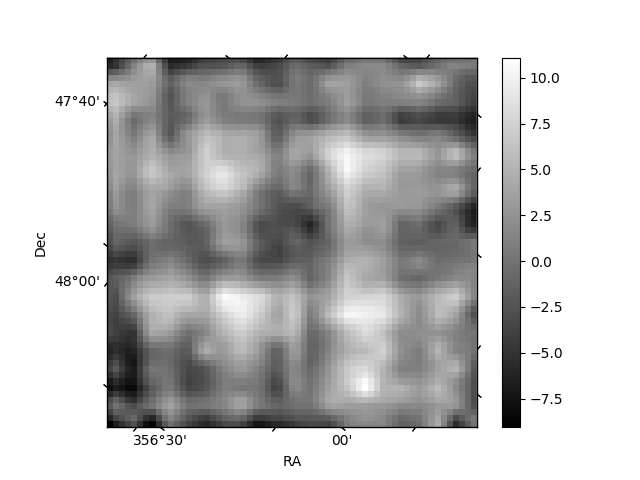
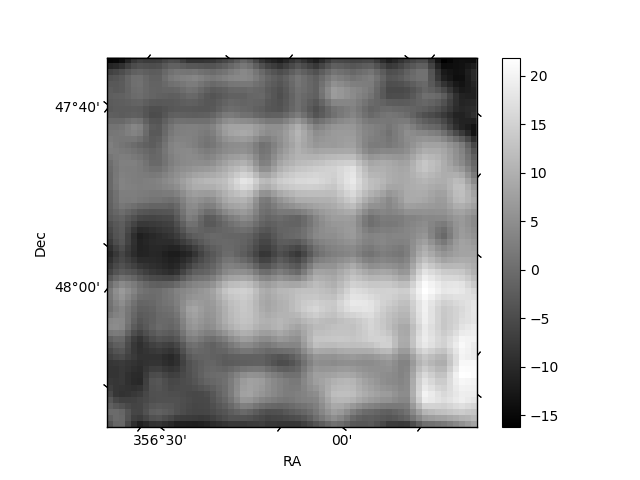
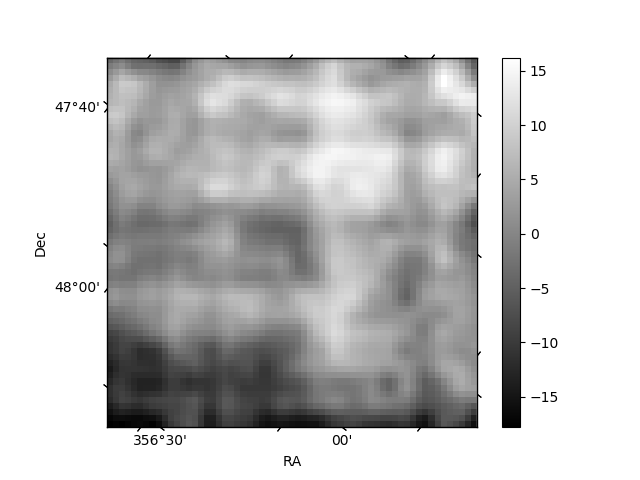
Histogram calculated using DETX and DETY for each event in the final _common_clean file
| Quadrant A | 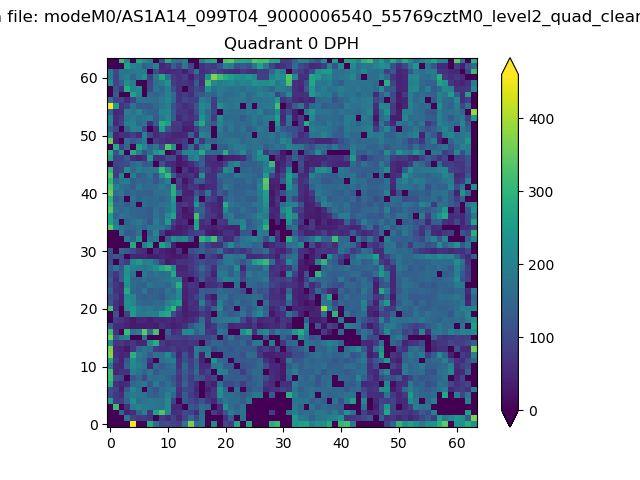 |
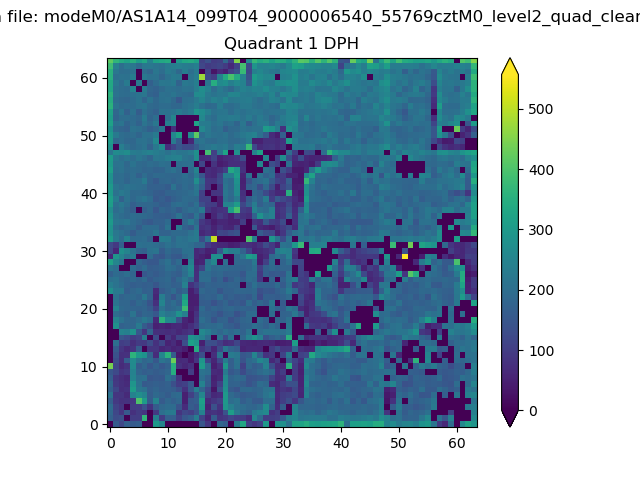 |
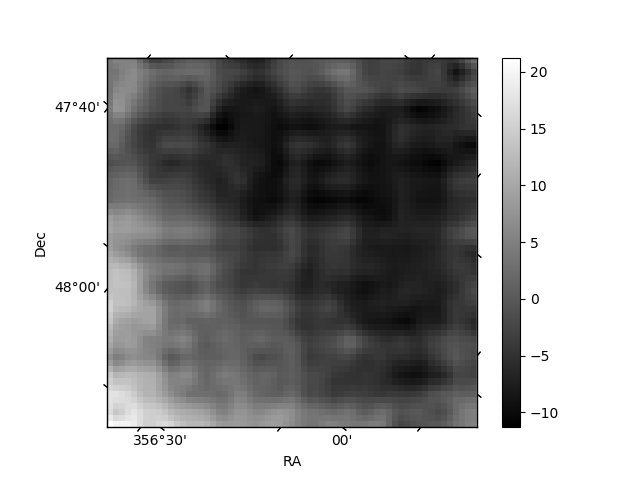
Quadrant B |
|---|---|---|---|
| Quadrant D | 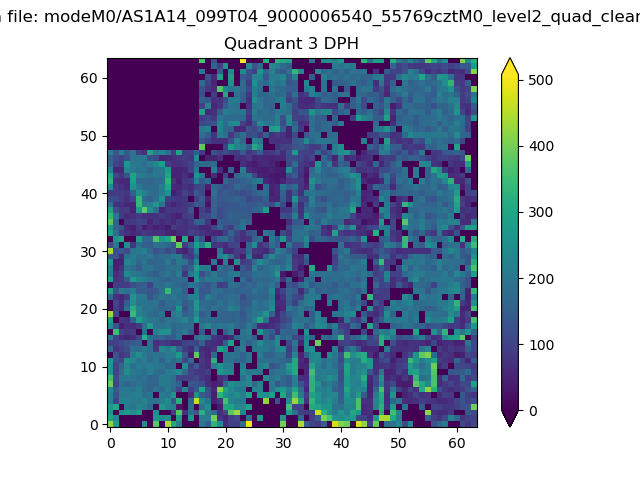 |
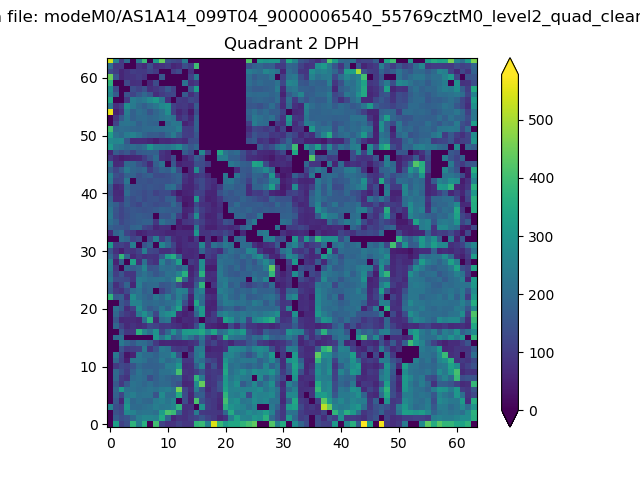 |
Quadrant C |
| Plot type | Count rate plots | Images |
|---|---|---|
| Comparison with Poisson distribution Blue bars denote a histogram of data divided into 1 sec bins. Red curve is a Poisson curve with rate = median count rate of data. |
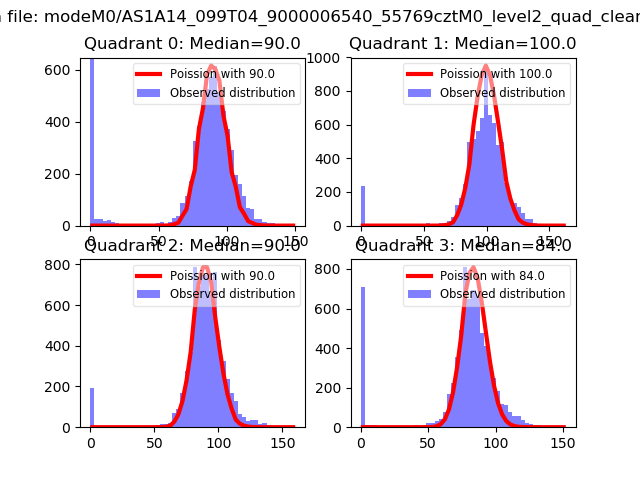 |
 |
| Quadrant-wise count rates Data is divided into 100 sec bins |
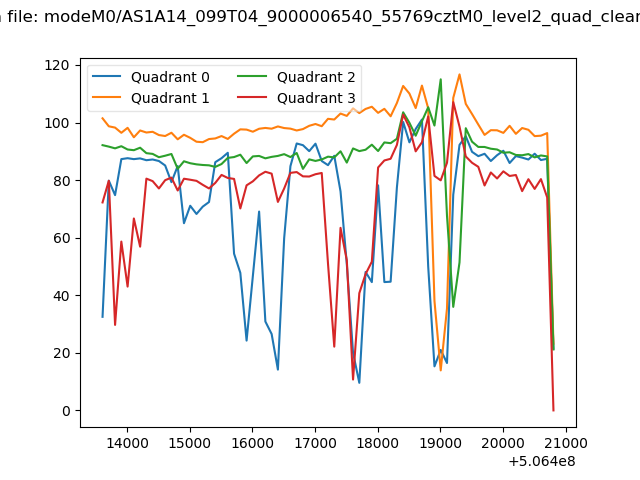 |
|
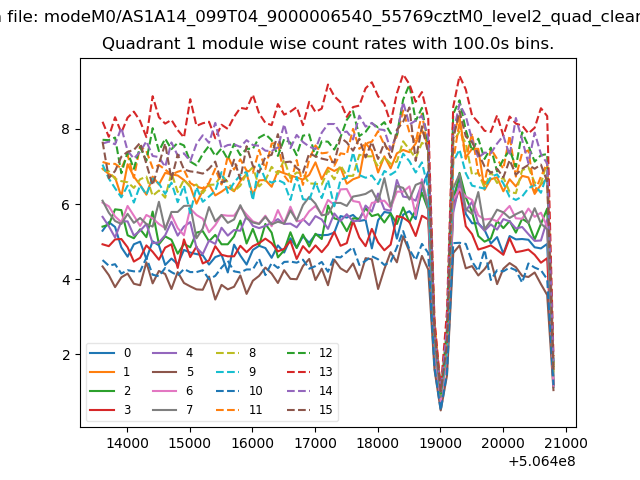
| Module-wise count rates for Quadrant A Data is divided into 100 sec bins |
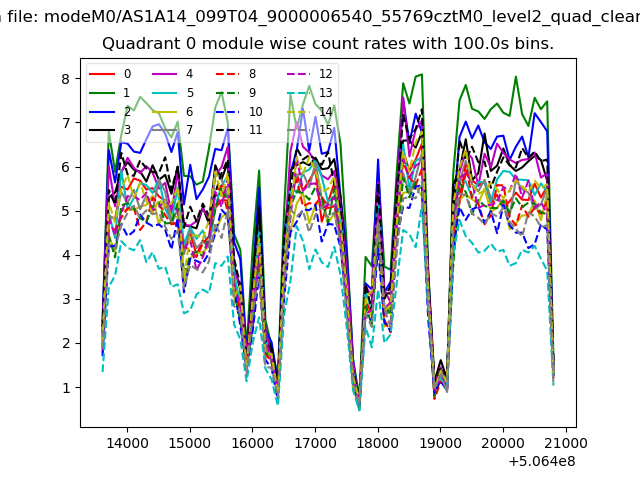 |
 |
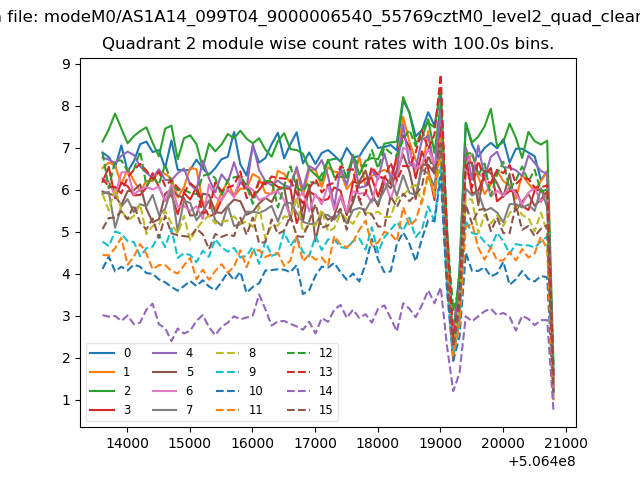
| Module-wise count rates for Quadrant B Data is divided into 100 sec bins |
 |
 |
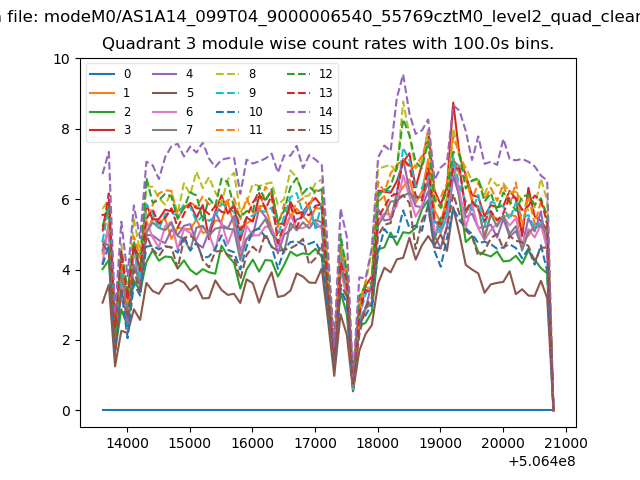
| Module-wise count rates for Quadrant C Data is divided into 100 sec bins |
 |
 |
| Module-wise count rates for Quadrant D Data is divided into 100 sec bins |
 |
 |
| Parameter | Plot |
|---|---|
| CZT HV Monitor | 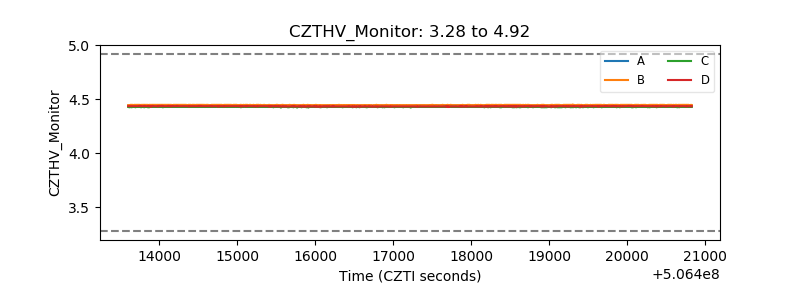 |
| D_VDD | 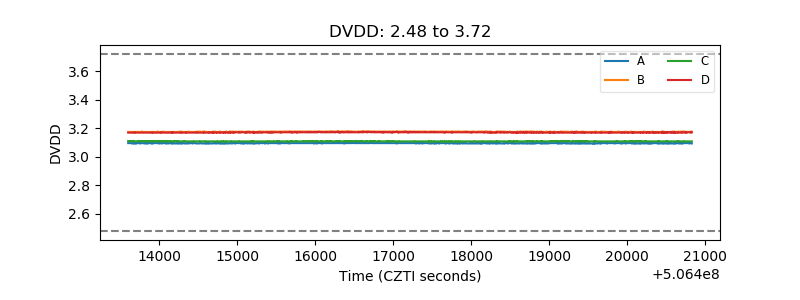 |
| Temperature 1 | 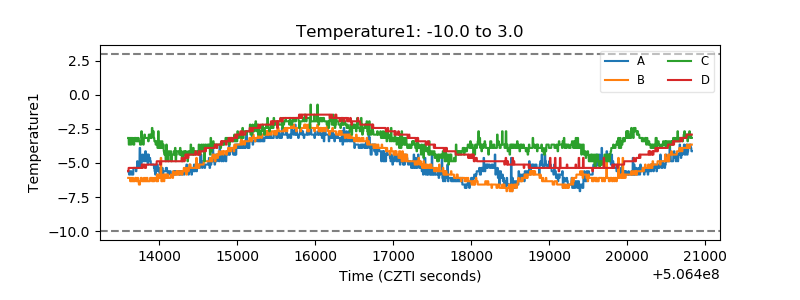 |
| Veto HV Monitor | 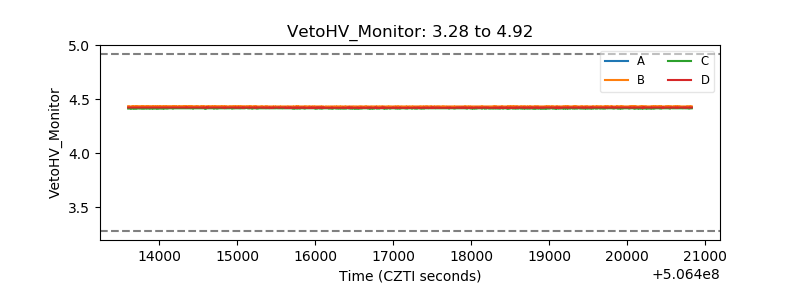 |
| Veto LLD | 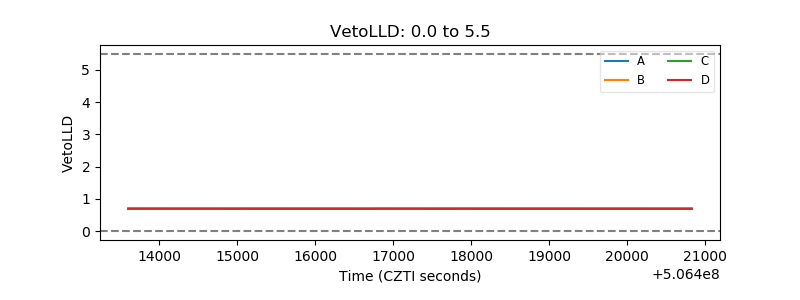 |
| Alpha Counter | 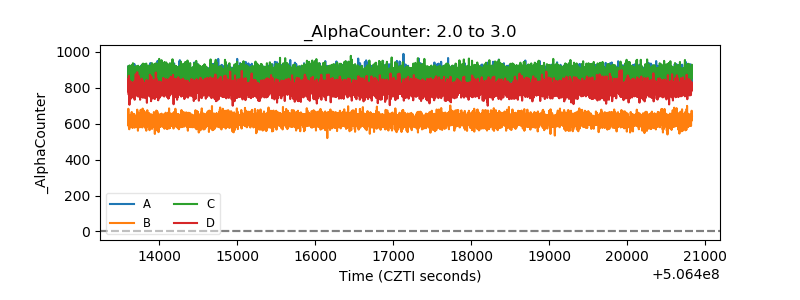 |
| _CPM_Rate | 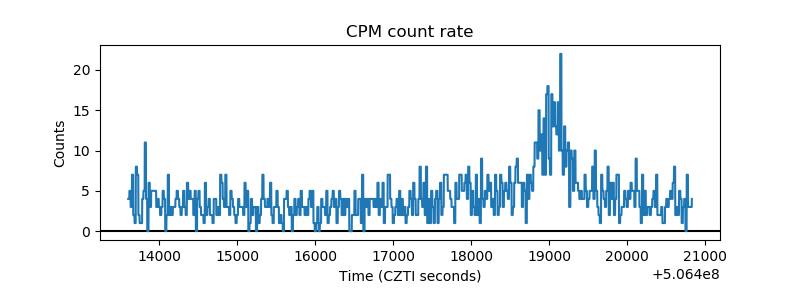 |
| CZT Counter | 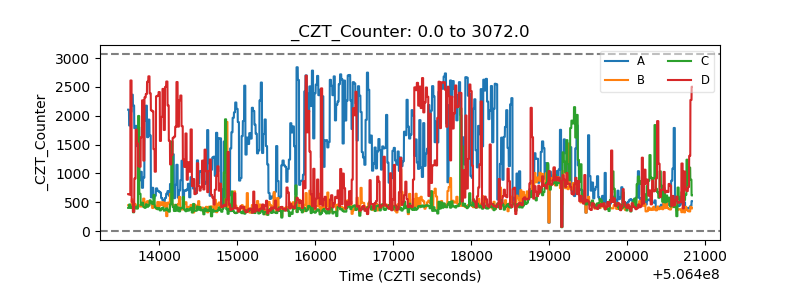 |
| +2.5 Volts monitor |  |
| +5 Volts monitor |  |
| _ROLL_ROT | 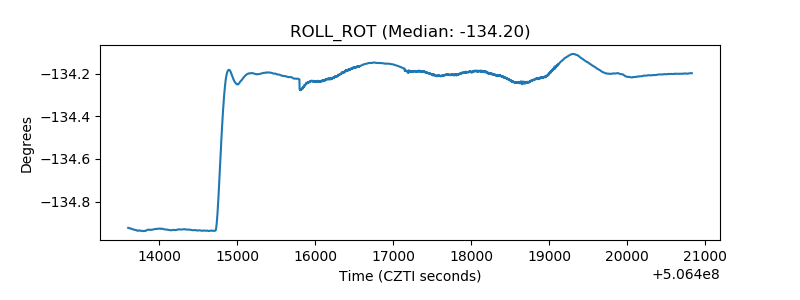 |
| _Roll_DEC | 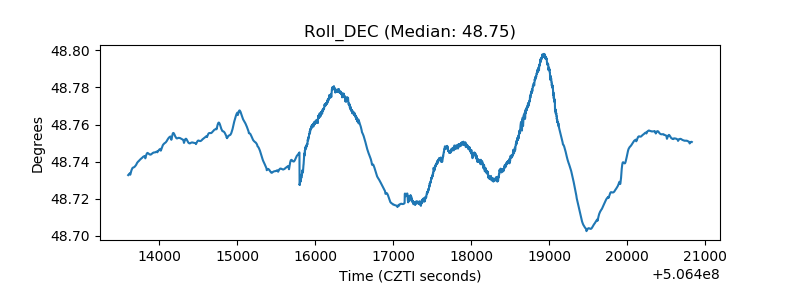 |
| _Roll_RA | 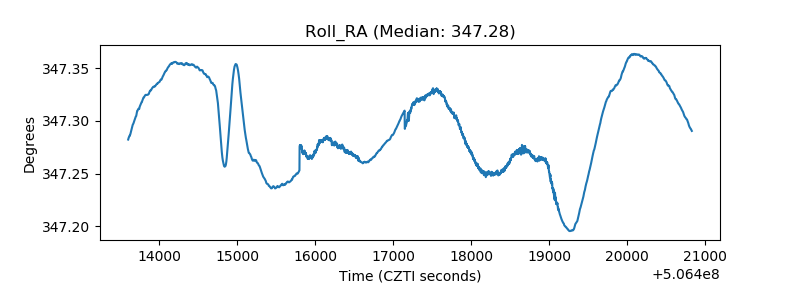 |
| Veto Counter | 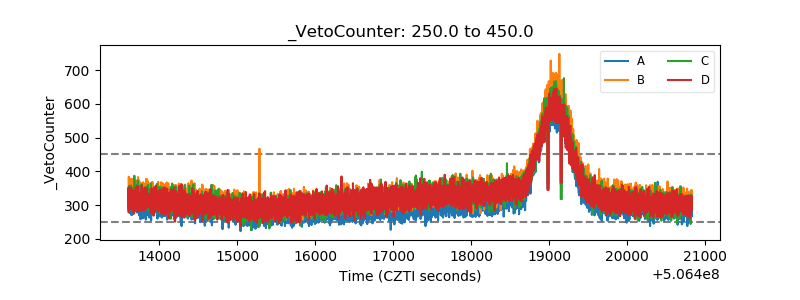 |